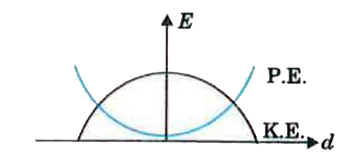
For a simple pendulum, a graph is plotted its kinetic energy (KE) and potential energy (PE) against its displacement d. Which one of the following represents these correctly?
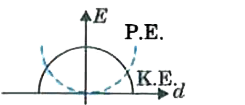
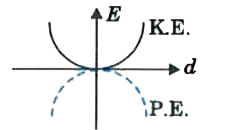
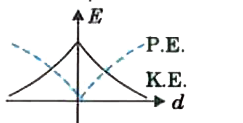

The correct Answer is:A
v=ω√a2−y2
K.E. =12mω2(a2−y2), P.E. =12mω2y2
At mean position y=0,K.E.max=12mω2a2
P.E.min=0
Topper's Solved these Questions
- OSCILLATIONS BOOK - MODERN PUBLICATIONCHAPTER - OSCILLATIONS EXERCISE - Competition File (JEE (Advanced) For IIT Entrance)
7 Videos
- OSCILLATIONS BOOK - MODERN PUBLICATIONCHAPTER - OSCILLATIONS EXERCISE - Competition File (Multiple choice question)
11 Videos
- OSCILLATIONS BOOK - MODERN PUBLICATIONCHAPTER - OSCILLATIONS EXERCISE - Competition File (Multiple choice questions) AIPMT/NEET other State Boards for Medical Entrance
14 Videos
- MOTION IN A STRAIGHT LINE BOOK - MODERN PUBLICATIONCHAPTER - MOTION IN A STRAIGHT LINE EXERCISE - CHAPTER PRACTICE TEST
16 Videos
- PHYSICAL WORLD BOOK - MODERN PUBLICATIONCHAPTER - PHYSICAL WORLD EXERCISE - Revision exercises (Long answer questions)
6 Videos
Similar Questions
A particle is executing simple harmonic motion with amplitude A. When the ratio of its kinetic energy to the potential energy is 14 , its displacement from its mean position is
View SolutionDraw a graph to show the variation of PE, KE and total energy of a simple harmonic oscillator with displacement.
View Solution
Knowledge Check
For a simple pendulum, a graph is plotted between itskinetic energy (KE) and potential energy (PE)against its displacement d. Which one of the following represents these correctly? (graph are schematic and not drawn to scale)
A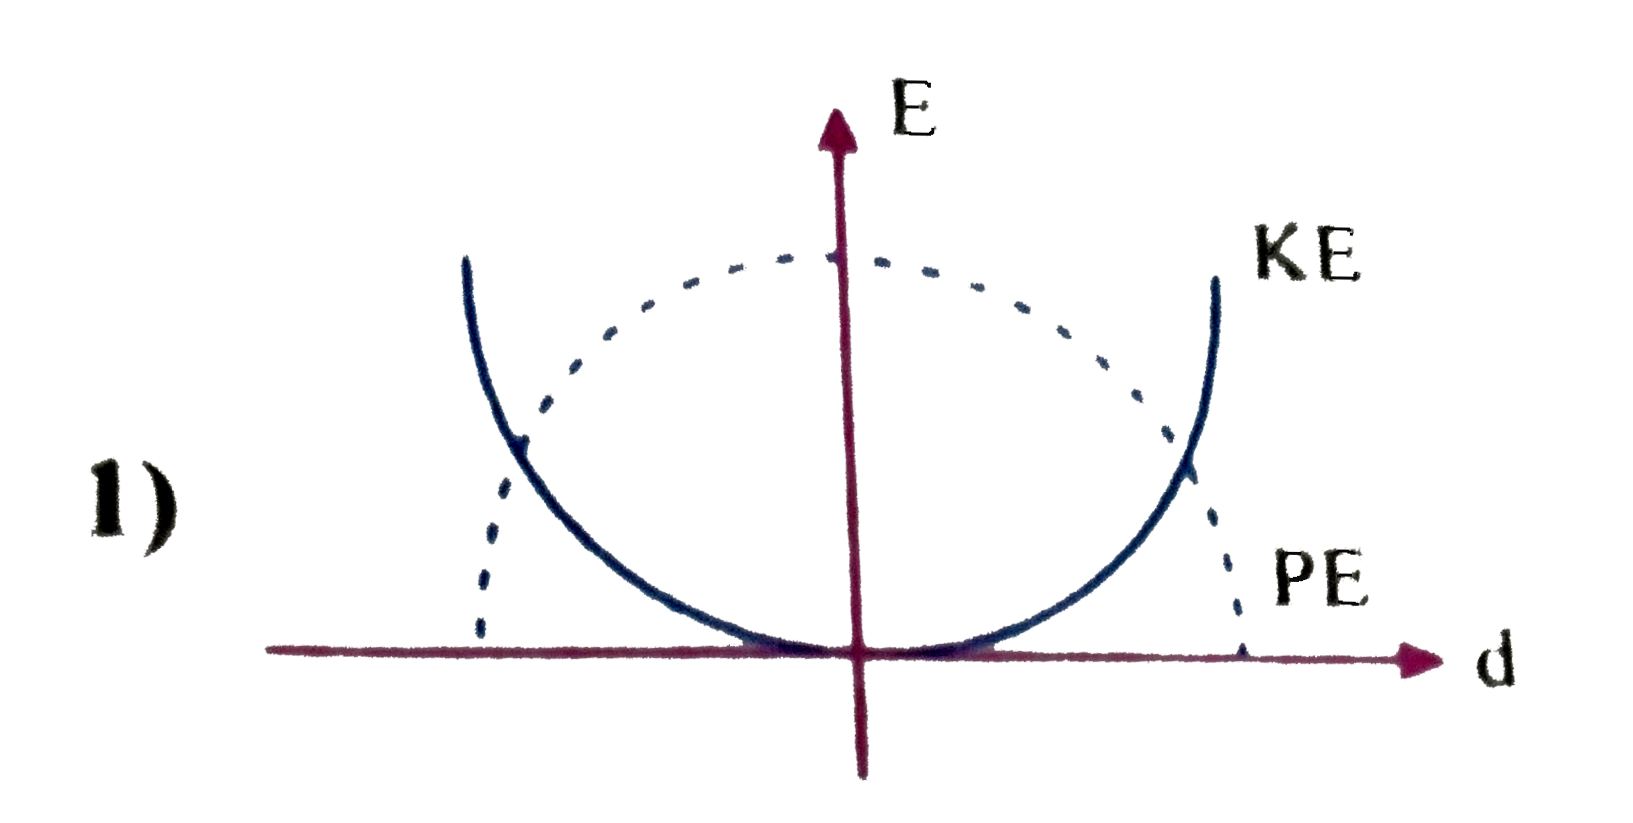 B
B C
C D
D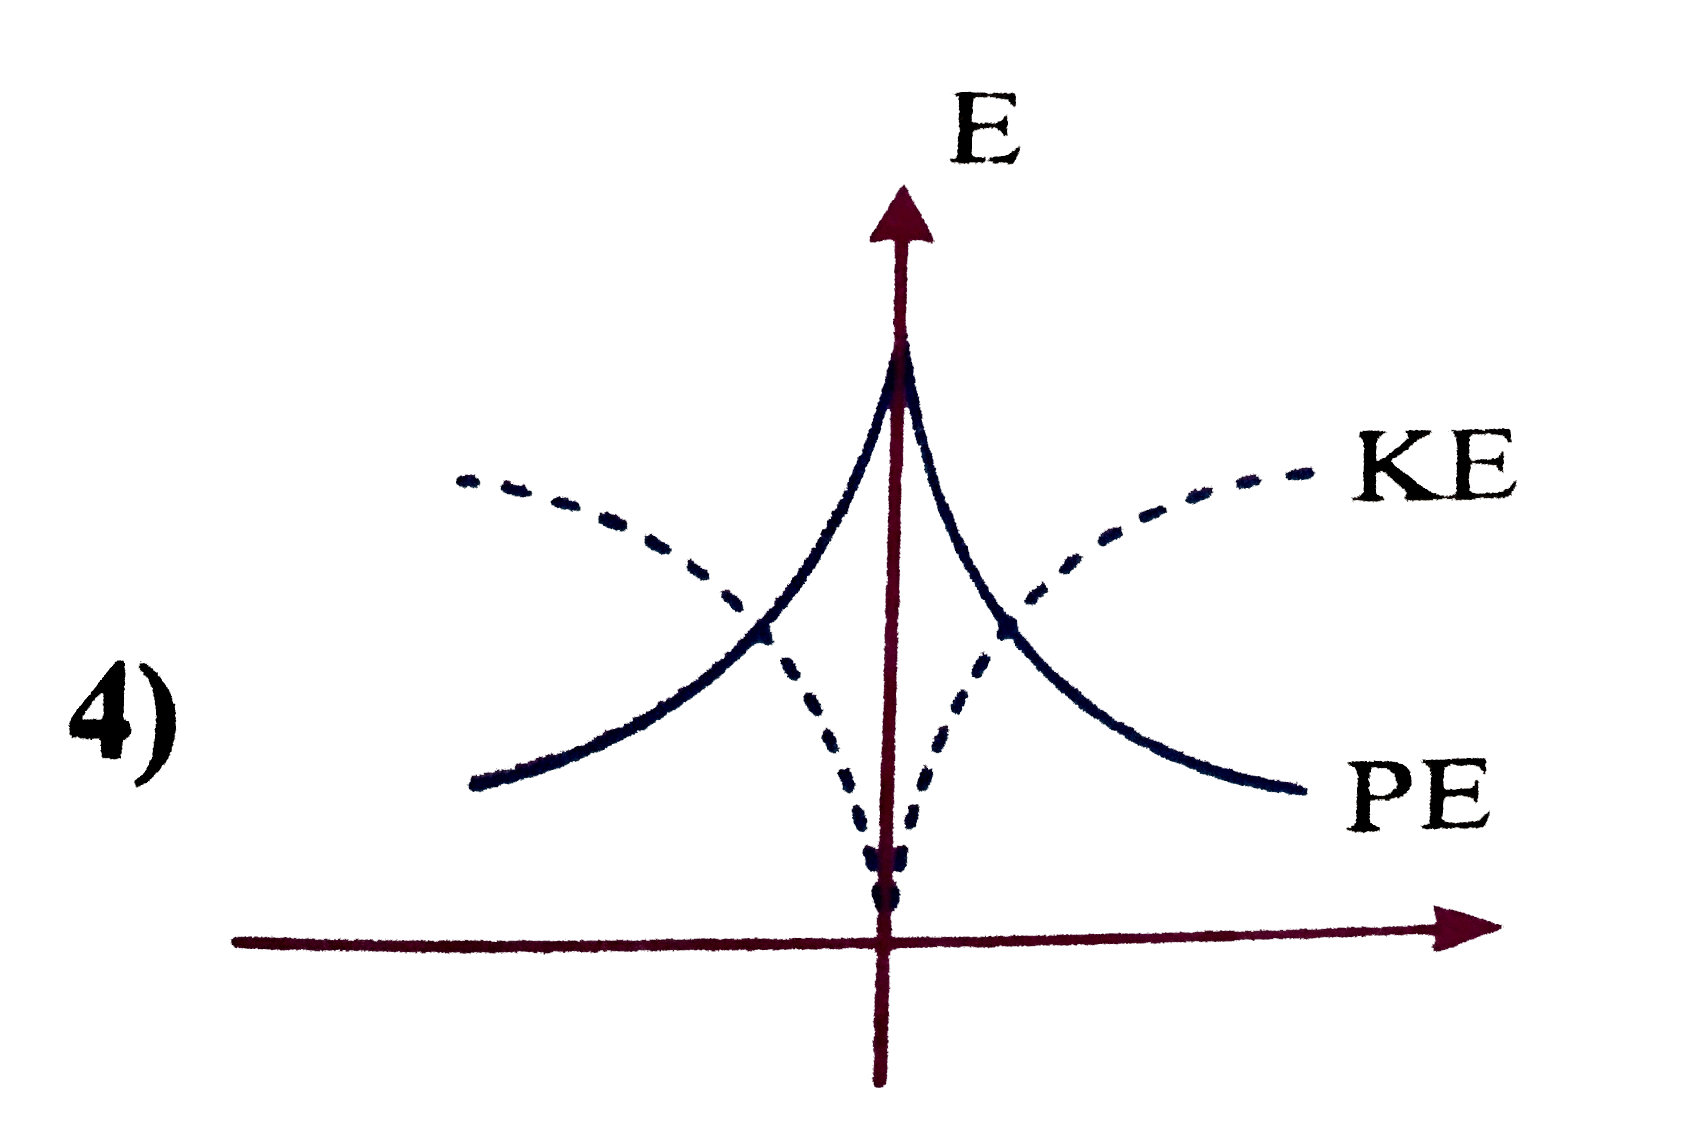
A body executes simple harmonic motion. The potential energy (P.E), the kinetic energy (K.E) and energy (T.E) are measured as a function of displacement x. Which of the following staements is true?
A(a) K.E. is maximum when x=0.B(b) T.E is zero when x=0C(c ) K.E is maximum when x is maximumD(d) P.E is maximum when x=0In the fig. The potential energy U of a particle plotted against its position x from origin. Which of the following statement is correct
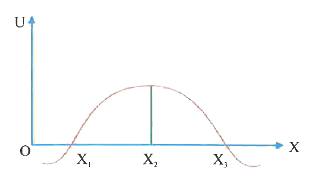 Aat x1 particle is in stable equilivriumBat x2 particle is in stable equilibriumCat x3 particle is in stable equilibriumDat x1,x2andx3 particle is in unstable equilibrium
State an expression for K.E. (kinetic energy) and P.E. (potential energy) at displacement 'x' for a particle performing linear S.H.M. Represent them graphically. Find the displacement at which K.E. is equal to P.E.
View SolutionThe ratio of the kinetic to potential energy of a particle in SHM, when its displacement is one-half the amplitude, is
View SolutionIf x, v, a, K.E. and P.E. represent displacement, velocity, acceleration, kinetic energy and potential energy at any instant respectively for a particle executing S.H.M., then which of the following statements is INCORRECT?
View SolutionIf the length of a simple pendulum is halved, then its energy becomes
View SolutionConsider the following statements for a simple harmonic motion:
1. The magnitude of the velocity of the body is proportional to its displacement from the mean position.
2. The magnitude of the acceleration of the body is proportional to its displacement from the mean position.
3. The sum of the kinetic energy and potential energy of the body is always constant. Which of the statements given above is/are correct?
View Solution
