The bar graph shown below reveals the data about the no. of students in different disciplines of MBA at a prominent Business School in India.
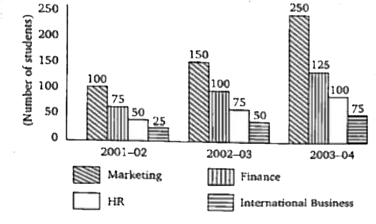
Total no. of MBA students in the session of 2004-05 if the no. of students in 2004-2005 is increasing by 9.09% over the previous year :
555
600
777
none of these
The correct Answer is:B
Step by step video, text & image solution for The bar graph shown below reveals the data about the no. of students in different disciplines of MBA at a prominent Business School in India. Total no. of MBA students in the session of 2004-05 if the no. of students in 2004-2005 is increasing by 9.09% over the previous year : by Maths experts to help you in doubts & scoring excellent marks in Class 14 exams.
Updated on:21/07/2023Topper's Solved these Questions
- PERCENTAGESBook:ARIHANT SSCChapter:PERCENTAGESExercise:Exercise (Level - 2)
Explore 50 Videos
- PERCENTAGEBook:ARIHANT SSCChapter:PERCENTAGEExercise:Higher Skill Level Questions
Explore 27 Videos
- PERMUTATIONS & COMBINATIONS Book:ARIHANT SSCChapter:PERMUTATIONS & COMBINATIONS Exercise:FINAL ROUND
Explore 38 Videos
Similar Questions
The bar graph given below shows the data of the production of paper (in lakh tonnes) by three different companies P, Q and R over the years.
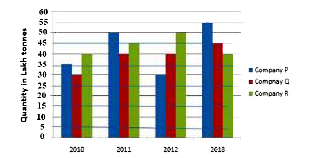
What is the percentage increase in the productionby company Q from 2010 to 2013?
View SolutionThe given bar graph shows the number of students of two schools over a period of six years.
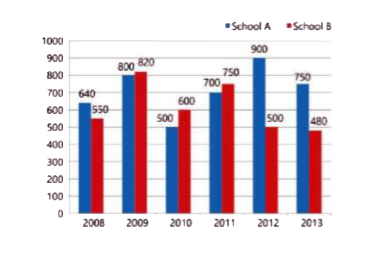
In the bar graph, what is the ratio of the average of total students from school B to the average of total students from school A?
View Solution
Knowledge Check
The bar graph shown below reveals the data about the no. of students in different disciplines of MBA at a prominent Business School in India.
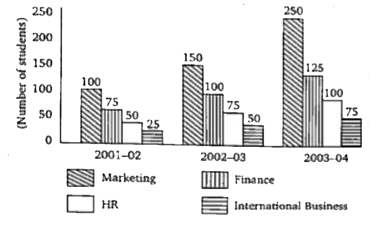
The growth rate of Finance compares to that of marketing is :AlessBequalCgreaterDnone of theseThe bar graph shown below reveals the data about the no. of students in different disciplines of MBA at a prominent Business School in India.
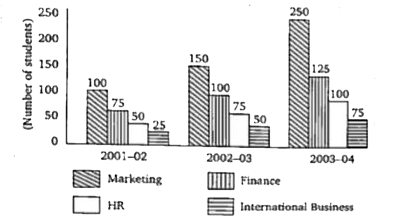
In the session of 2002-03 what percentage of MBA students are studying International Business ?A0.1333B0.25C0.0666D0.24The given Bar graph presents the numbers of students from Science and Arts streams from a school in different years.
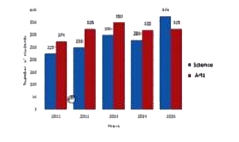
In which year the number of Arts students is 30% more than that of Science?A2013B2014C2012D2011
The bar chart given below shows the number of students (in '00) in a schoool from year 2000 to year 2004.
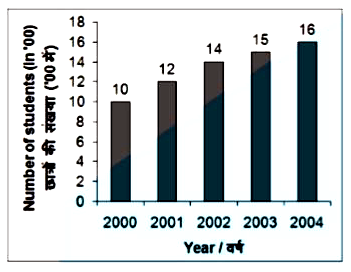
What is the difference between the total number of students in year 2004 and 2000?
View SolutionThe given Bar graph present the number of students from Science and Arts streams from a school in different years
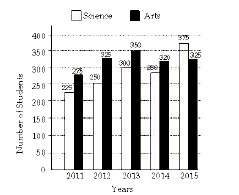
The total number of Arts students in 2011, 2013 and 2015 is what percentage less than that of science in the given five years
View SolutionThe bar chart given below shows the number of students (in '00) in a schoool from year 2000 to year 2004.
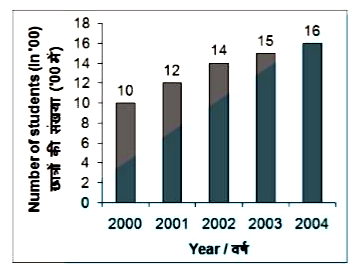
What is the total number of students in year 2002 and 2003?
View SolutionThe given Bar graph presents the numbers of students from Science and Arts streams from a school in different years.
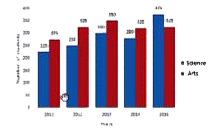
The average of number of Science stu- dents in 2011, 2013 and 2015 is what percentage more than the number of Arts students in 2011?
View SolutionStudy the following graph carefully and answer the questions given below. The number of students who joined and left the school in the beginning of year for six years from 2003 to 2008. (Initial Strength of the school is 2000)
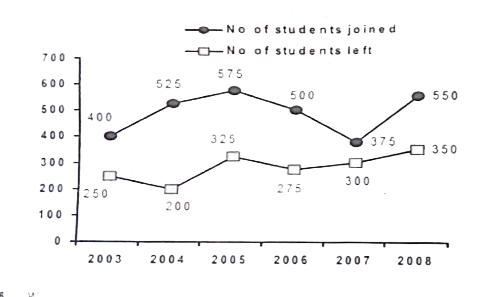
The number of students in 2006 is approximately what percent of the number of student in 2004 ?
View Solution
