In India there were only three bicycle making companies in the given period. The following table shows the production of units (in 000)
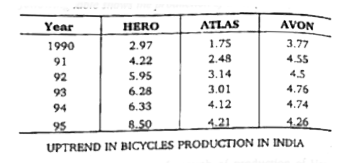
The simple average rate of growth of production of Hero cycles from 1990-95 :
0.37
5.7
0.27
31.5%
The correct Answer is:A
Step by step video, text & image solution for In India there were only three bicycle making companies in the given period. The following table shows the production of units (in 000) The simple average rate of growth of production of Hero cycles from 1990-95 : by Maths experts to help you in doubts & scoring excellent marks in Class 14 exams.
Updated on:21/07/2023Topper's Solved these Questions
- PERCENTAGESBook:ARIHANT SSCChapter:PERCENTAGESExercise:Exercise (Level - 2)
Explore 50 Videos
- PERCENTAGEBook:ARIHANT SSCChapter:PERCENTAGEExercise:Higher Skill Level Questions
Explore 27 Videos
- PERMUTATIONS & COMBINATIONS Book:ARIHANT SSCChapter:PERMUTATIONS & COMBINATIONS Exercise:FINAL ROUND
Explore 38 Videos
Similar Questions
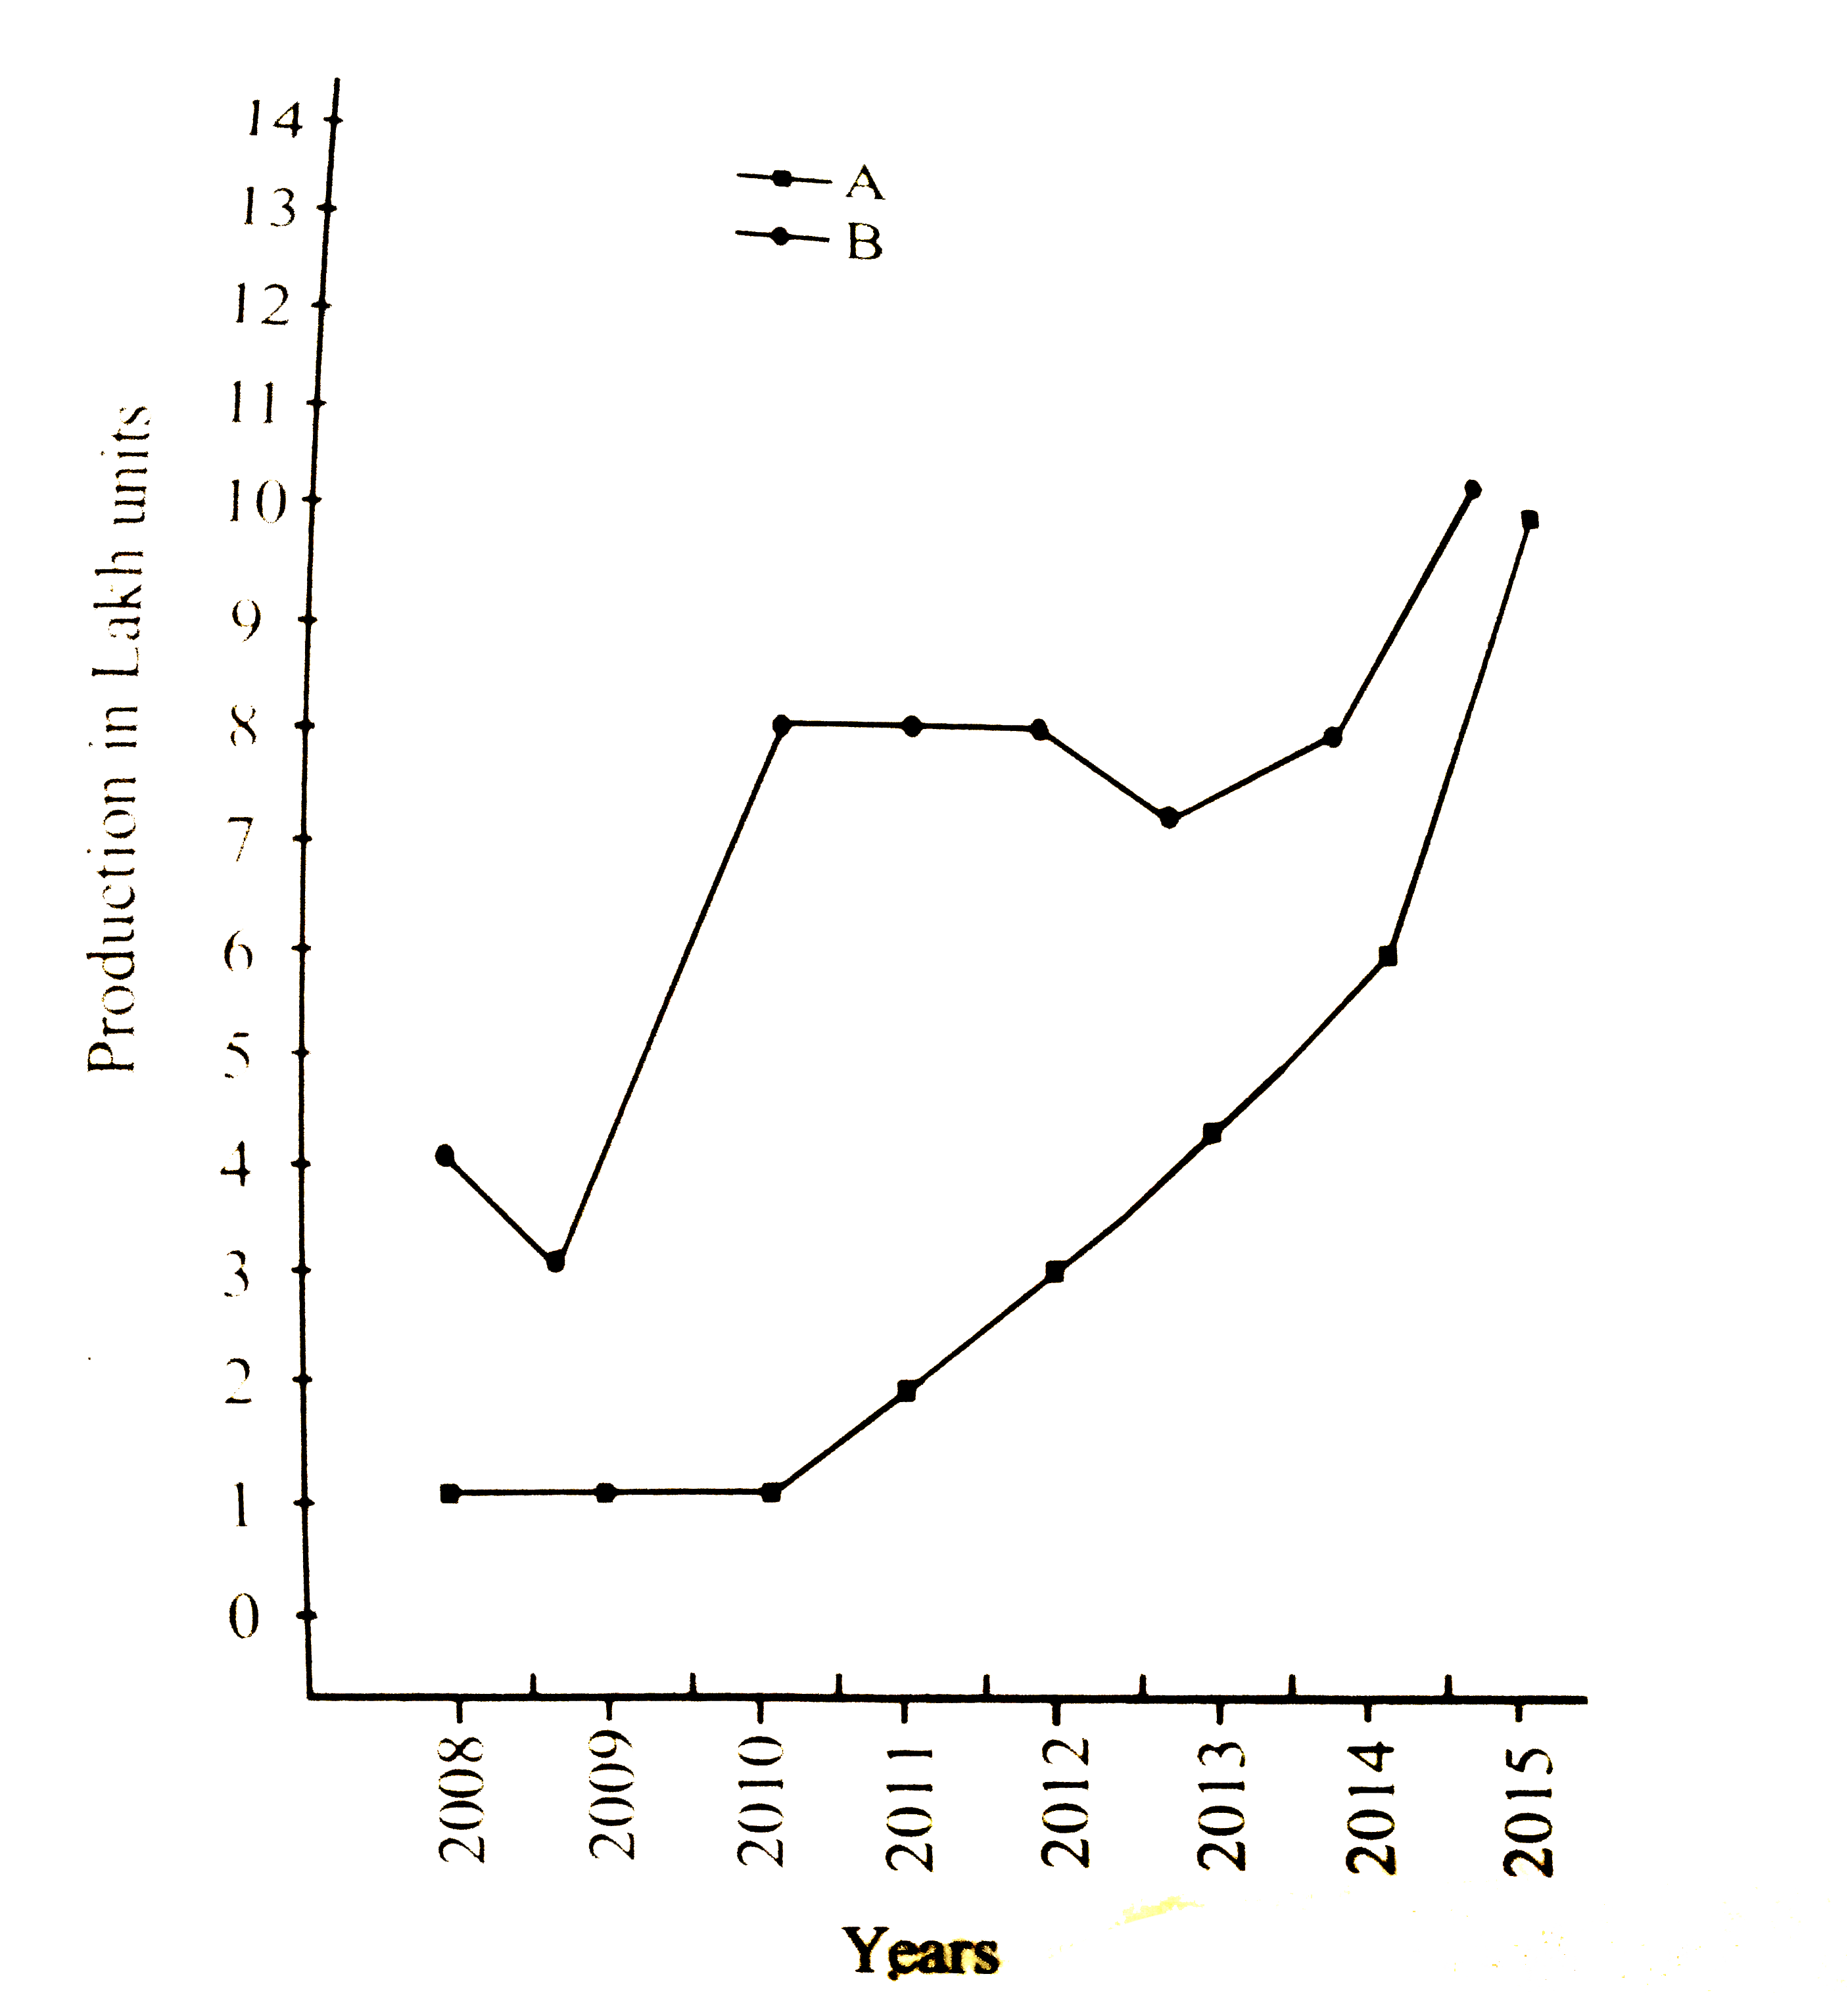
Which of the following is the closest average production in lakh units of Company B for the given years ?
View SolutionThe bar graph given below shows the production (in000 tonnes) of rice of a country for the year 2007 to 2011 .
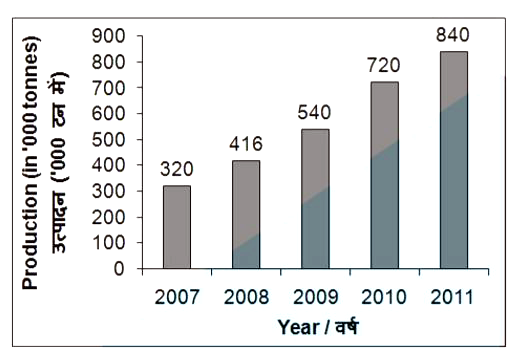
What is the average production of rice per year from 2009 to 2011 ?
View Solution
Knowledge Check
In India there were only three bicycle making companies in the given period. The following table shows the production of units (in 000)
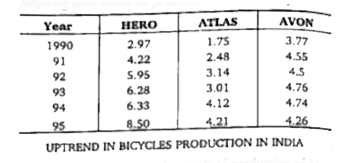
Atlas cycles on an average account for what percentage of the total bicycles production :A0.15B23.4%C34.5%D0.29In India there were only three bicycle making companies in the given period. The following table shows the production of units (in 000)
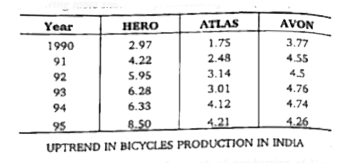
Which of the following statements is/are correct ?
(i) Atlas cycles hae recorded the fastest growth rate.
(ii) Total bicycles production was the highest in 1993
(iii) Hero cycles on an average account for 48% of total bicycles productionAI onlyBII onlyCIII onlyDnone of theseIn a factory, the production of cycles rose to 48,400 from 40,000 in 2 years. The rate of growth per annum is
A0.09B0.08C0.105D0.1
Study the given bar chat and answer the question that follows.
production of Fertilizers by a Company (in 10,000 tonnes) Over the Years
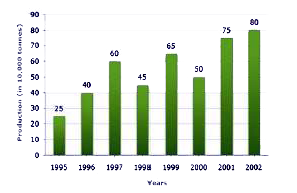
What was the approximate percentage increase in the production of fertilizers from 1998 to 1999 ?
View SolutionThe bar graph provided below gives the data of the production of paper (in lakh tonnes) by three different companies X, Y and Z over the years. Study the bar chart and answer the following questions.
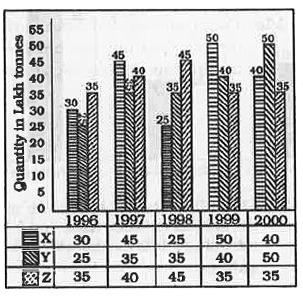
The ratio of the average production of company X in the production of company X in the period 1998-2000 to the average production of company Y in the same period is :
View SolutionThe table given below shows production of five types of cars by a company from the year 1998 to 2003. Study the table and answer the equation.
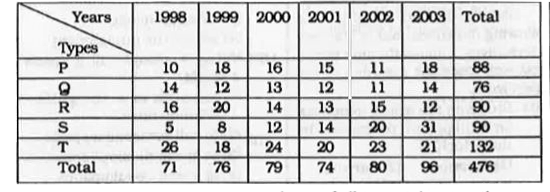
In which year the production of cars of all types taken together was approximately equal to the average of the total production during the period :
View SolutionThe time table below shows production of five types of cars by a company from the year 1998 to 2003. Study the table and answer the question.
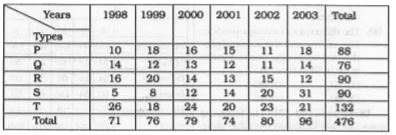
In which year the production of cars of all types taken together was approximately equal to the average of the total production during the period:
View SolutionThe bar diagram given below shows the productions (in the unit of thousand pieces) of three types of biscuits by a company in the five consecutive years. Study the diagram and answer the following questions.
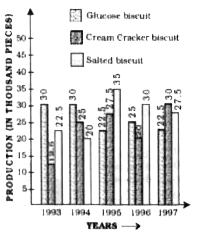
The ratio of production of glucose biscuits and total production of biscuits in that year was maximum in
View Solution
