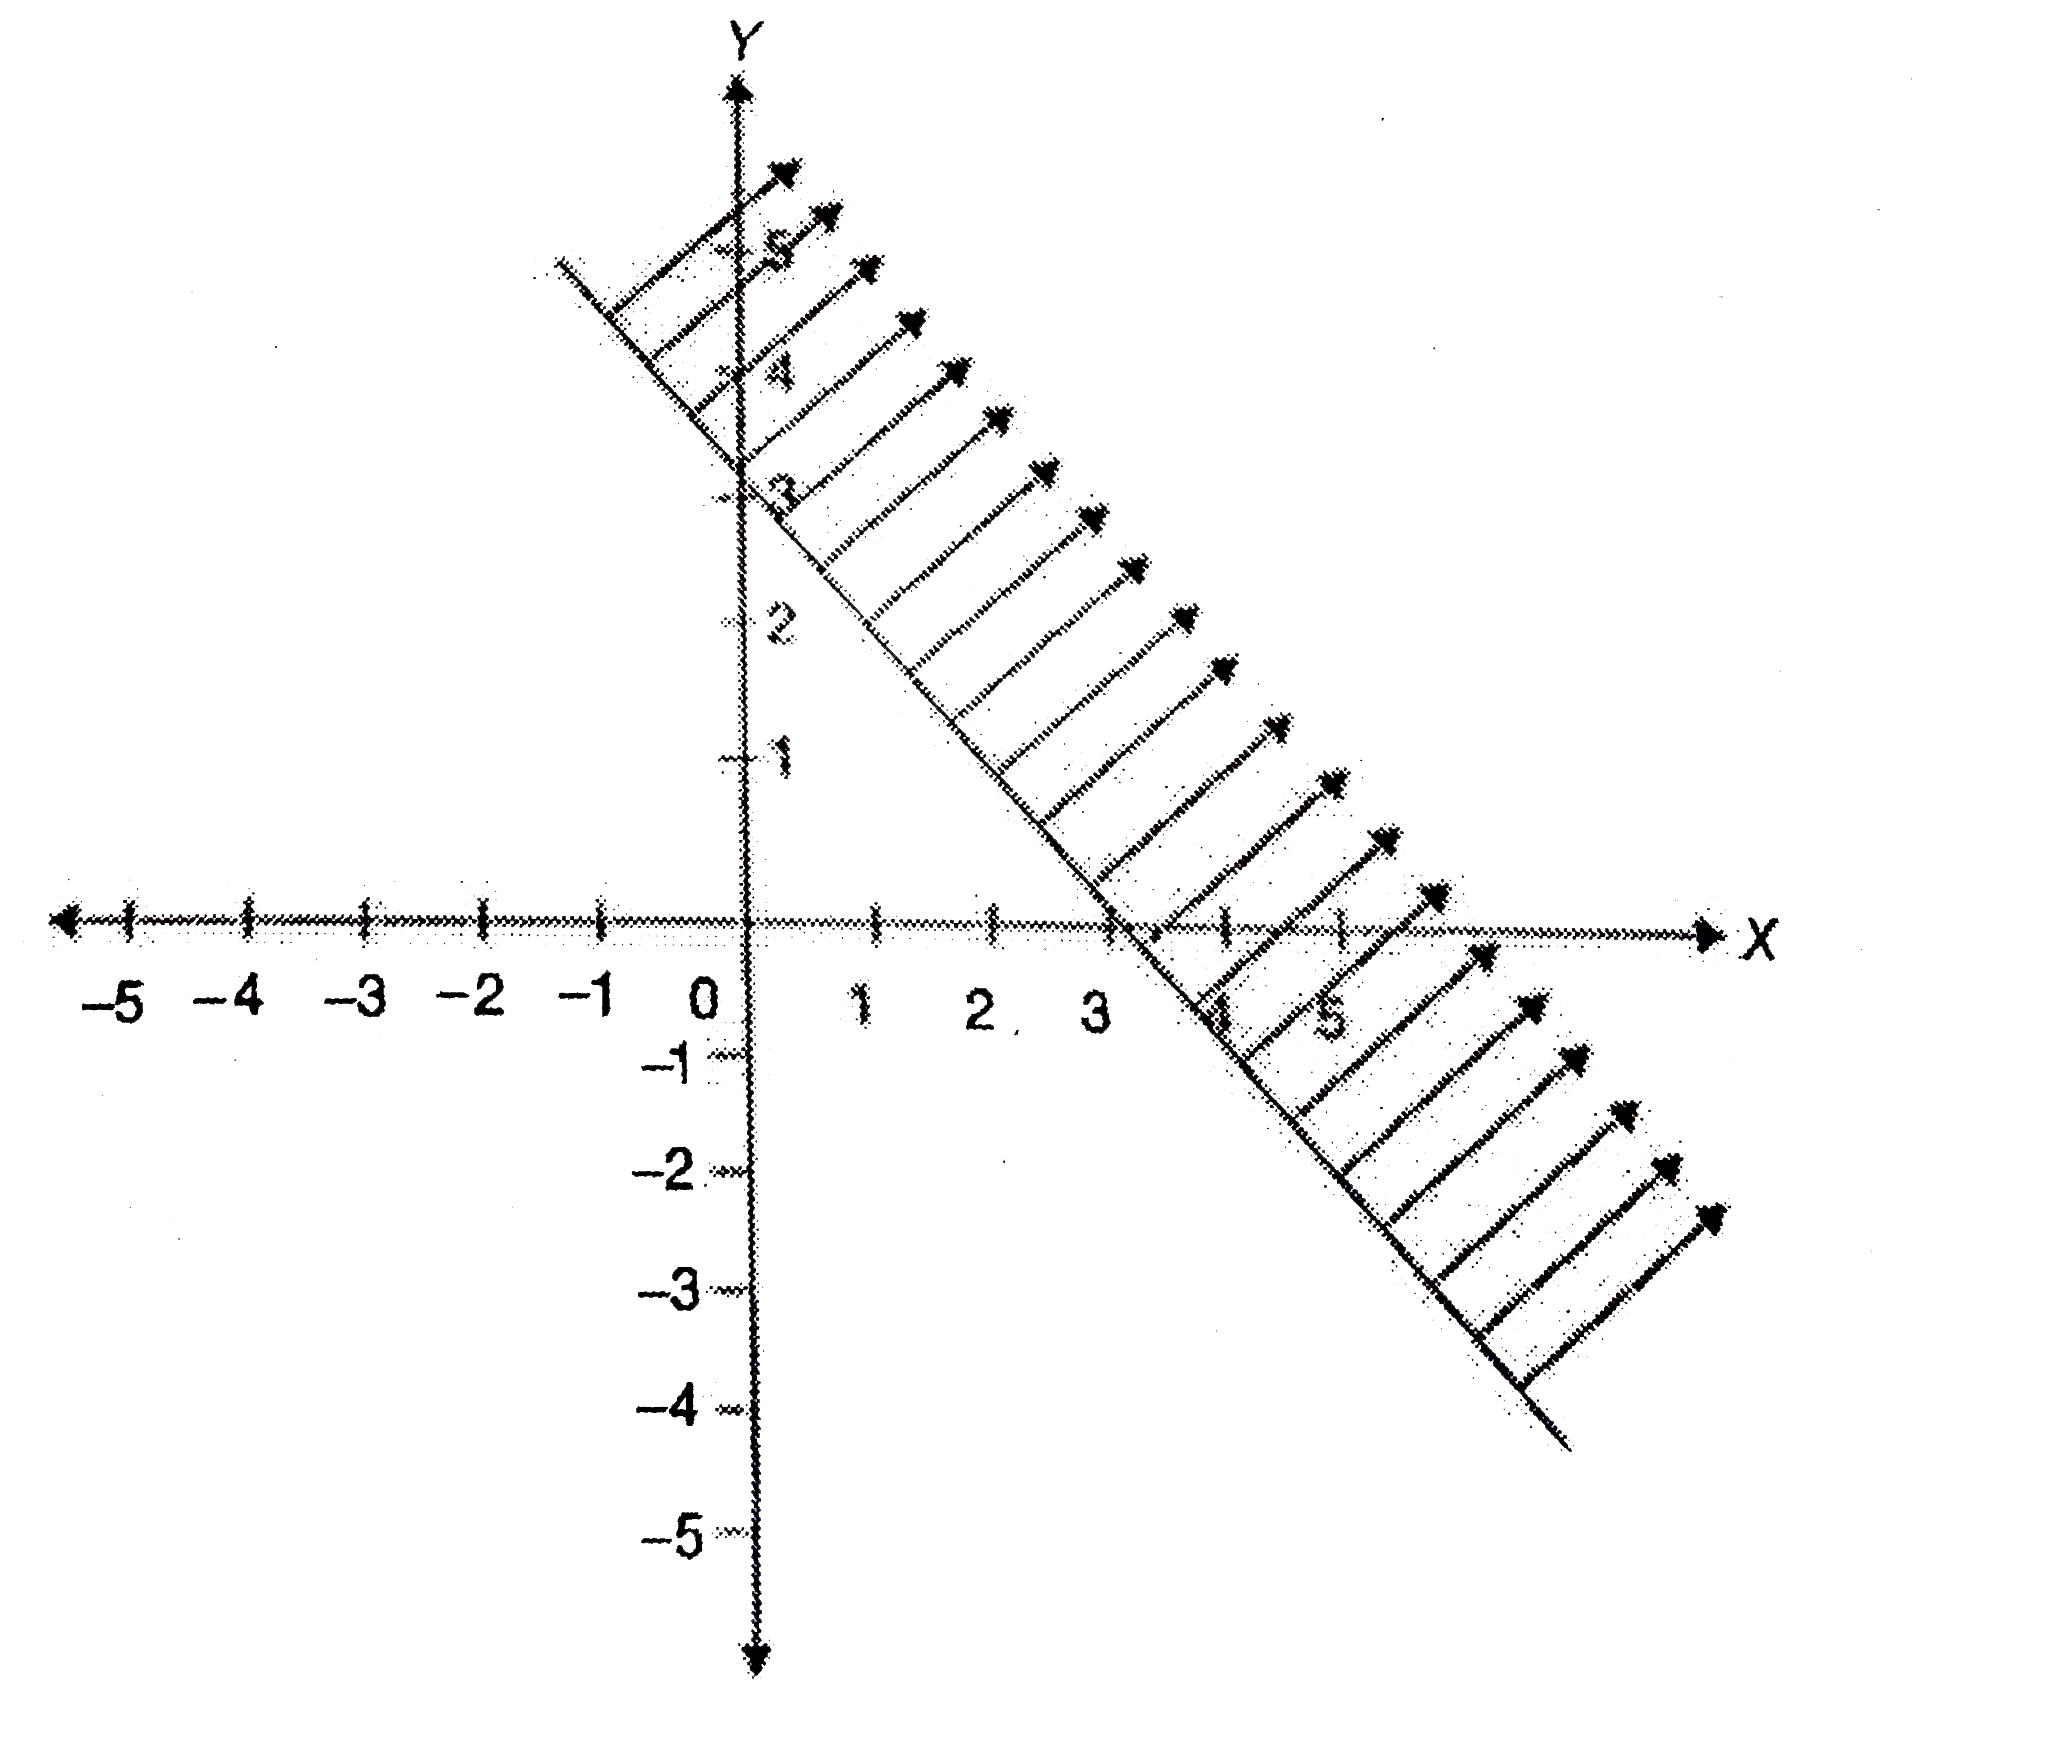
The inequation represent by the following graph is
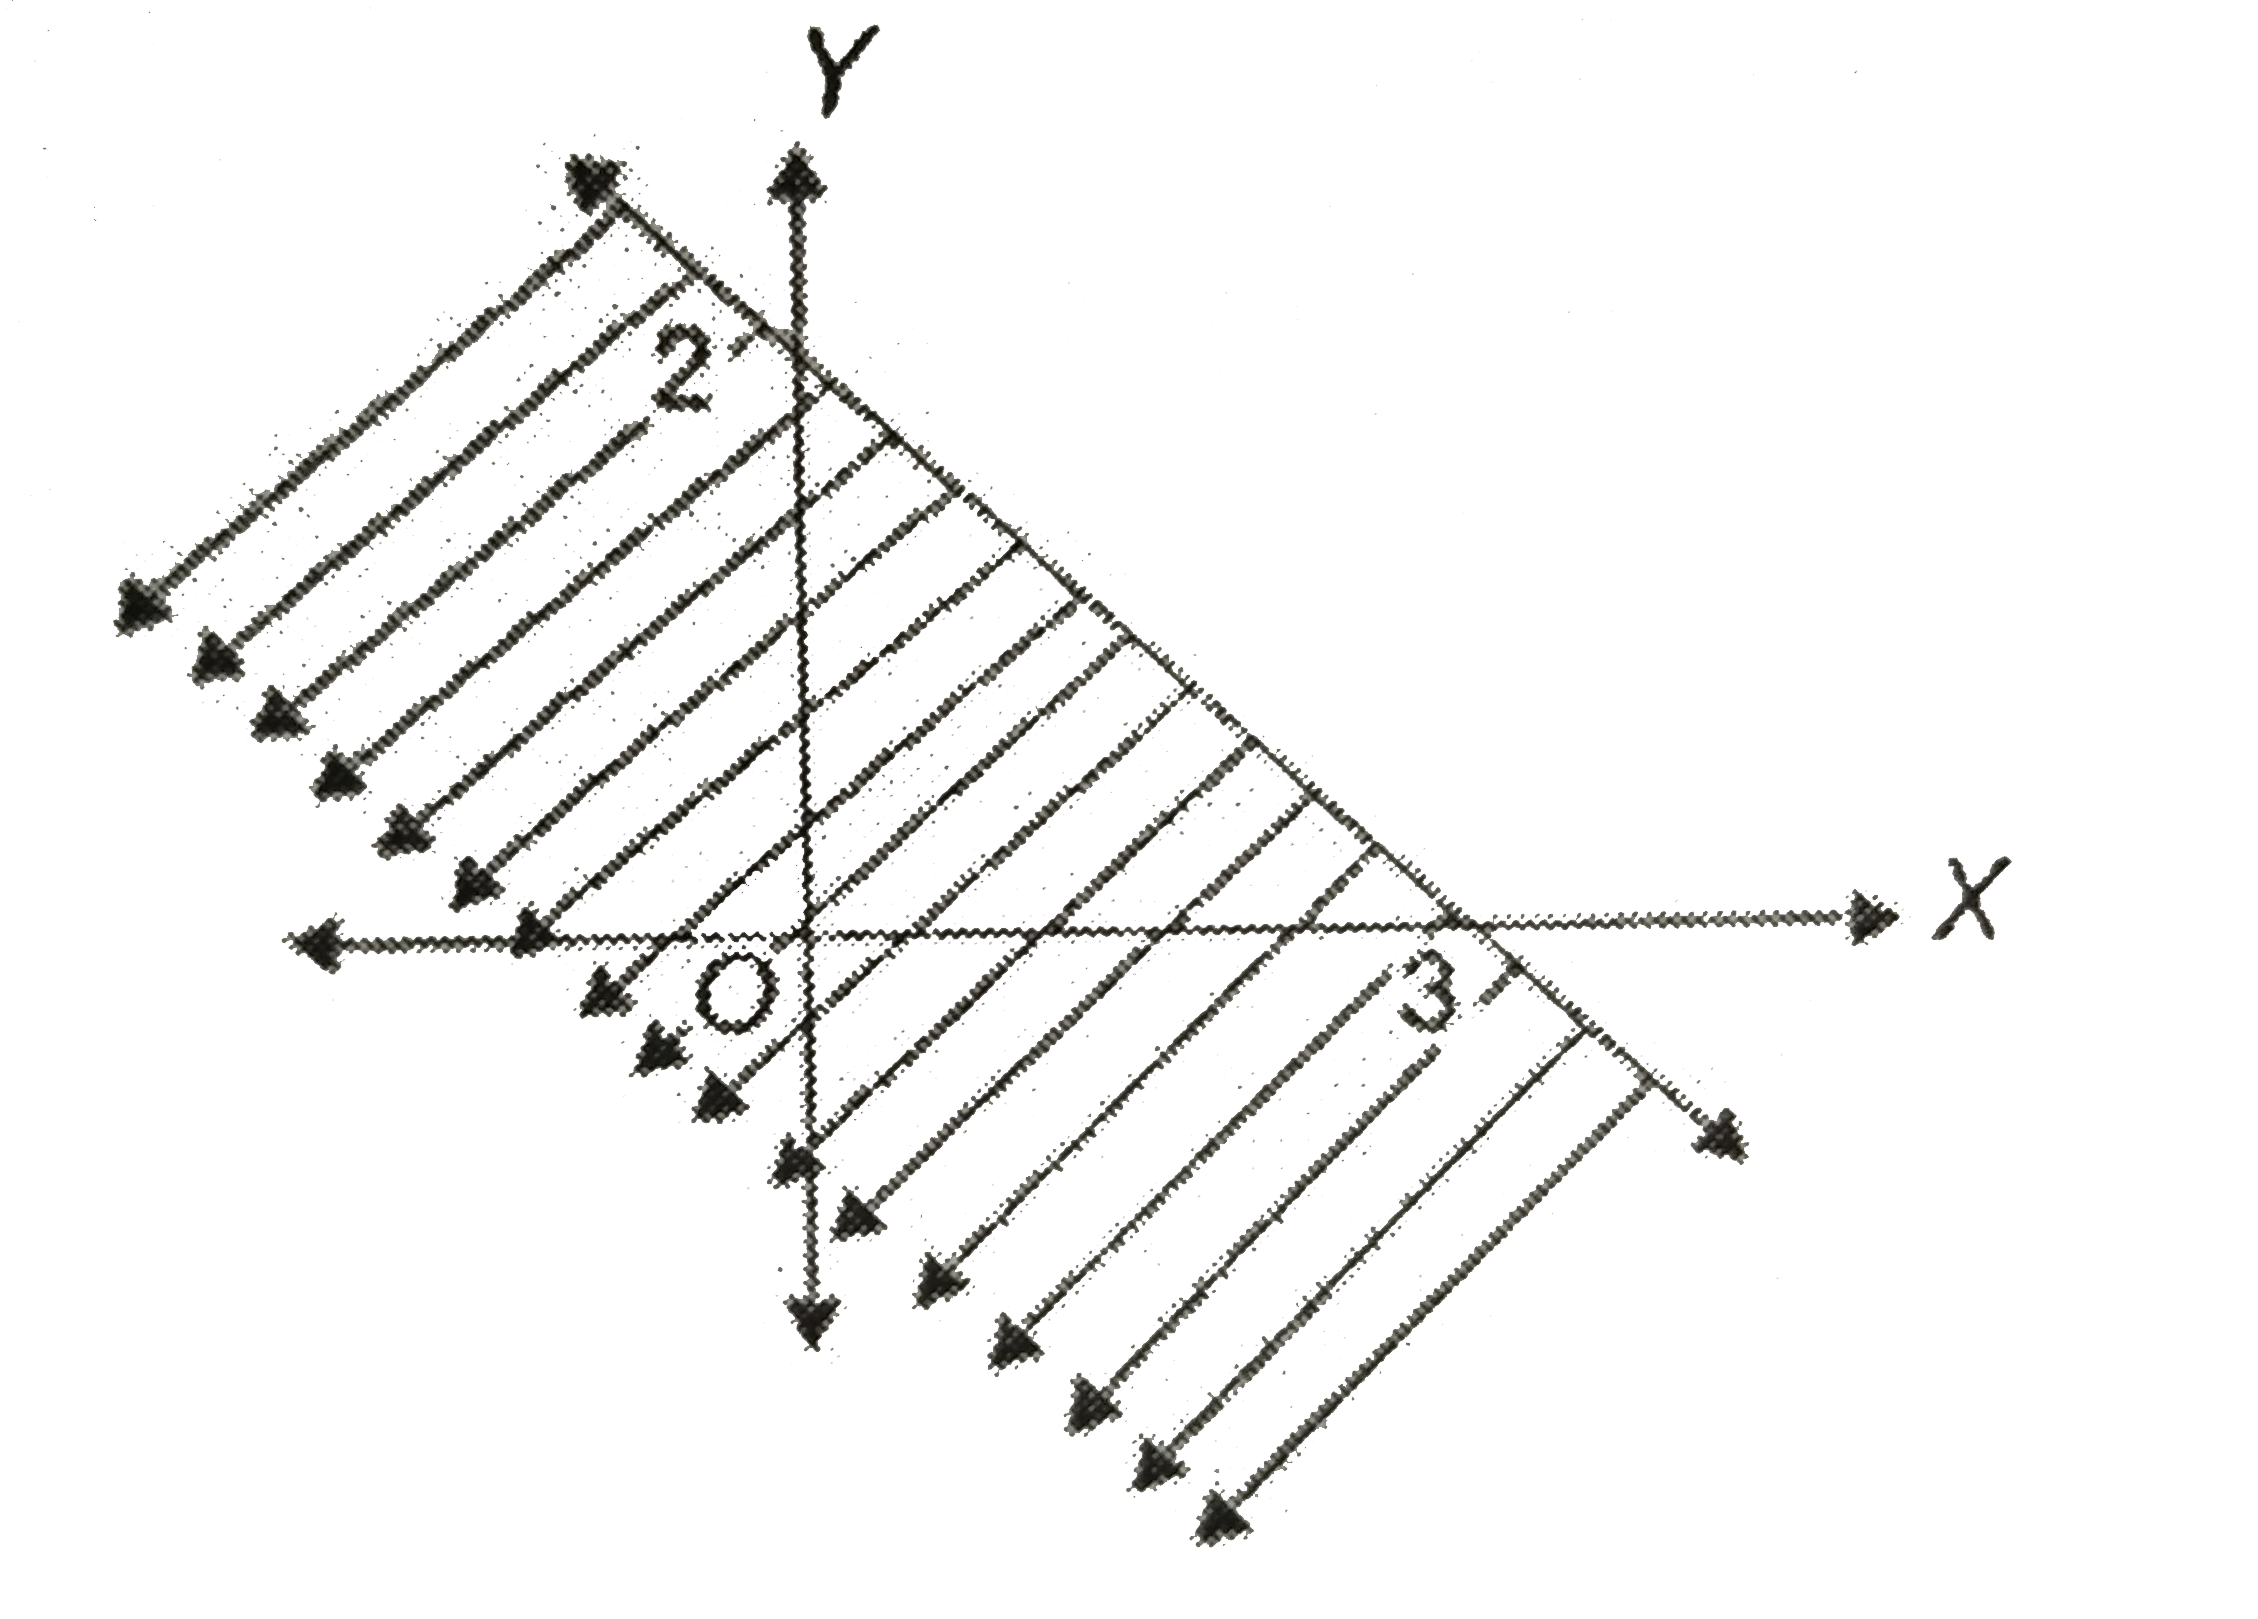
A
2x+3y+6≤0
B
2x+3y−6≥0
C
2x+3≤6
D
2x+3y+6≥0
Video Solution
Text Solution
The correct Answer is:C
The corresponding equation of the line is x3+y1=1
|
Topper's Solved these Questions
- LINEAR PROGRAMMINGBOOK - PEARSON IIT JEE FOUNDATIONCHAPTER - LINEAR PROGRAMMINGEXERCISE - Level 2
15 Videos
- LINEAR PROGRAMMINGBOOK - PEARSON IIT JEE FOUNDATIONCHAPTER - LINEAR PROGRAMMINGEXERCISE - Level 3
10 Videos
- LINEAR PROGRAMMINGBOOK - PEARSON IIT JEE FOUNDATIONCHAPTER - LINEAR PROGRAMMINGEXERCISE - Easy type Question
5 Videos
- LIMITSBOOK - PEARSON IIT JEE FOUNDATIONCHAPTER - LIMITSEXERCISE - LEVEL-3
15 Videos
- LOGARITHMSBOOK - PEARSON IIT JEE FOUNDATIONCHAPTER - LOGARITHMSEXERCISE - Level 3
15 Videos
Similar Questions
Knowledge Check
The function represented by the following graph is
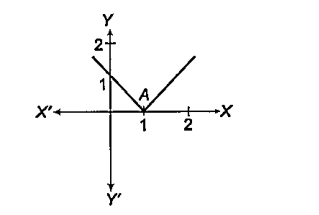 Acontinuous but not differentiable at x=1Bdifferentiable but not continuous at x=1Ccontinuous and differentiable at x=1Dneither continuous nor differentiable at x=1
The inequality representing the following graph is
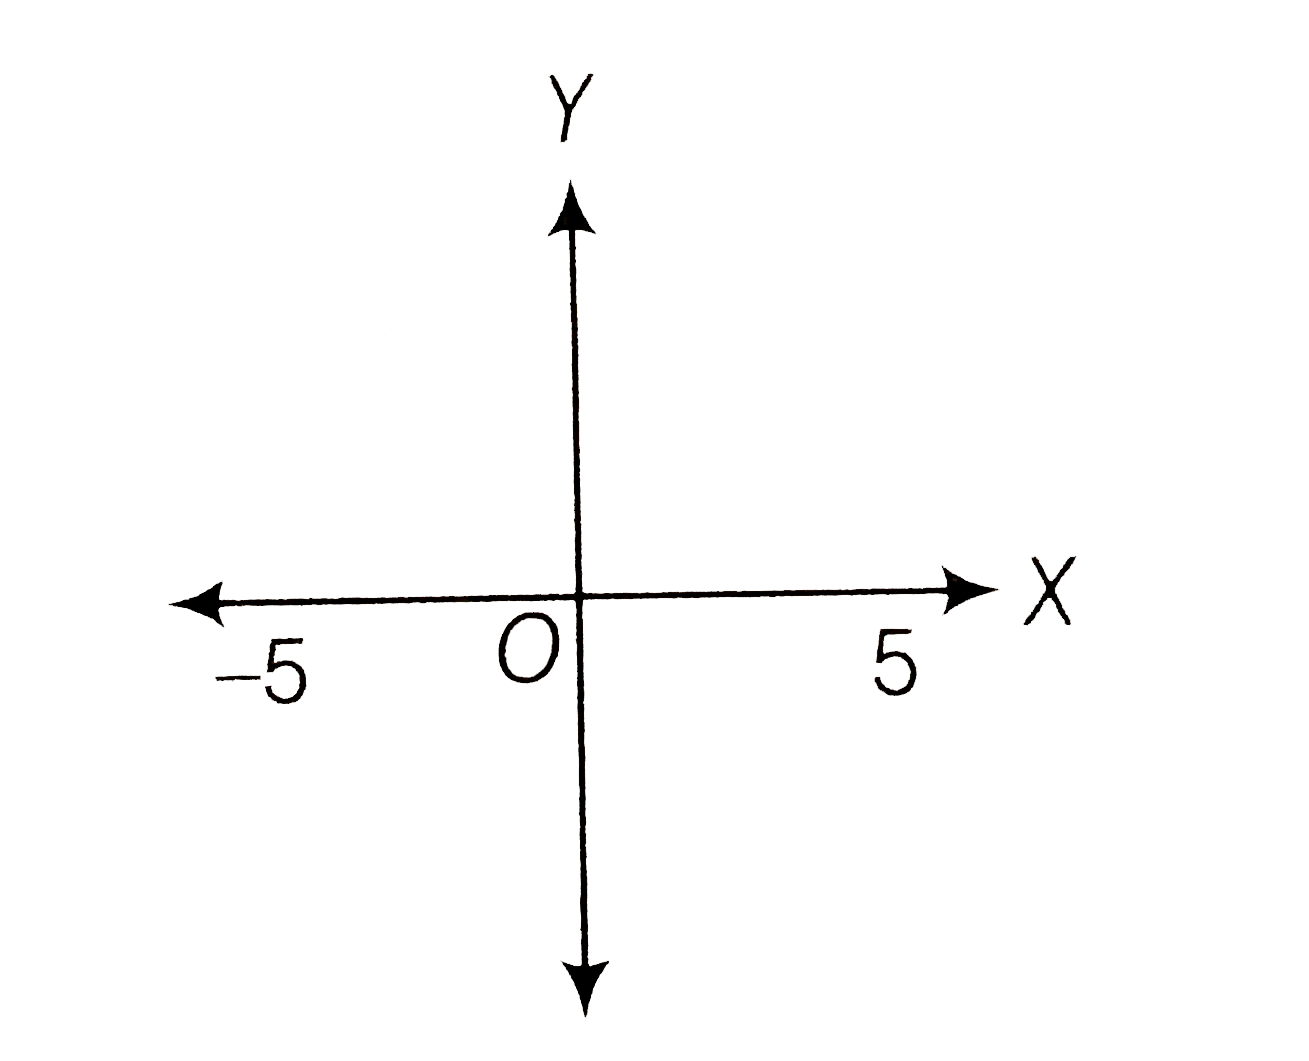 A|x|<5B|x|≤5C|x|>5D|x|≥5
The inequality representing the following graph is
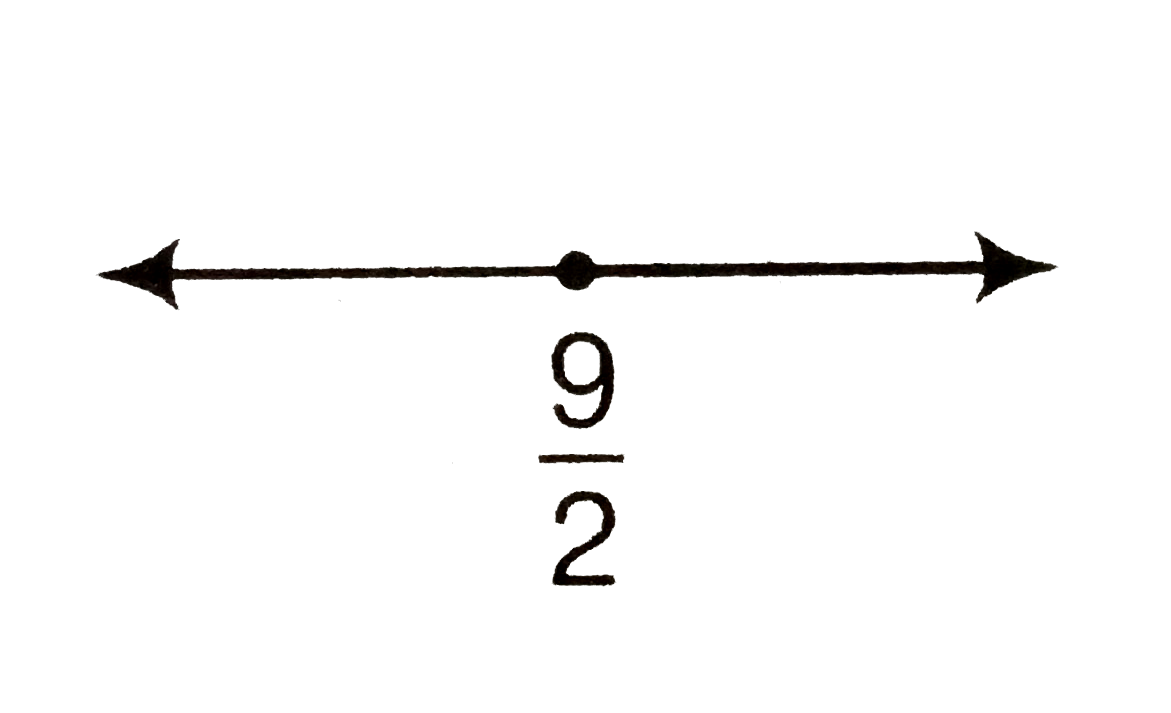 Ax∈(92,∞)Bx∈[92,∞)Cx∈−[∞,92)Dx∈(−∞,92]
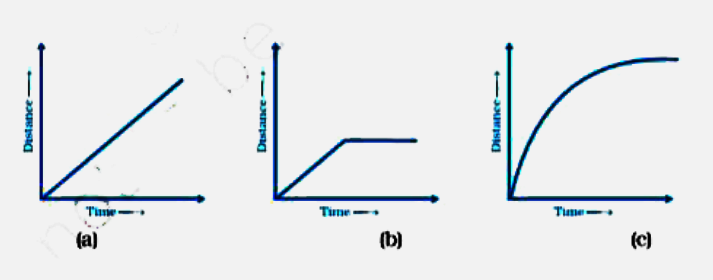
Explain the situations represented by the following distance-time graphs :

View SolutionExplain the situations represented by the following distance-time graphs.
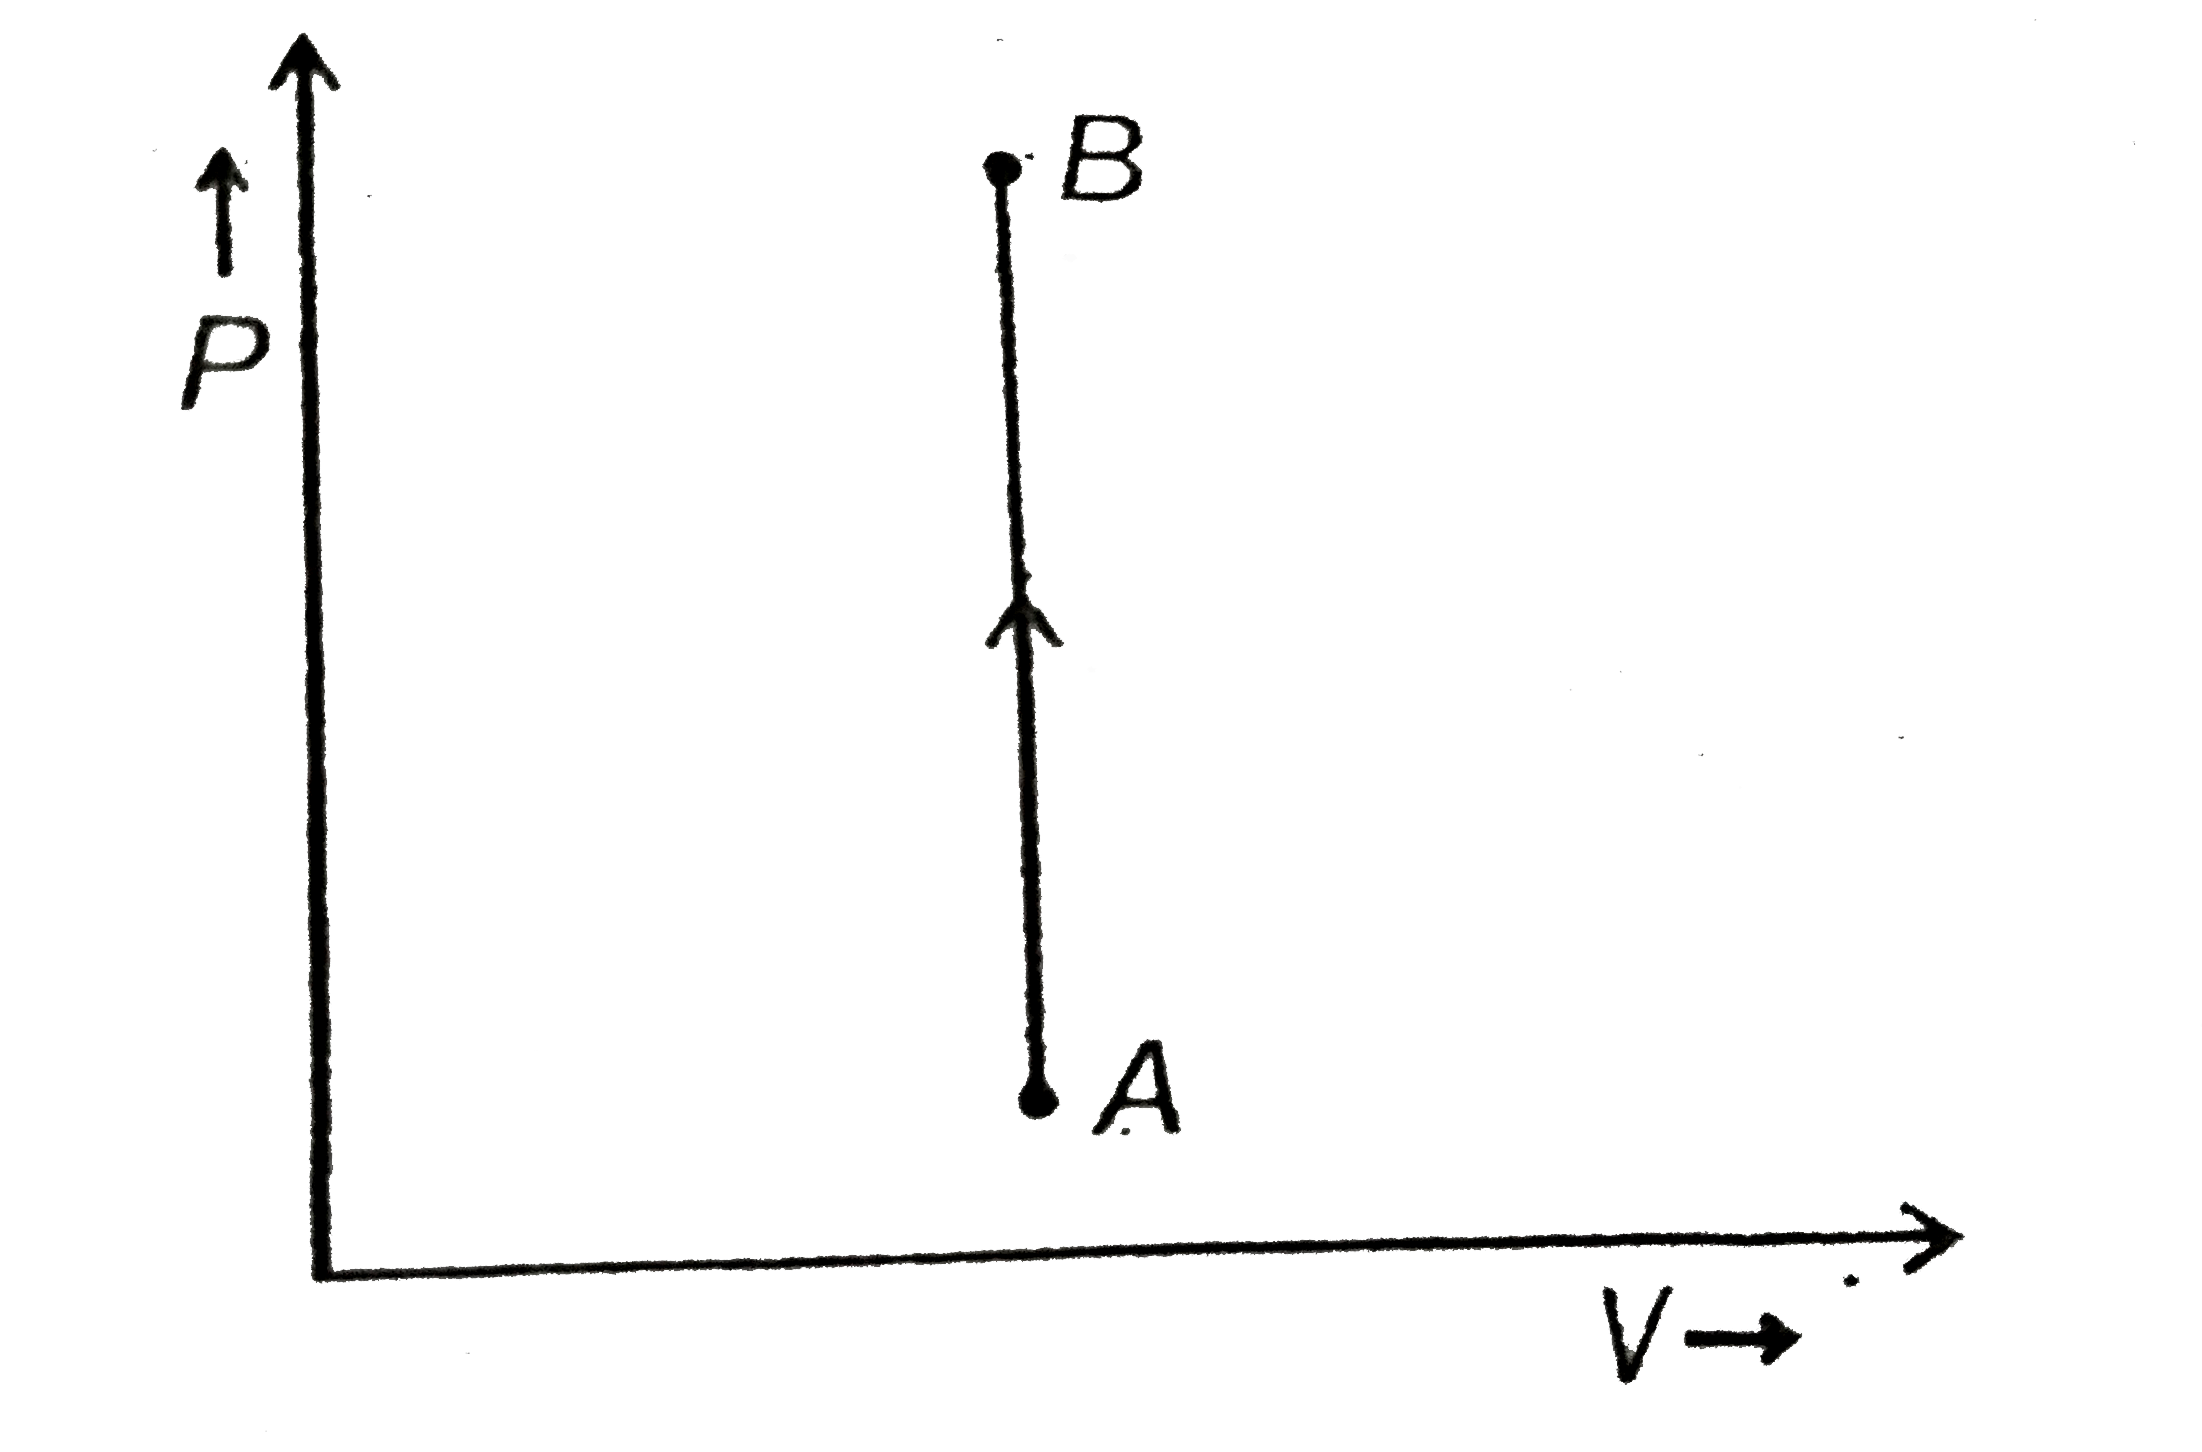
View SolutionThe following graph represents
View SolutionRepresent the following inequations graphically
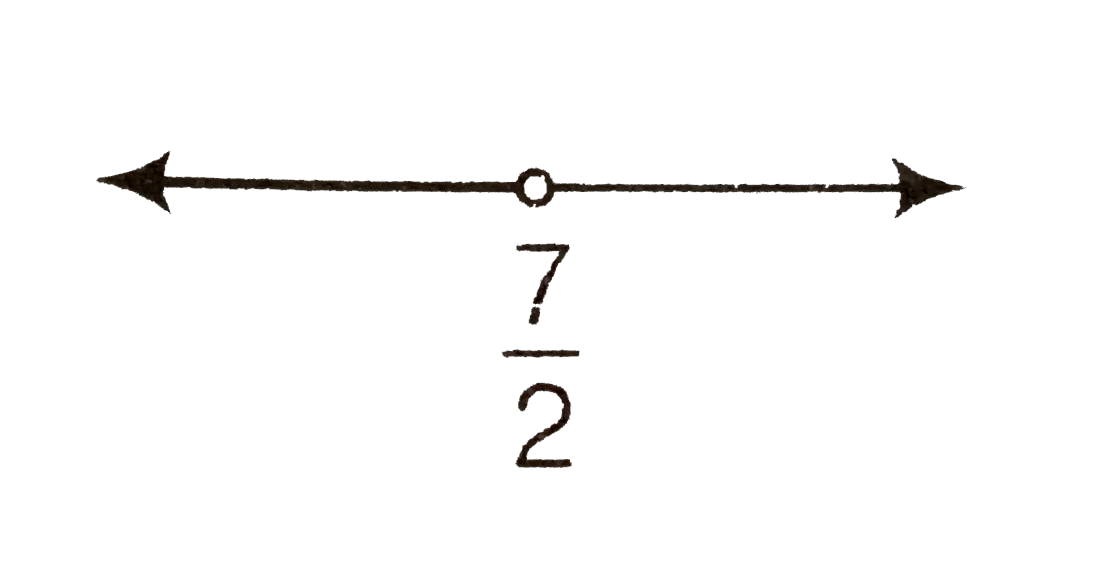
View SolutionThe inequality representing the following graph is
View Solution

