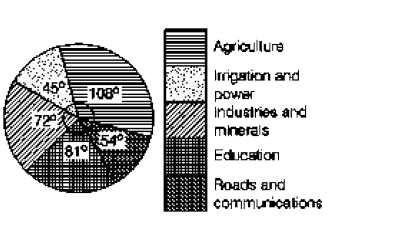
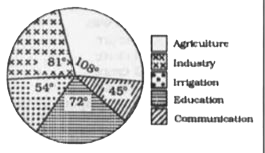
The adjoining pie chart represents the proposed outlay of the fifth year plan of 40000 crore .The amount proposed on agriculture is more than that on industries and minerals by
0.075
0.1
0.12
0.125
The correct Answer is:A
Step by step video, text & image solution for The adjoining pie chart represents the proposed outlay of the fifth year plan of 40000 crore .The amount proposed on agriculture is more than that on industries and minerals by by Maths experts to help you in doubts & scoring excellent marks in Class 14 exams.
Topper's Solved these Questions
- BOOK - ARIHANT SSCCHAPTER - PIE CHART EXERCISE - Exercise Higher Skill Level Questions15videos
PIE CHART
- BOOK - ARIHANT SSCCHAPTER - PIE CHART EXERCISE - Exercise Higher Skill Level Questions15videos
PIE CHART
- BOOK - ARIHANT SSCCHAPTER - PERMUTATIONS AND COMBINATIONSEXERCISE - HIGHER SKILL LEVEL QUESTIONS19videos
PERMUTATIONS AND COMBINATIONS
- BOOK - ARIHANT SSCCHAPTER - PIPES AND CISTERNS EXERCISE - EXERCISE HIGHER SKILL LEVEL QUESTION17videos
PIPES AND CISTERNS
Similar Questions
Directions : The pie chart shows the proposed outlay for different sectors during a Five-Year plan of Government of India. Total outlay is Rs. 40,000 crores. By reading the pie-chart answer the following three questions.
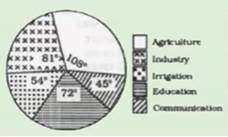
find the proposed outlay of outlay of Irrigation and Communication ?View SolutionDraw a pie-diagram to represent the following data on the proposed outlay during the fourth five-year plan. Items, Agriculture, Ind. and Minerals, Irrigation & Power, Communication, Miscellaneous Rupees (in crores), 6000, 4000, 2500, 4500, 3000
View Solution
Knowledge Check
- Question 1 - Select One
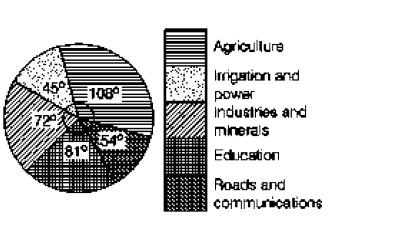
The adjoining pie chart represents the proposed outlay of the fifth year plan of 40000 crore . The amount (in X crore) proposed on irrigation and power is less than that on industries and minerals by
 A3000B3500C2000D2500
 - Question 2 - Select One
Study the following line chart carefully and answer the questions given below it. The following line chart represents the number of employees recrulted in different years in a company.
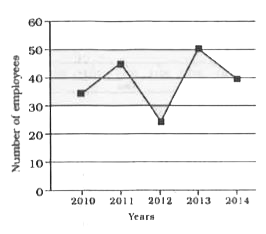
The number of employees recruited in 2015 was 40% more than that recruited in 2014. How many employees were recruited in 2015?A56B16C64D60 - Question 3 - Select One
The pie-chart shows the proposed outlay fdor different sectors during a Five-Year plan of Government of India. Total outlay is Rs. 40,000 crores. By reading the pie-chart answer the following three questions.
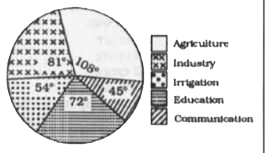
If the proposed outlay of Irrigation is x% of the proposed outlay of Agriculture, then x is equal toA50%B15%C25%D75%
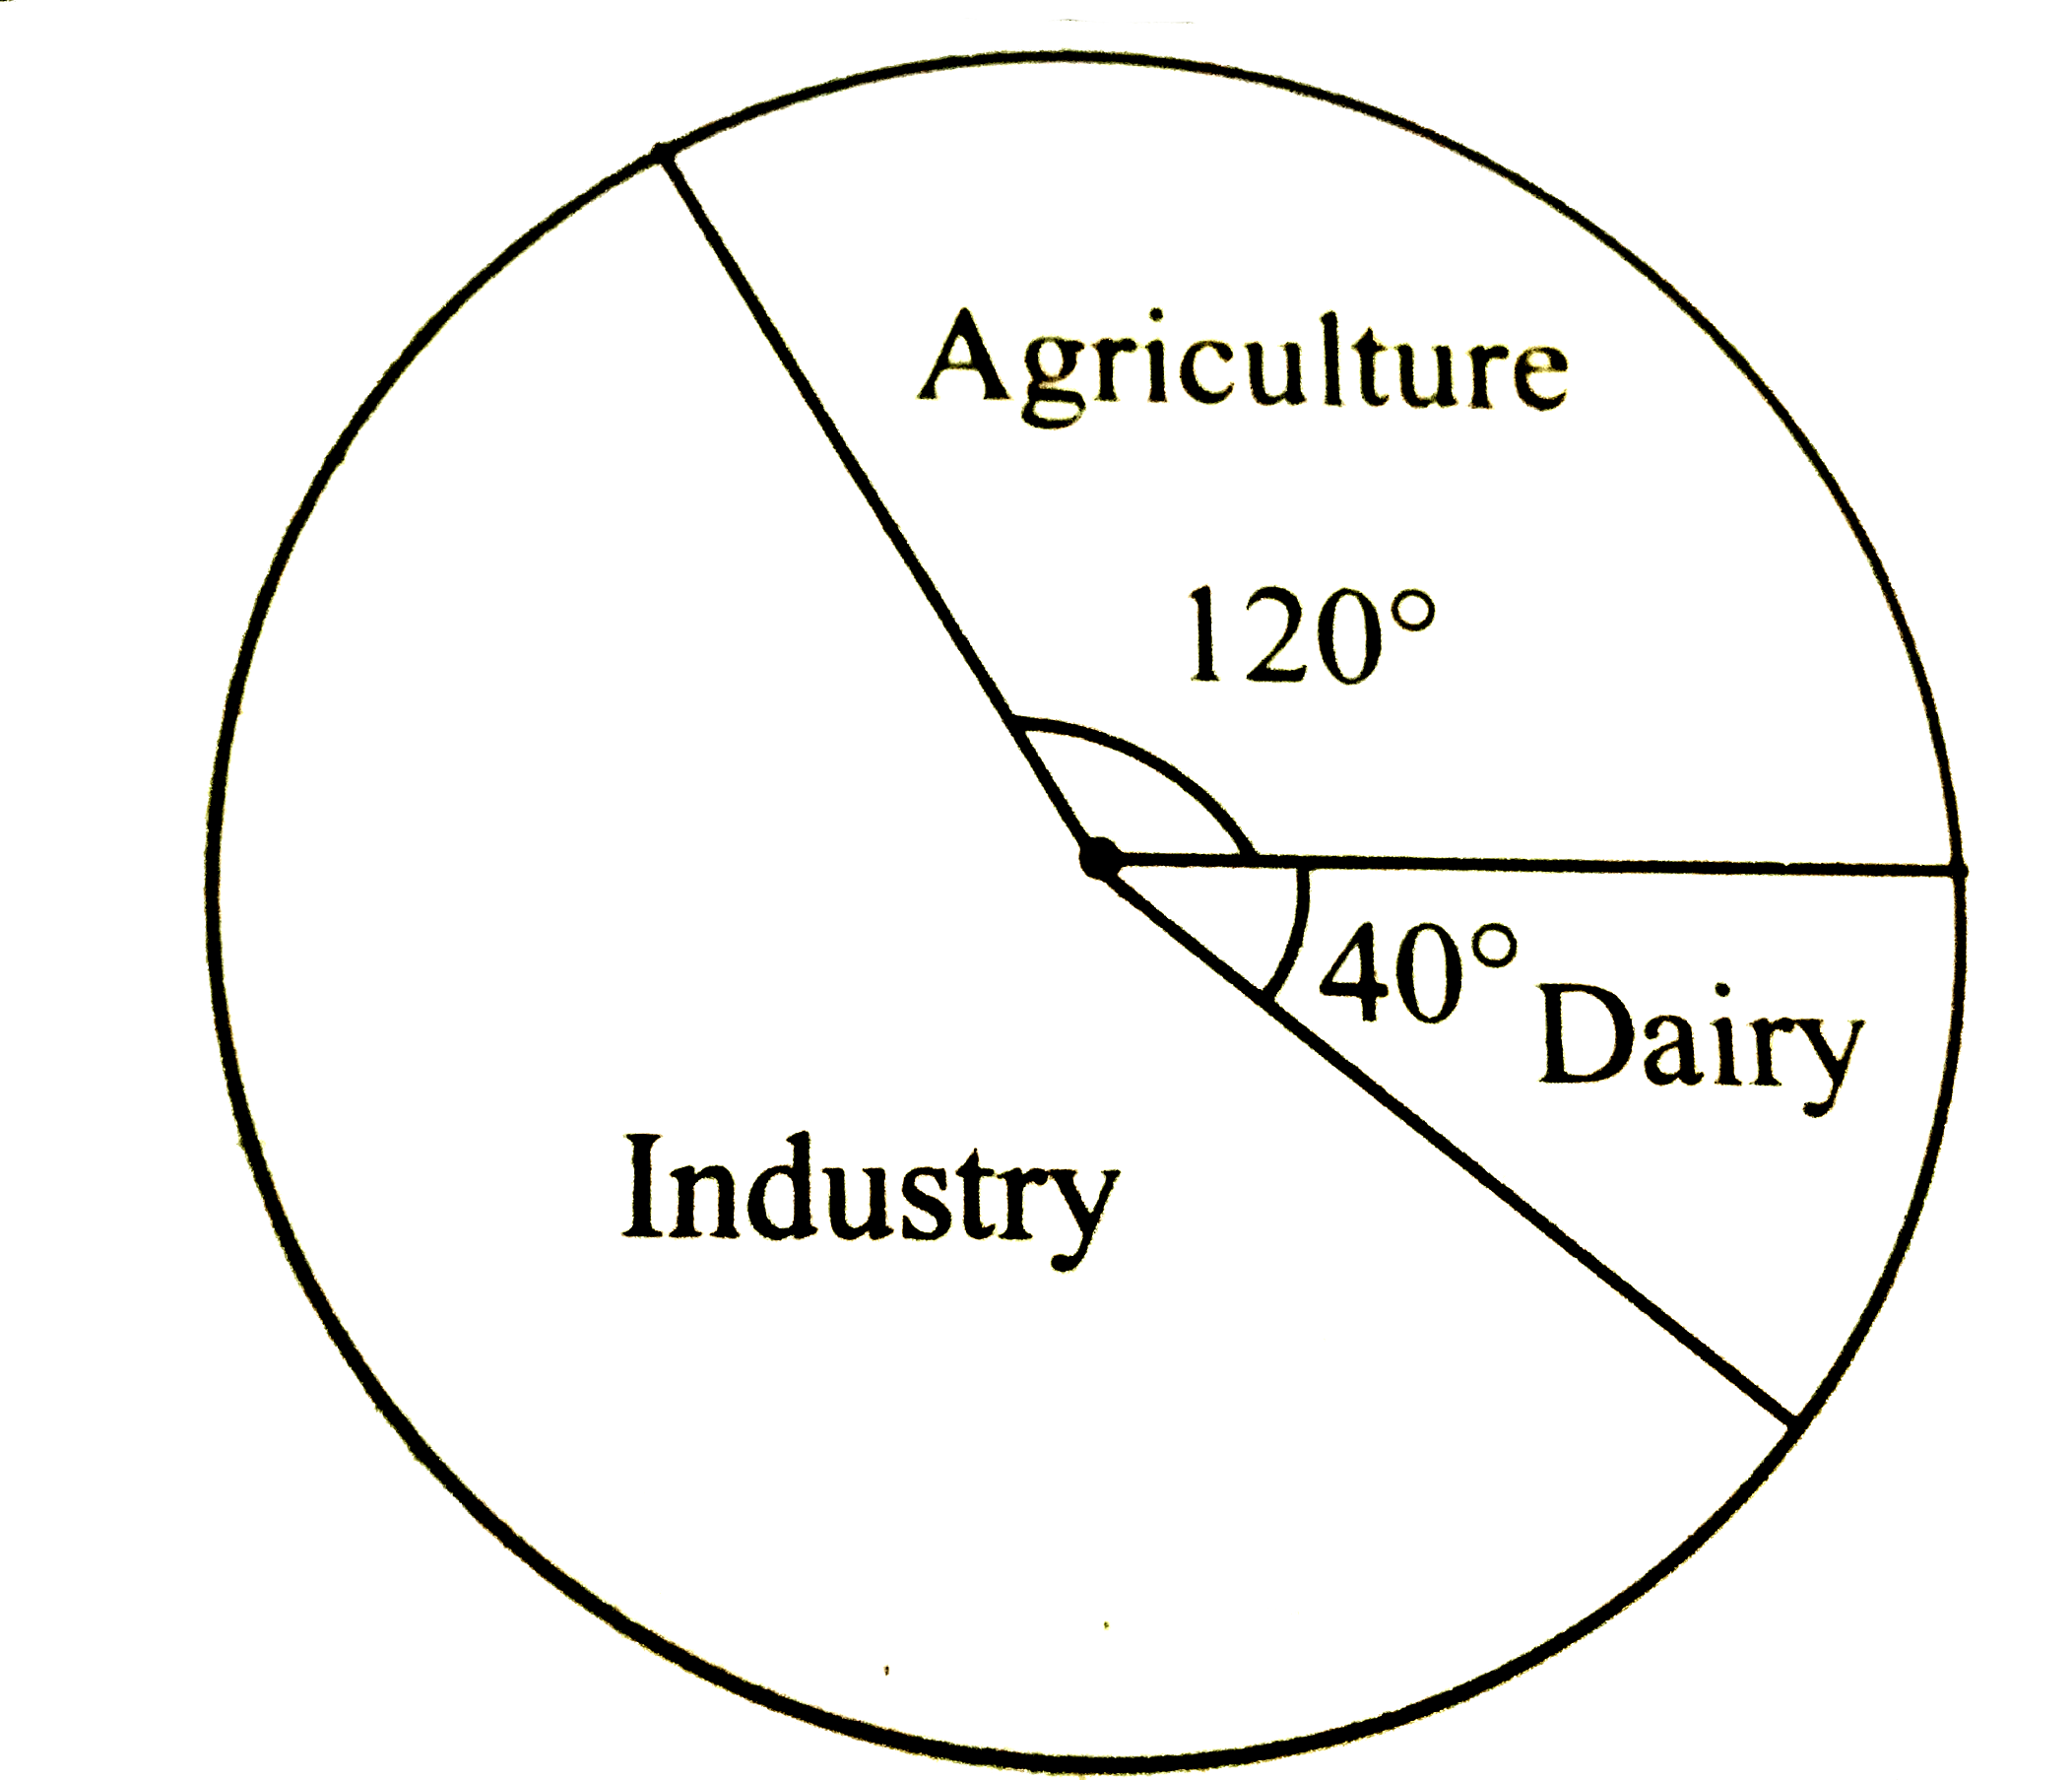
The following pie diagram represents the sectorwise loan amount in crores of rupees distributied by a bank. From the information answer the following questions:
i. If the dairy sector receives Rs20 crores, then find the total loan disbursed.
ii. Find the loan amount for agriculture sector and also for idustrial sector.
iii How much additional amount did industrial sector receive than agriculture sector?
 View Solution
Read the following passage and examine each inference given below it in the context of this passage . Mark your answer as
(a) If the interference is definitely true
(b) If the inference is probably true.
(c] IF the data provided is inadequate .
(d) If the inference is probably false
If the inference is definitely false
The performance of Indian agriculture is largely dependent on amount of rainfall across the country . A substantive part of the cultivable land is dependent on irrigation which is directly related to monsoon. However agriculture and allied activities account for less that even one -forth of the total GDP. The component of the manufacturing sector that depends depends on agriculture for the supply of intermediates is not very high, Which suggests that the structure of industrialization has changed over the years. Several components of the tertiary sector that are crucial for the growth the rest of the company have grown sizeably , thanks to IT and BPO. So it is less likely that aggregate economic growth will be adversely affected in rainfall is scanty. Yet a somewhat different picture emerges if we look deeper into the matter.Still a very significant chunk of the population and work force depends on agriculture for its livelihood. A decline in agriculture reduces per capita food availability which in turn pulls down the standard of living.
Agro -based acivities constitute more than 25 percent of GDP in India.View SolutionThe pie-chart given here shows the country's expenditure on various sports during a particular year. Study the pie-chart and answer the question given below.
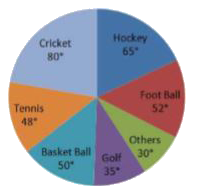
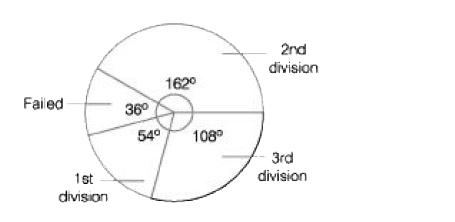
If the total amount spent on sports in the year was ₹1,80,00,000, then the amount spent on tennis is more than the expenditure on golf by:View SolutionThe following pie chart shows the performance in an examination in a particular year for 360 students. The number of students who passed in 2nd division is more than those in 1st division by
 View Solution
The pie-chart shows the proposed outlay fdor different sectors during a Five-Year plan of Government of India. Total outlay is Rs. 40,000 crores. By reading the pie-chart answer the following three questions.
What is the proposed outlay for Education?View Solution
