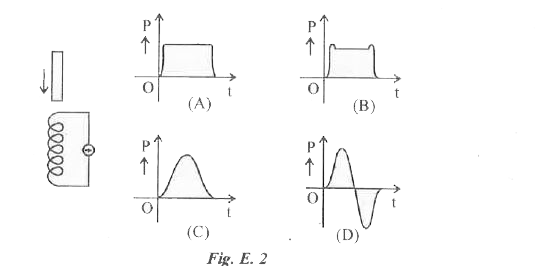
A short bar magnet is dropped through a coil of wire of similar length. Which one of the graphs below shows best how the current through the coil varies with time?
 Solution in Tamil
D. Because graph D shows best how the current flows through the coil varies with time. It depends on the nature of cause that produces it.
Topper's Solved these Questions
- ELECTROMAGNETIC INDUCTION BOOK - NEW JOYTHI PUBLICATIONCHAPTER - ELECTROMAGNETIC INDUCTION EXERCISE - CONTINUOUS EVALUATION (ASSIGNMENTS)
2 Videos
- ELECTROMAGNETIC INDUCTION BOOK - NEW JOYTHI PUBLICATIONCHAPTER - ELECTROMAGNETIC INDUCTION EXERCISE - PREVIOUS YEAR QUESTIONS
2 Videos
- ELECTROMAGNETIC INDUCTION BOOK - NEW JOYTHI PUBLICATIONCHAPTER - ELECTROMAGNETIC INDUCTION EXERCISE - PRACTICE PROBLEMS FOR SELF ASSESSMENT
3 Videos
- ELECTRIC CHARGES AND FIELDS BOOK - NEW JOYTHI PUBLICATIONCHAPTER - ELECTRIC CHARGES AND FIELDS EXERCISE - Competitive Exam Corner
20 Videos
- ELECTROMAGNETIC WAVES BOOK - NEW JOYTHI PUBLICATIONCHAPTER - ELECTROMAGNETIC WAVES EXERCISE - COMPETITIVE EXAM CORNER
16 Videos
Similar Questions
Discuss briefly the various methods of producing induced e.m.f.
View SolutionA current carrying wire produces a magnetic field in its surrounding space
A. The S.I. unit of magnetic flux density is
a. henry
b. tesla
c. Am2
d. A-m
B. With the help of a diagram, derive an expression for the magnetic field at the point on the axis of a circular current loop.
C. Consider a tightly wound 100 turn coil of radius 10 cm, carrying a current of 1 A. What is the magnitude of the magnetic field at the centre of the coil?
View SolutionA long solenoid with 15 turns per cm has a small loop area 2.0cm2 placed inside the solenoid normal to its axis. If the current carried by the solenoid changed steadiy from 2.0A to 4.0A in 0.1 s, what is the induced emf in the loop while the current is changing?
View SolutionTwo charged spherical conductors of radii R1andR2 are connected by a wire. Then the ratio of surface charge densitites of the spheres σ1/σ2 is
View SolutionIf the total electromagnetic energy falling on a surface is U, then the total momentum delivered (for complete absorption) is
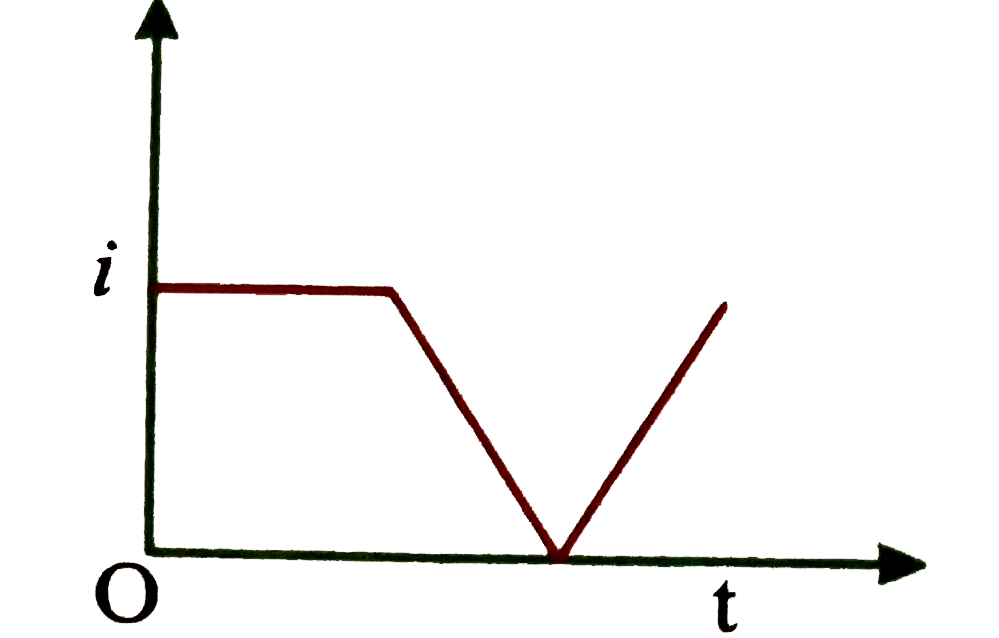
View SolutionThe current i in an induction coil varies with time according to the graph shown in figure. Which of the following graph shows induced emf in the coil with time:
View SolutionThe current through the coil in figure (i) varies as shown in figure (ii). Which graph best shows the ammeter A reading as a function of time?
View SolutionThe current is an induction coil varies with time t, according to the graph shown in figure. Which of the following graphs shows the induced emf (e) in the coil with time.

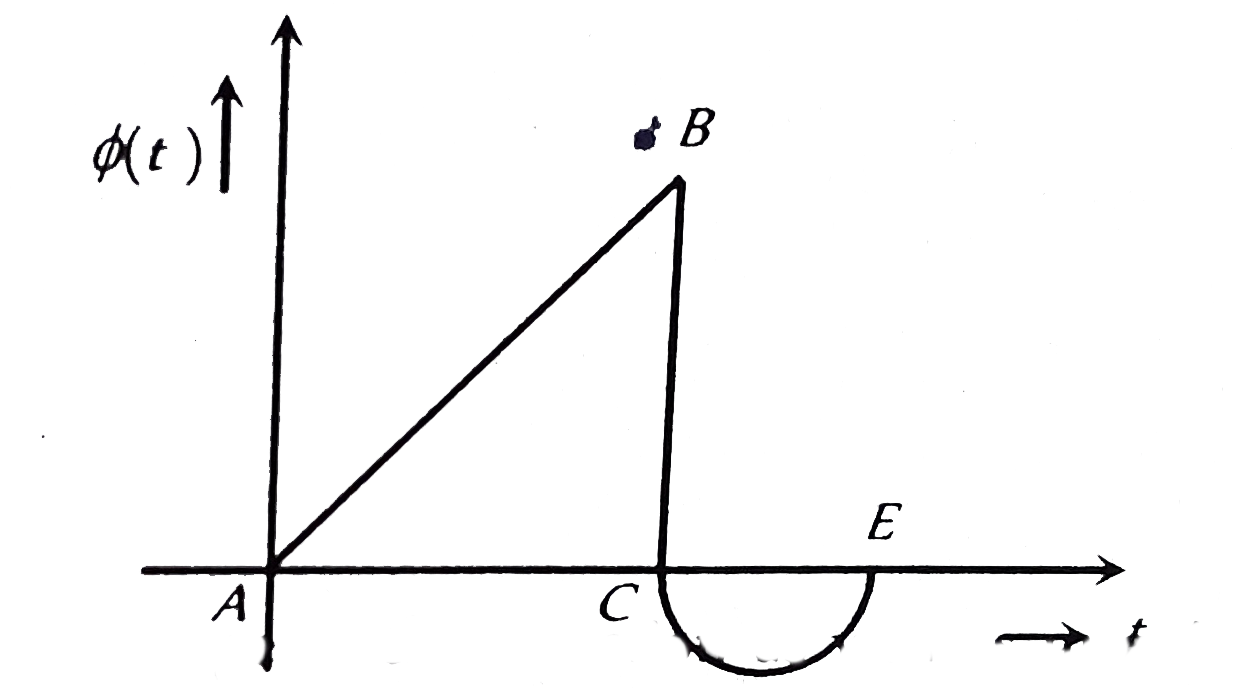
View SolutionThe graph Shows the variation in magnetic flux ϕ(t) with time through a coil. Which of the statements given below is not correct

View SolutionThe graph shows the variation in magnetic flux phi (t) with time through a coil. Which of the statements given below is not correct?
View SolutionThe current i in an induction coil varies with time t according to the graph shown in the figure-5.250. Which of the following graphs shows the induced EMF in the coil with time ?
View SolutionThe graph shows the variation in magnetic flux phi(t) with time through a coil. Which of the statements given below in not correct?
View SolutionA steel bar is magnetized by keeping it inside a long coil of insulated copper wire and passing a current through the coil. Discuss what happen to the pole strength of the magnet as the time for which the electric current passes through the coil increases.
View SolutionCurrent through the coil varies according to graph then induced emf v/s time graph is
View SolutionMagnetic dipole moment of current carrying circular coil is ...... length of wire of coil.
View Solution
