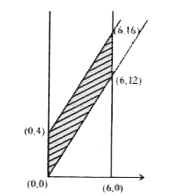
The feasbile regin of the LPP is shown shaded in the figure Let Z=3x−4y be the objective function. Therefore maximum value of z is
 Solution in Tamil
0
8
12
16
The correct Answer is:A
Step by step video, text & image solution for The feasbile regin of the LPP is shown shaded in the figure Let Z=3x-4y be the objective function. Therefore maximum value of z is by Maths experts to help you in doubts & scoring excellent marks in Class 12 exams.
Updated on:21/07/2023Topper's Solved these Questions
- LINEAR PROGRAMMING BOOK - NEW JOYTHI PUBLICATIONCHAPTER - LINEAR PROGRAMMING EXERCISE - UNIT TEST
6 Videos
- LINEAR INEQUALITIESBOOK - NEW JOYTHI PUBLICATIONCHAPTER - LINEAR INEQUALITIESEXERCISE - QUESTIONS FROM COMPETITIVE EXAMS
38 Videos
- MATHEMATICAL REASONINGBOOK - NEW JOYTHI PUBLICATIONCHAPTER - MATHEMATICAL REASONINGEXERCISE - QUESTION FROM COMPETITIVE EXAMS
23 Videos
Similar Questions
A company combines two items A and B from gift packs during a festival season. Each pack must weight atleast 5 kg and should contain atelast 2 kg of A and not more than 4 kg of B. The net contribution of the company is Rs. 10 per kg of A and Rs 12 per kg of B. the company wants to determine the optimum mix. By defining suitable variables, write
i. the objective function
ii. The constraints
View SolutionThe set of all x satisying the inequility 4x−13x+1≥1 is
View SolutionThe statement ~(p→q) is equivalent to
View SolutionHow many lines of symmetry does the above figure have ?
View SolutionA light ray from an object 'P' is reflected from a mirror as shown in the figure, then
ltimg src="https://d10lpgp6xz60nq.cloudfront.net/physics_images/PS_PHY_VII_C04_E07_004_Q01.png" width="80%"gt
View SolutionDetermine the point of symmetry of a regular hexagon.
View SolutionDtermine the images of the following figure about the given line :
View SolutionMatch the following Column A to Column B

View SolutionMatch the following Column A to Column B

View SolutionMatch the following Column A to Column B

View SolutionThe area of the shaded part in the figure given below is ______.

View SolutionThe inequation represented by the graph given below is :
View SolutionThe inequation that best describes the graph given below is _________
View SolutionThe inequation that best describes the following graph is _________
View SolutionWhich inequations represent the shaded region in the given figure
View Solution
