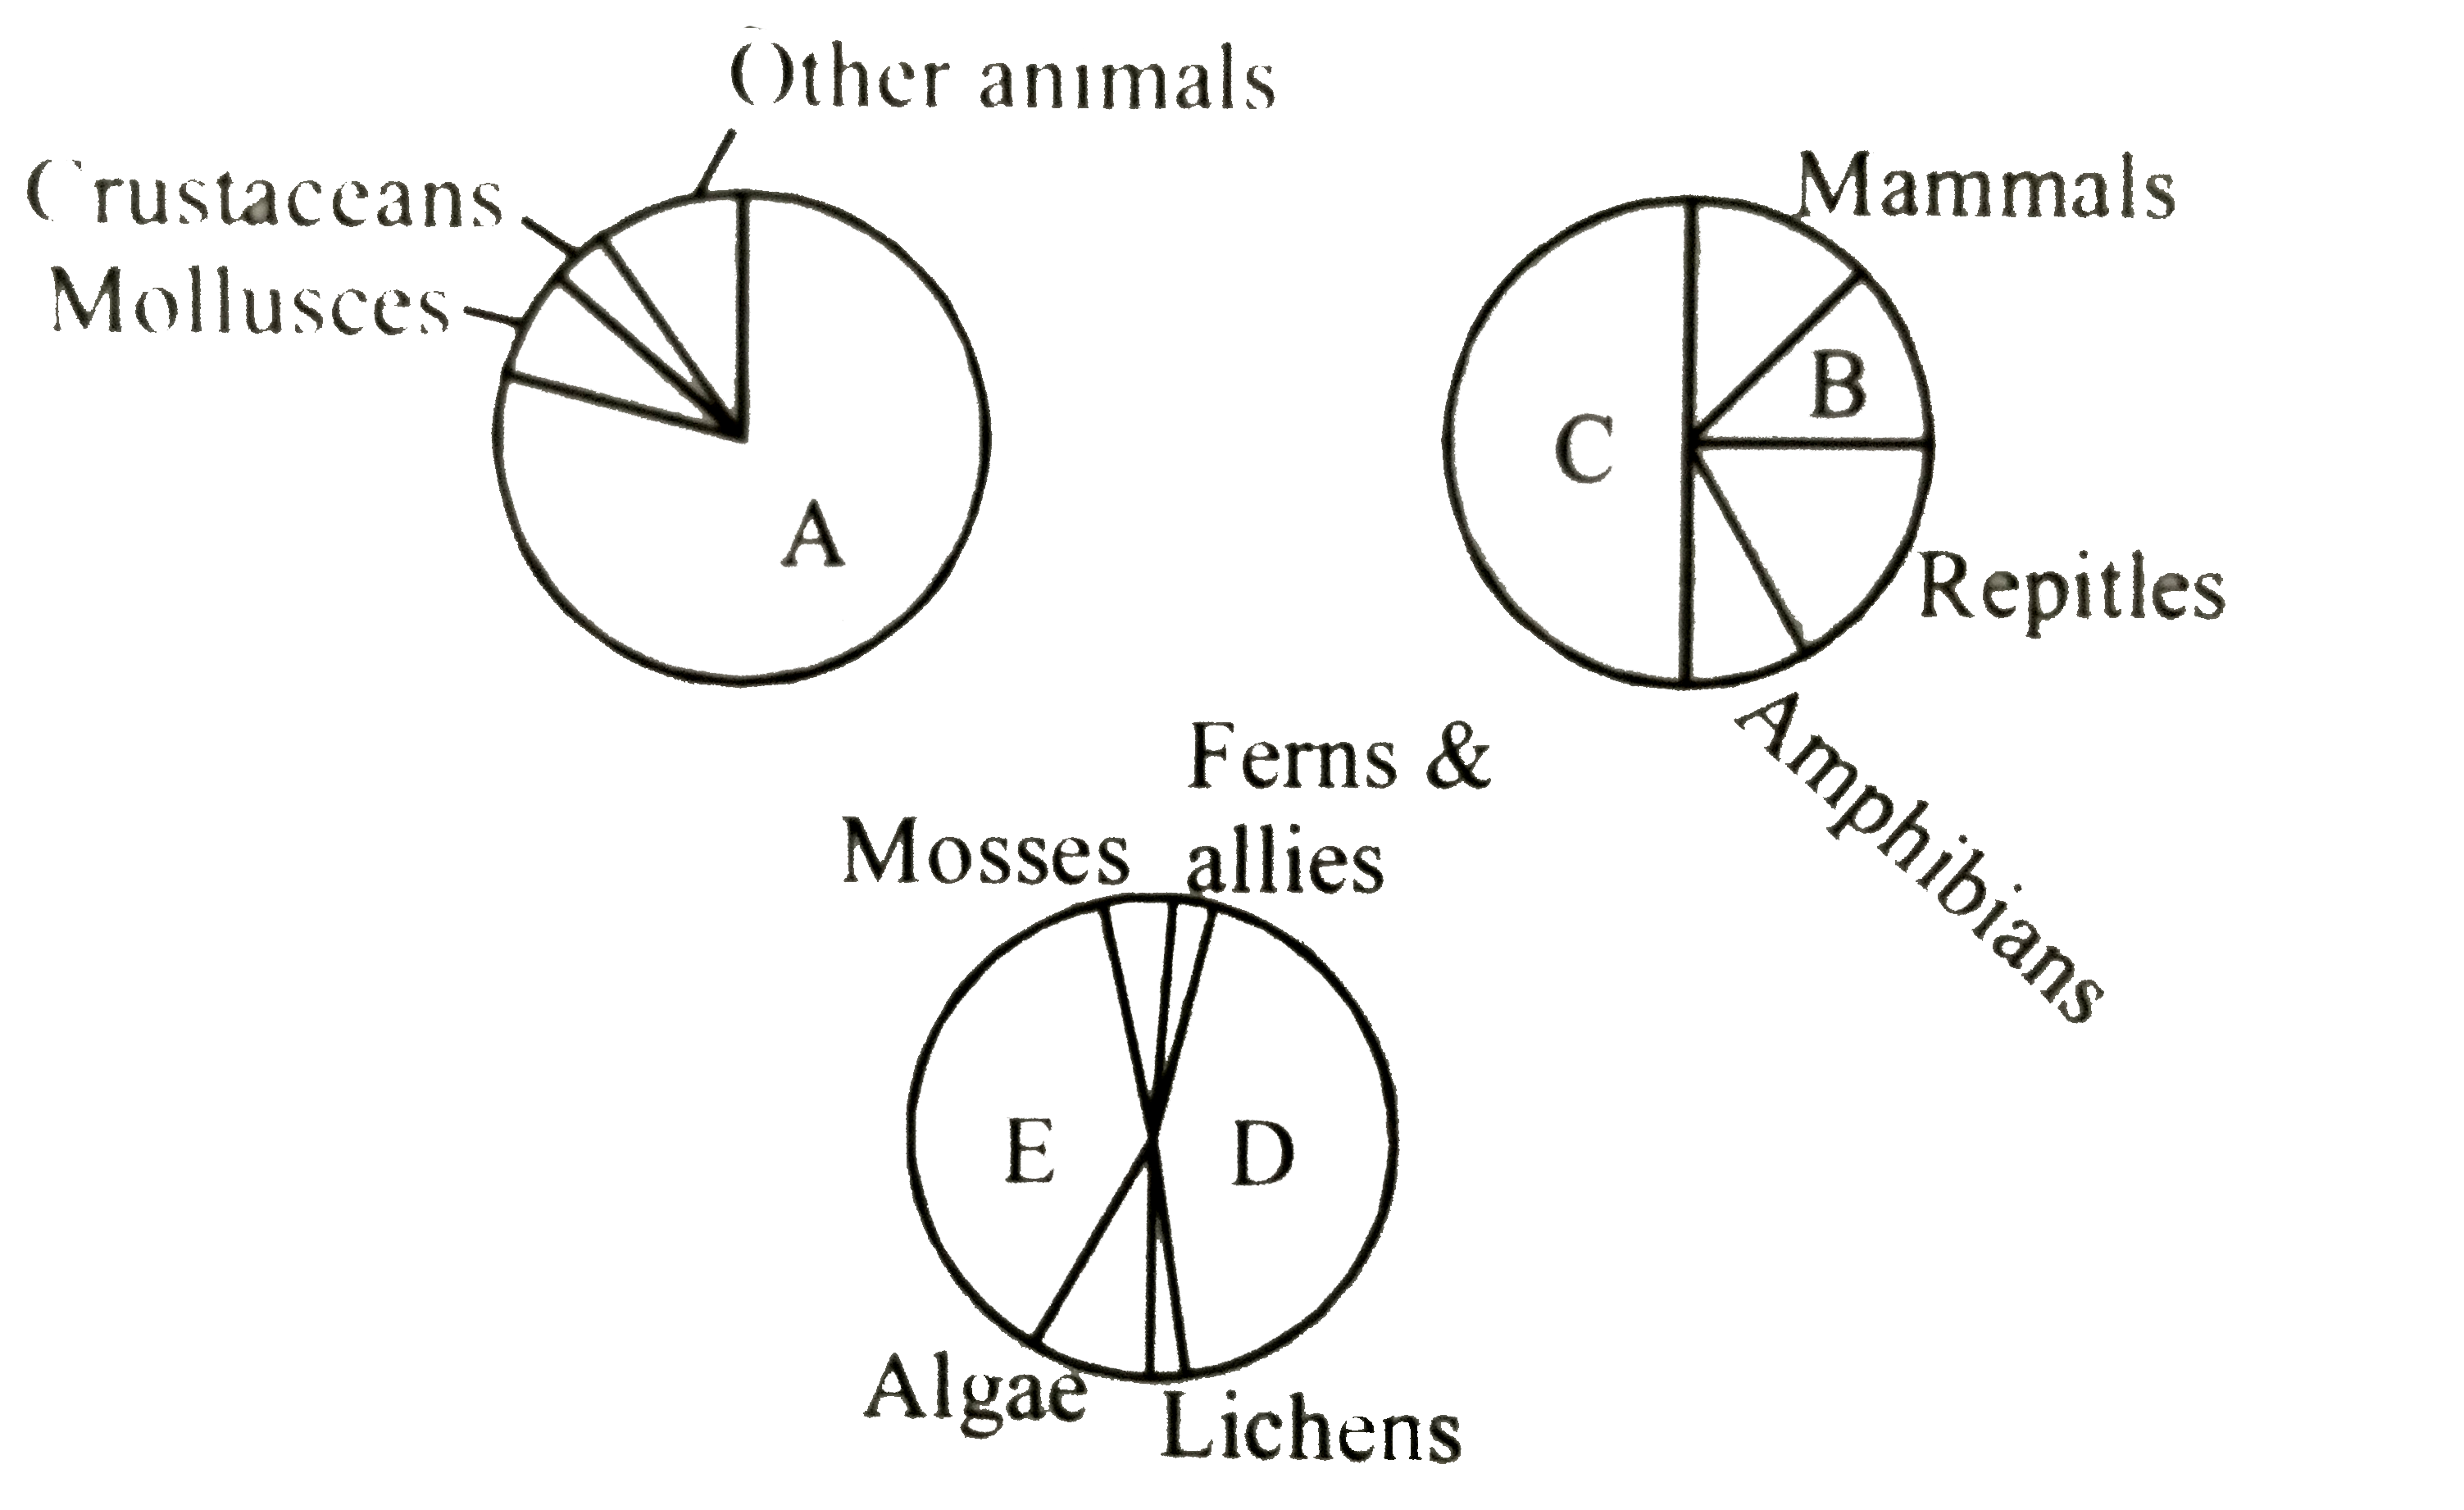
Study the above pie charts and match the following
(i) Angiosperms (ii) Fishes
(iii) Birds (iv) Fungus
(v) Insects
The correct Answer is:A-v, B-iii, C- ii, D- i, E - iv
Step by step video, text & image solution for Study the above pie charts and match the following (i) Angiosperms (ii) Fishes (iii) Birds (iv) Fungus (v) Insects by Biology experts to help you in doubts & scoring excellent marks in Class 12 exams.
Updated on:21/07/2023Similar Questions
Knowledge Check
The following pie-chart shows the study-time of different subjects of a student in a day. Study the pie-chart and answer the following questions

The time spent to study history and chemistry is 4 hours 30 minutes, Then the student studied physics forA1 hour 30 minutesB2.9 hours (approx.)C2 hoursD3 hoursThe following pie-chart shows the study-time of different subjects of a student in a day. Study the pie-chart and answer the following questions

If the student studied 10 hours in a day, then he / she studied mathematics forA3 hoursB103 hoursC13 hoursD310 hoursThe following pie-chart shows the study-time of different subjects of a student in a day. Study the pie-chart and answer the following questions

If the student studied chemistry for 3 hours, then he / she studied geography forA1 hourB2 hoursC1 hour and 30 minutesD2 hours and 30 minutes
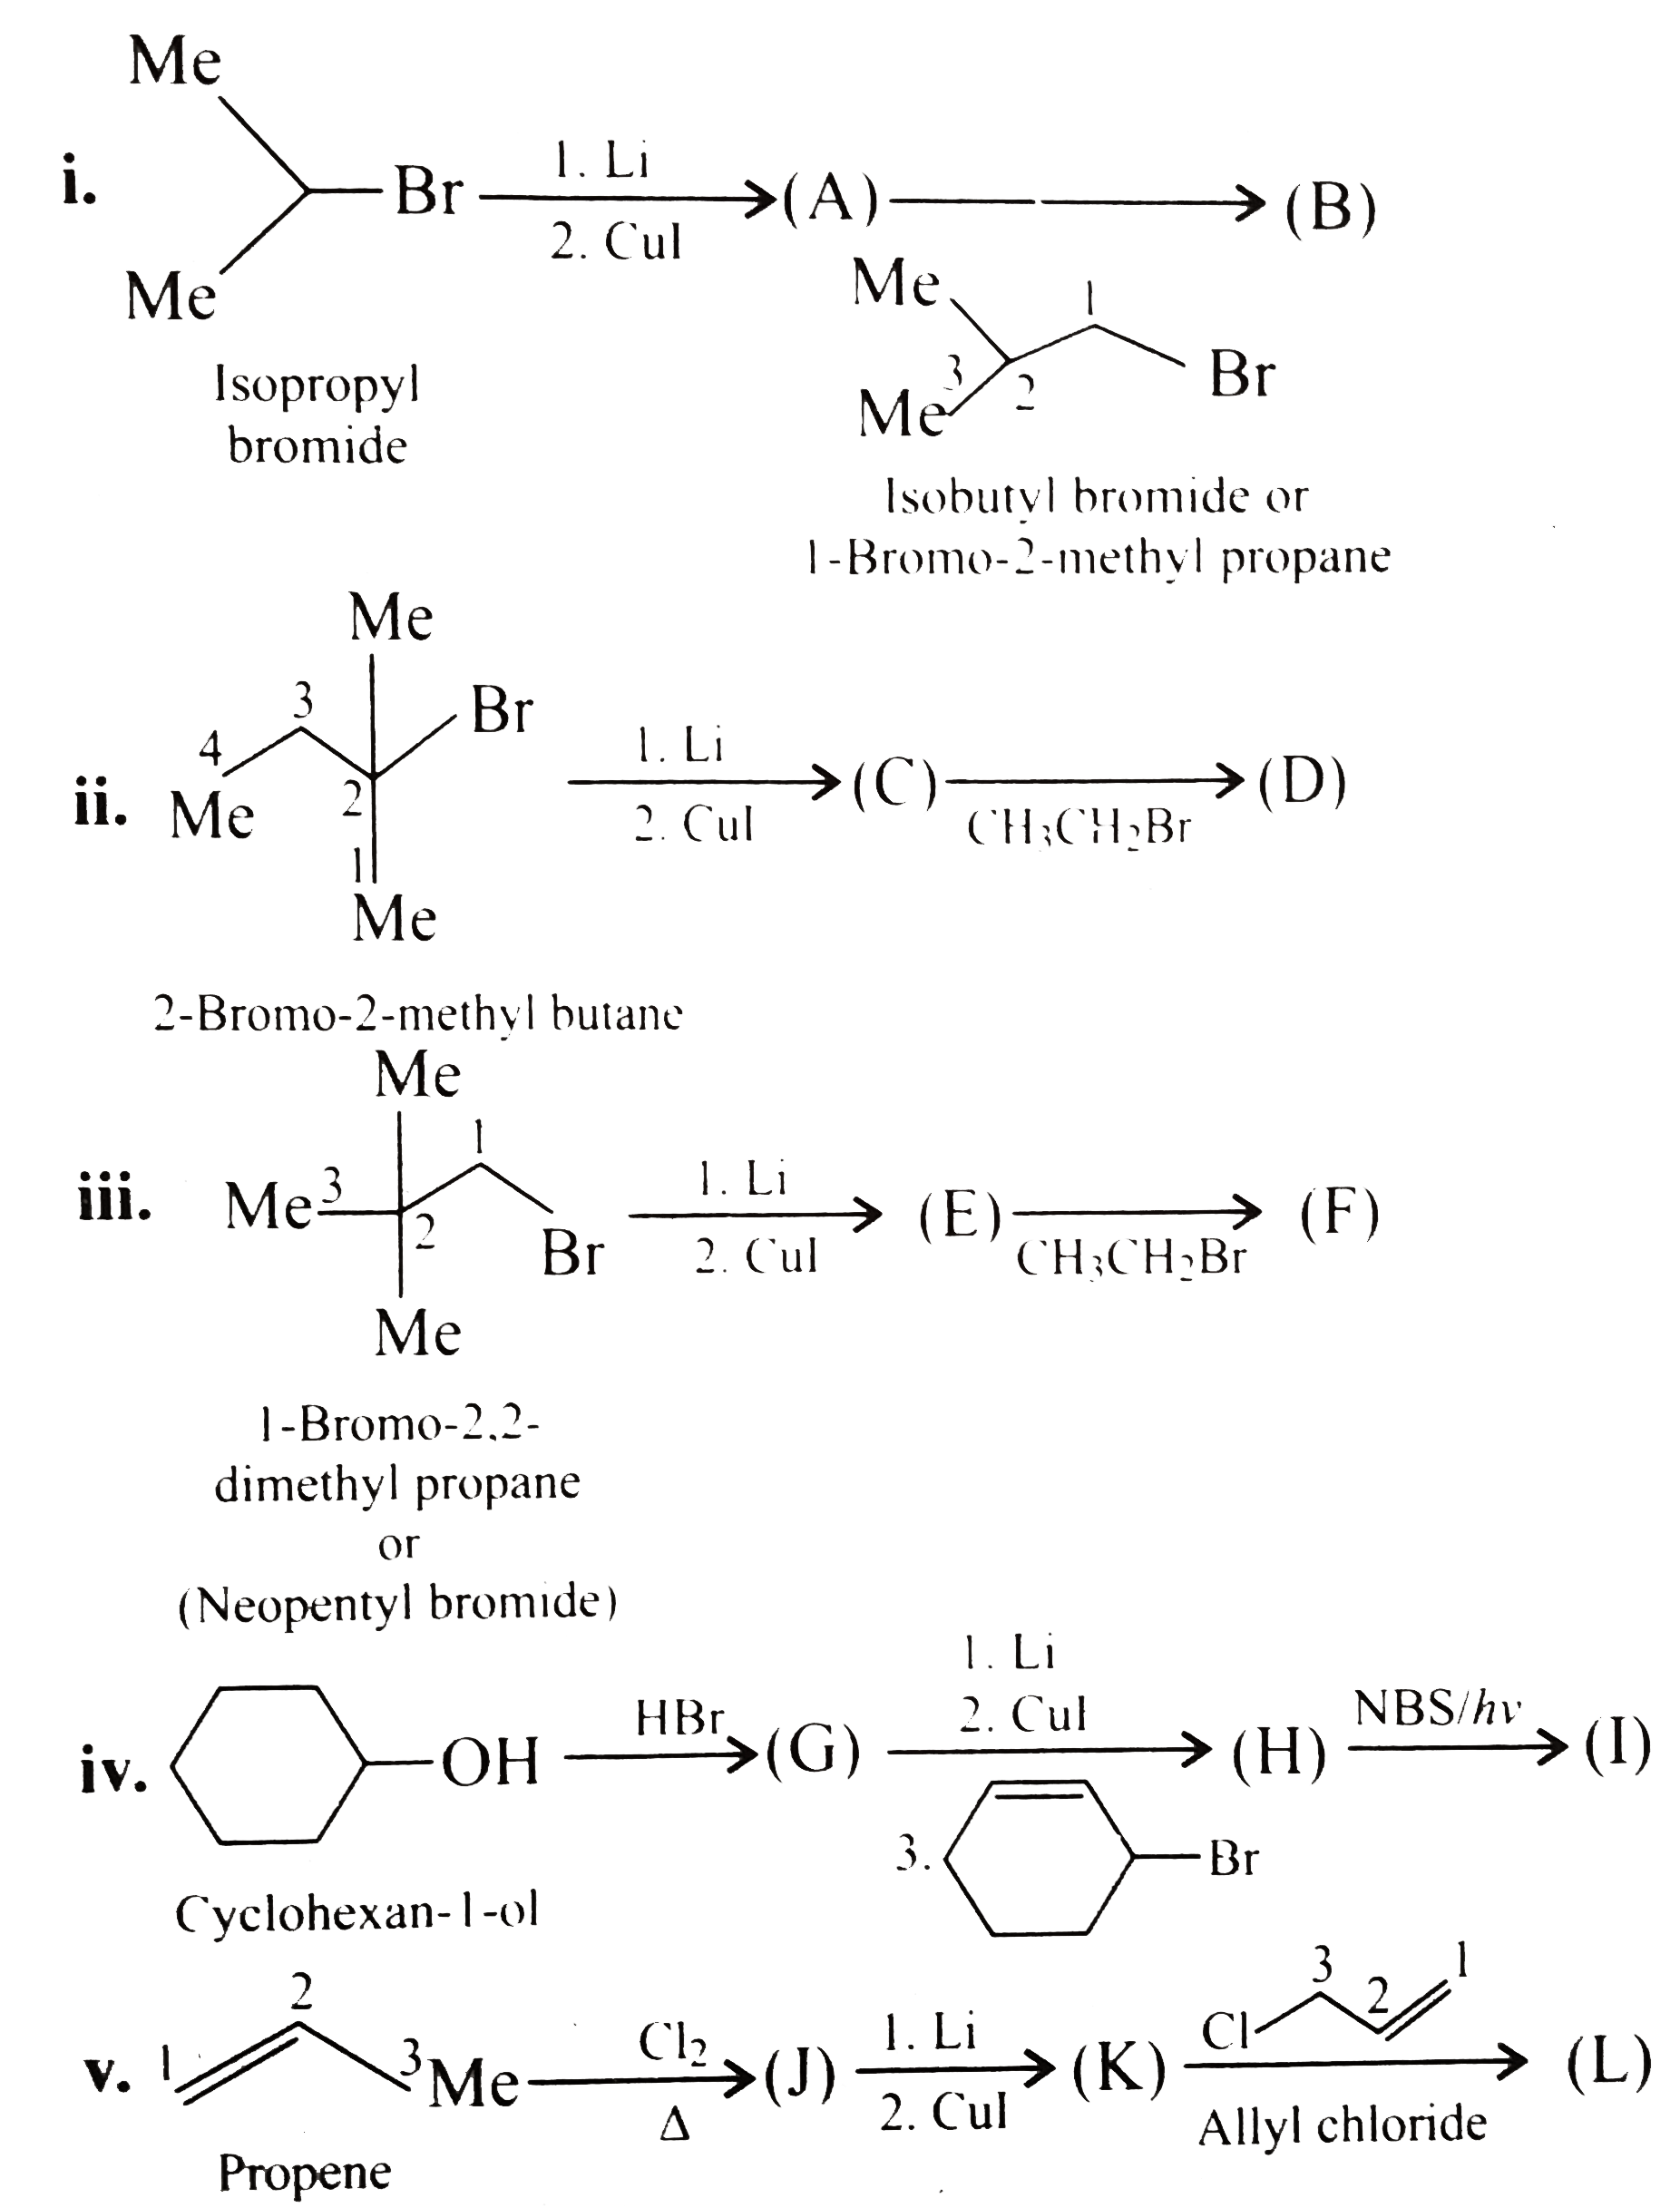
Name the types of blastula present in following animals:
(i) Amphioxus (ii) Reptiles birds and prototherian mammals
(iii) Insects (iv) Annelids ,Molluscs
View Solutioni.
ii.
iii.
iv.
iv.
v.
View SolutionIn the given pie-chart, the comaprative study of the production or Rice, Wheat, Sugar and Tea of a country is given. Study the pie-chart and answer the following questions.
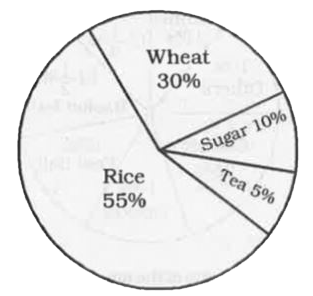
The production of rice and tea is more / greater than production of wheat by
View SolutionThe pie-chart shows Distribution of Special Children Population during the year 1994-96. Study the pie-chart and answer the following questions.
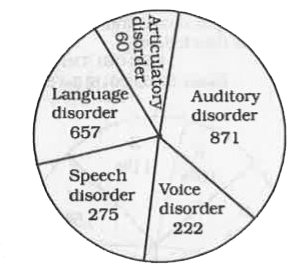
Find the ratio between articulatory disorder and speech disorder cases.
View SolutionDirections : The Paichart shows Distribution of Spacial Childern Population the year 1994-96. Study the pie-chart and answer the following questions
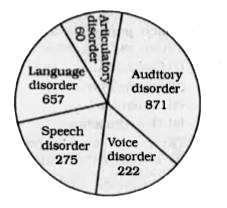
What is the respective ratio between language disorder and the average pf the remaining disorder cases?
View Solution

