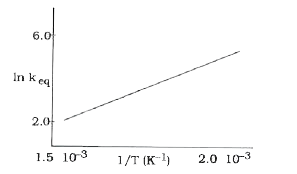
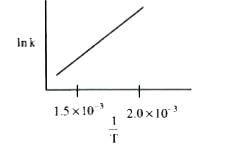
A schematic plot of In keq versus inverse of temperature for a reaction is shown below : The reaction must be :
 Solution in Kannada
exothermic
endothermic
one with negligible enthalpy change highly spontaneous at ordinary temperature .
high spontaneous at ordinary temperature .
The correct Answer is:A
(A) Ink2k1=ΔHR[1T1−1T2]
In 62=ΔHR[1.5×10⁻³−2×10⁻³]
Δ H of the reaction comes out to be - ve Therefore the reaction is exothermic .
Topper's Solved these Questions
- CHEMICAL KINETICS BOOK - MODERN PUBLICATIONCHAPTER - CHEMICAL KINETICS EXERCISE - Multiple Choice Questions (Level-III)
9 Videos
- CHEMICAL KINETICS BOOK - MODERN PUBLICATIONCHAPTER - CHEMICAL KINETICS EXERCISE - Recent Examination Questions
20 Videos
- CHEMICAL KINETICS BOOK - MODERN PUBLICATIONCHAPTER - CHEMICAL KINETICS EXERCISE - Multiple Choice Questions ( Effect of Temperature Catalyst and Radiation on Rate of Reaction )
13 Videos
- CHEMICAL BONDING AND MOLECULAR STRUCTURE BOOK - MODERN PUBLICATIONCHAPTER - CHEMICAL BONDING AND MOLECULAR STRUCTURE EXERCISE - Recent Examination Questions
17 Videos
- CHEMISTRY IN EVERY DAY LIFE BOOK - MODERN PUBLICATIONCHAPTER - CHEMISTRY IN EVERY DAY LIFE EXERCISE - Recent Examination Questions
4 Videos
Similar Questions
The half life period of a first order chemical reaction is 6.93 minutes . The time required for the completion of 99% of the chemical reaction will be ( log 2 = 0.301 ) :
View Solution2 g of a radioactive sample having half life of 15 days was synthesised on 1st Jan 2009. The amount of the smaple left behind on 1st March, 2009 (including btoh the days)
View SolutionIf k1 and k2 are rate constants at temperatures T1 and T2 respectively then according to Arrhenius equation :
View SolutionAmong the following, the compound that contains ionic, covalent and coordinate linkage is :
View SolutionOils are liquids at room temperature since they contain higher percentage of
View SolutionA schematic plot of log K_(eq) vs inverse of temperature for a reaction is shown in the figure. The reaction must be:
View SolutionThe graph relates. In K_(eq.) vs.(1)/(T) for a reaction. The reaction must be:
View SolutionA schematic plot of In Keq versus inverse o ftemperature for a reaction is shown below
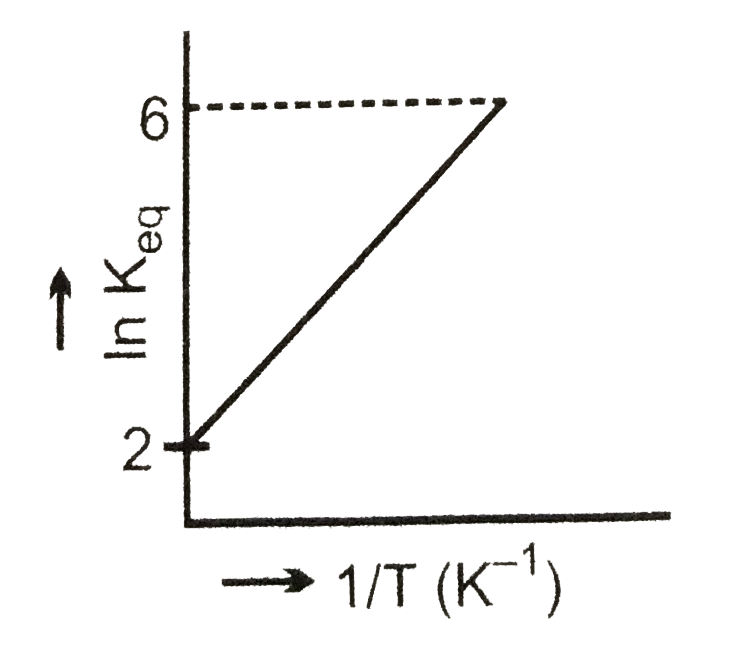
the reaction must be:
View SolutionFor a reversible reaction at constant temperature and at constant pressure the equilibrium composition of reaction mixture corresponds to the lowest point on Gibbls energy Vs progress of reaction diagrams as shown. At equilibrium Gibbs energy of reaction is equal to zero.
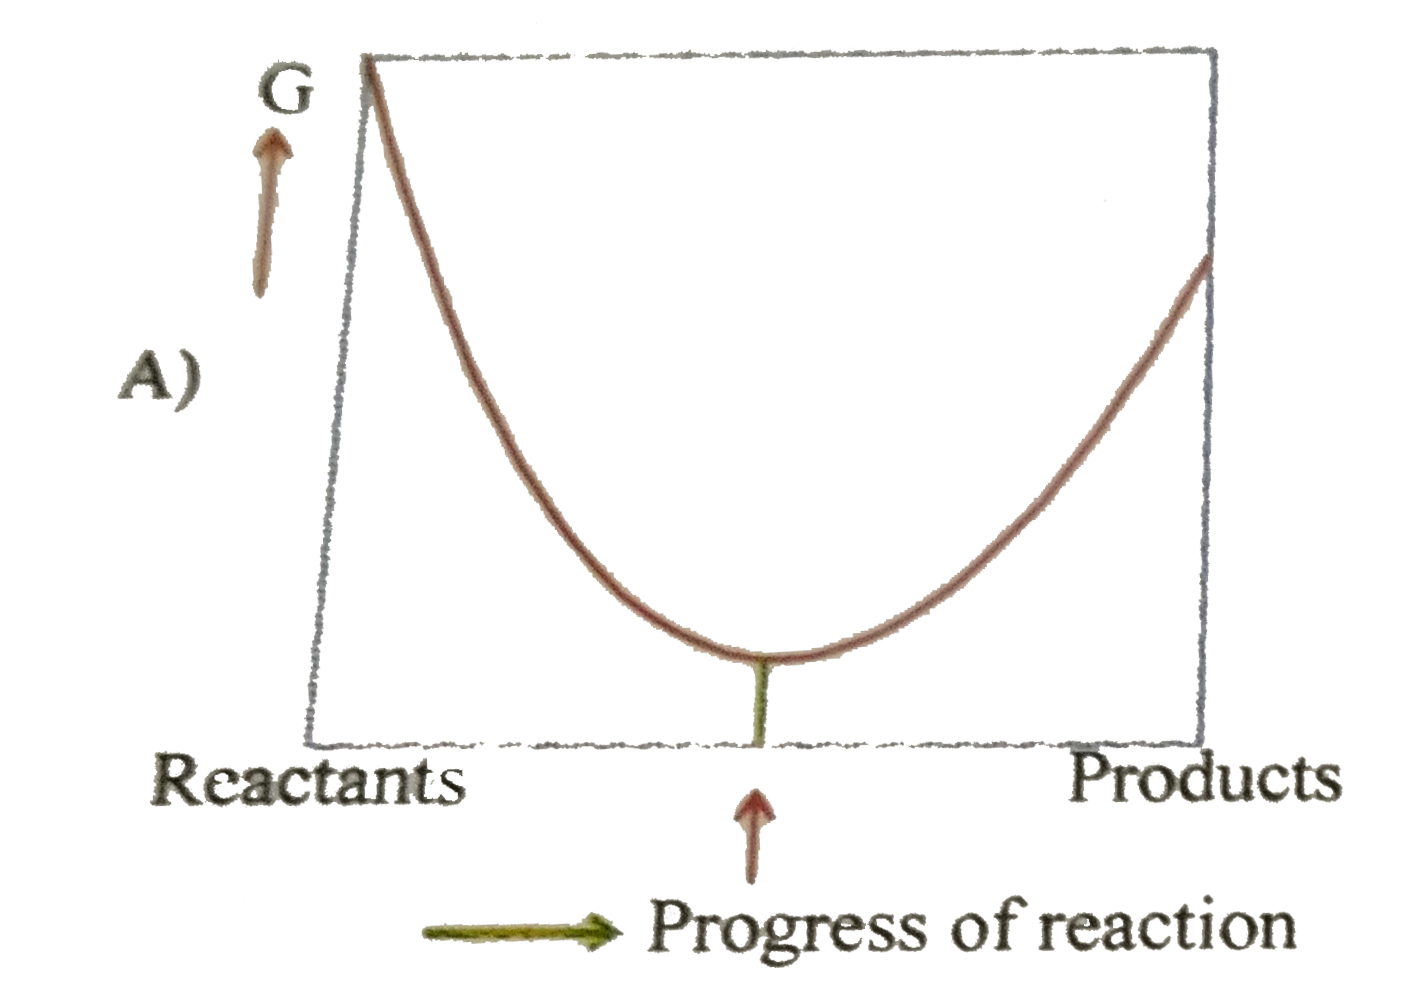
The value of log10Keq is equal to [keq is the equilibrium coustant]
View SolutionThe enthalpy (H) of an elementary exothermic reaction A iff B is schematically plotted against the reaction coordinate. The plots in the presence and absence of a catalyst are shown in dashed and solid lines, respectively. Identify the correct plot for the reaction.
View SolutionFor a reversible exothermic reaction , which is the effect of increasing temperature on the equilibrium constant (keq) and on the forward rate constant (kf)?
View SolutionA schematic plot of ln Keq versus inverse of temperature for a reaction is shown below
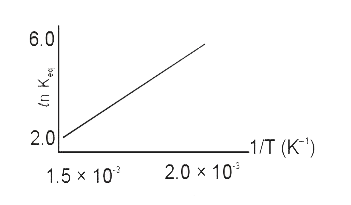
The reaction must be
View SolutionA schematic plot of ln K_(eq) versus inverse of temperature for a reaction is shown below: The reaction must be:
View SolutionThe graph relates in Keq.VslT for a reaction. The reaction must be :
View SolutionA schematic plot of In K_(eq) versus inverse o ftemperature for a reaction is shown below the reaction must be:
View Solution
