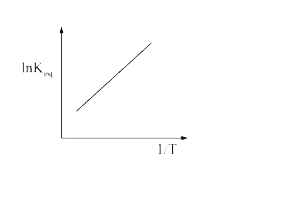
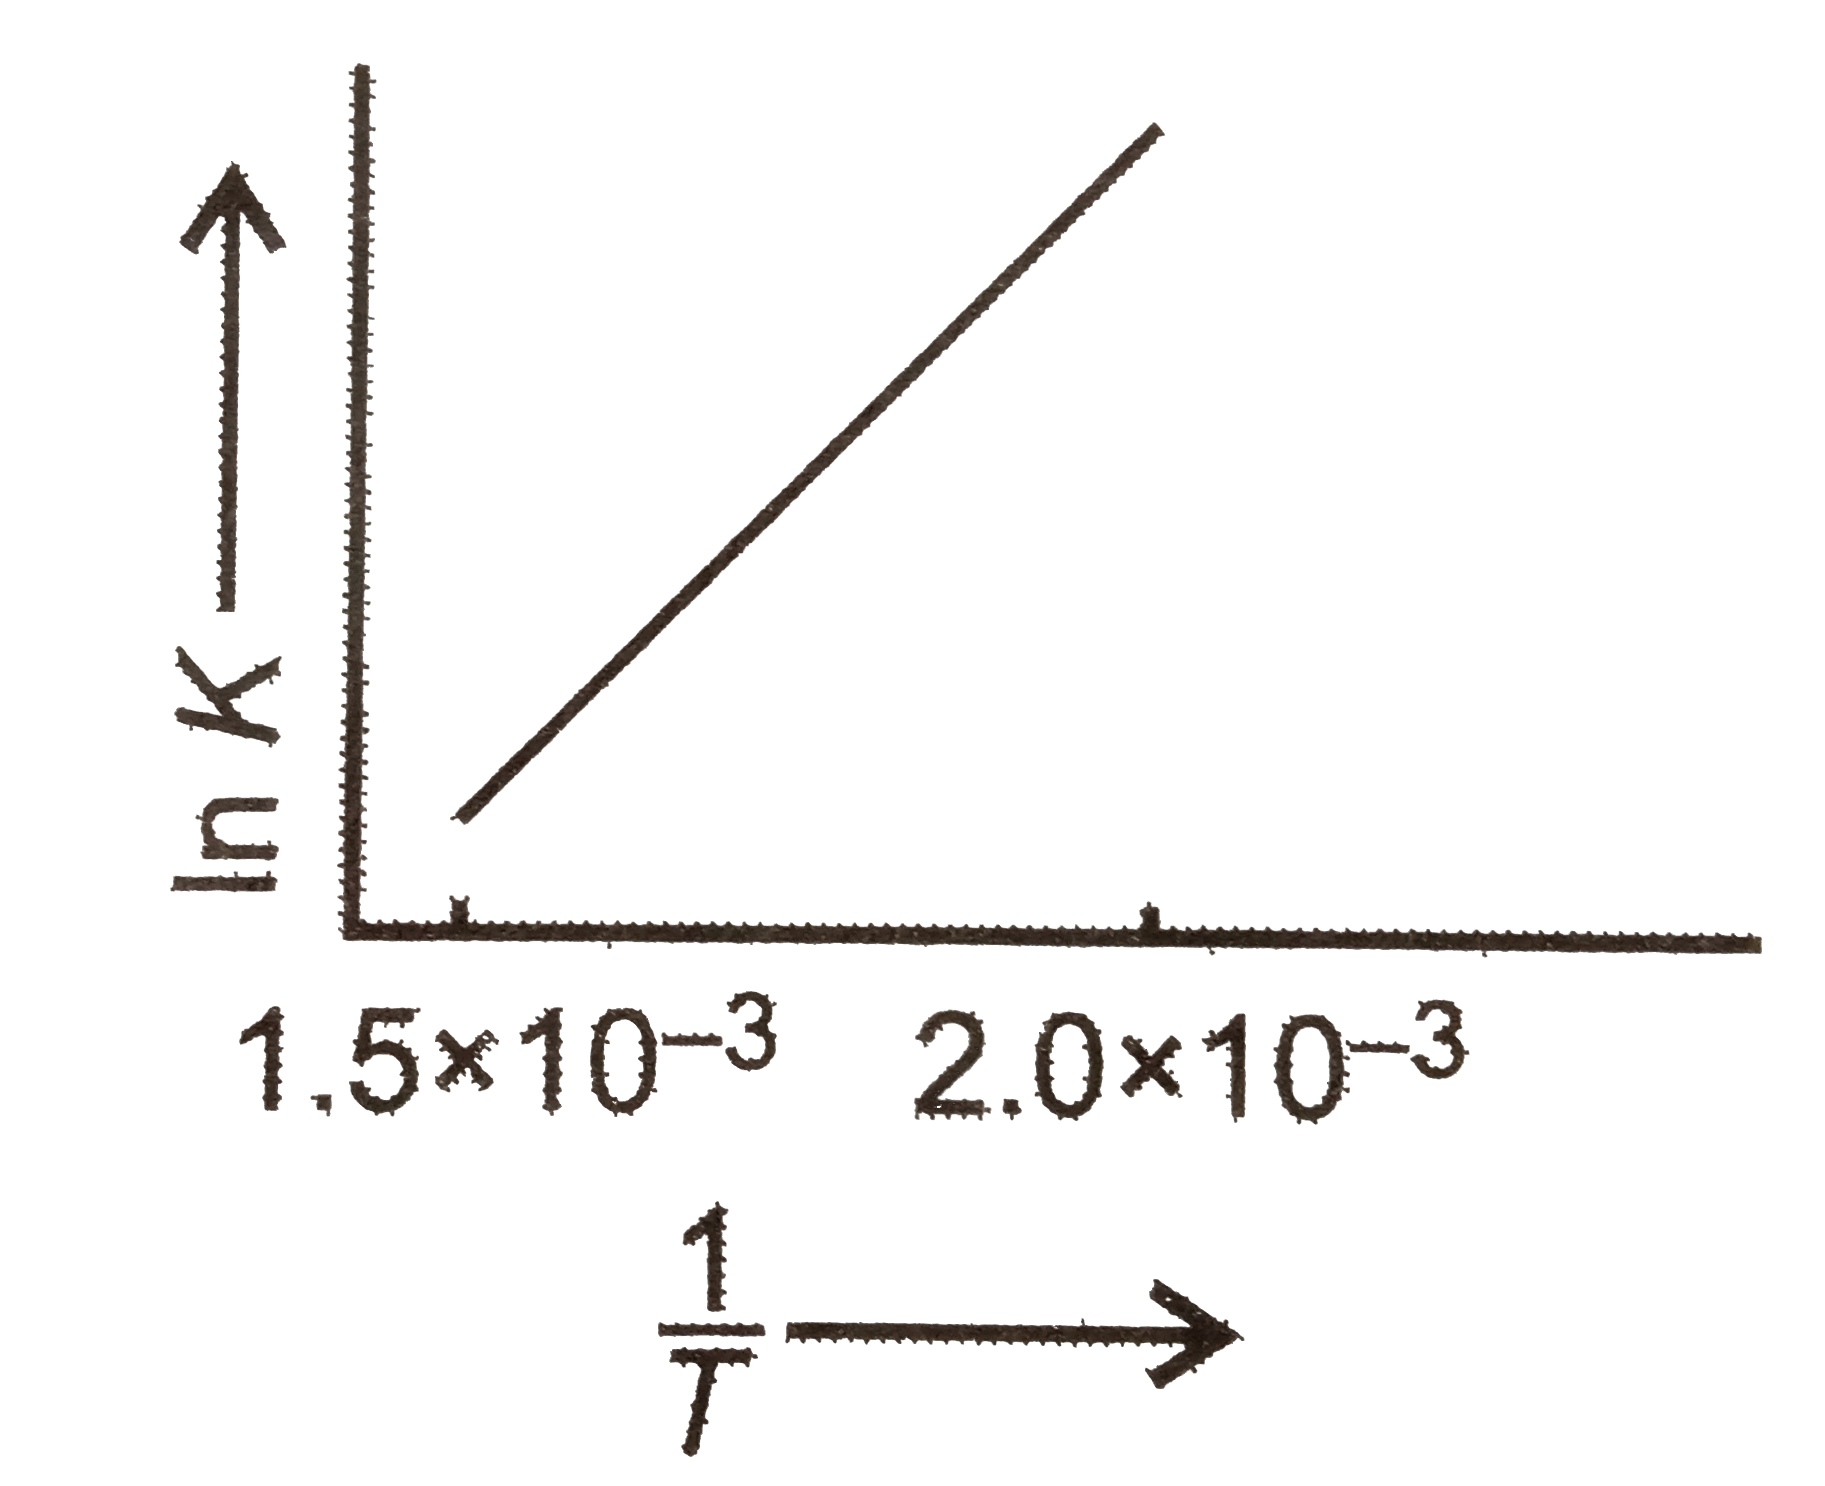
A schematic plot of ln Keq versus inverse of temperature for a reaction is shown below: The reaction must be:
Highly spontaneous at ordinary temperature
One with negligible enthalpy change
endothermic
exothermic
The correct Answer is:D
Variation of Keq with temperature t is given by van't Hoff equation ln Keq=−ΔH∘RA.1T+ΔS∘RR
Slope of the given line is positive indicating that term A is positive, thus ΔH∘ is negative. Thus, reaction is exothermic.
Similar Questions
Assertion: The plot of volume (V) versus pressure (P) at constant temperature is a hyperbola in the first quadrant.
Reason: V∝1/P at constant temperature.
View SolutionFor the reaction aA+bB→cC+dD, the plot of log k vs 1T is given below,
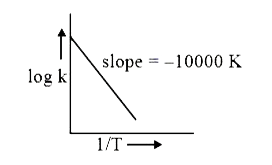
The temperature at which the rate constant of the reaction is 10−4s−1 is _____K.
(Rouded -off the nerest integer)
[Given : The rate constant of the reaction is 10−5s−1 at 500 K.]
View Solution
Knowledge Check
A schematic plot of In Keq versus inverse o ftemperature for a reaction is shown below
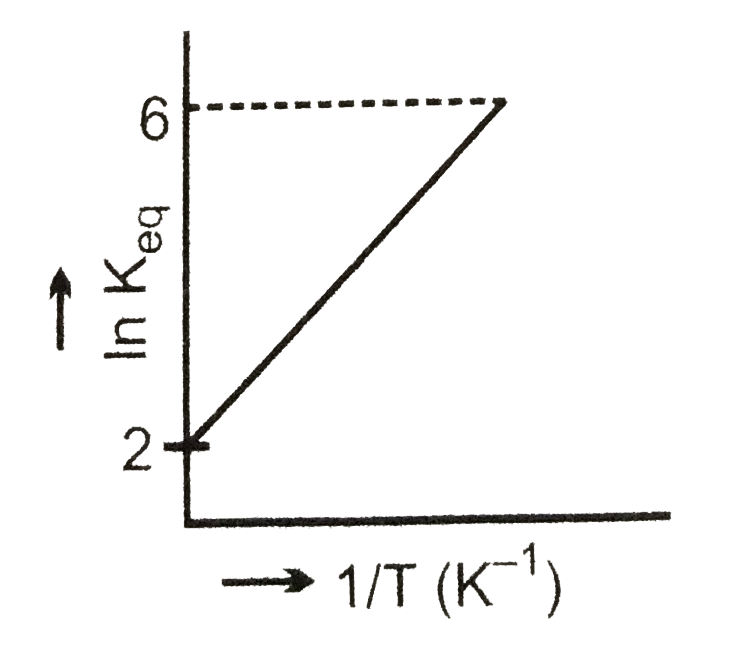
the reaction must be:AExothermicBEndothermicCOne with negligible enthalpy changeDHighly spontanceous at ordinary temperatureA schematic plot of log Keq vs inverse of temperature for a reaction is shown in the figure. The reaction must be:
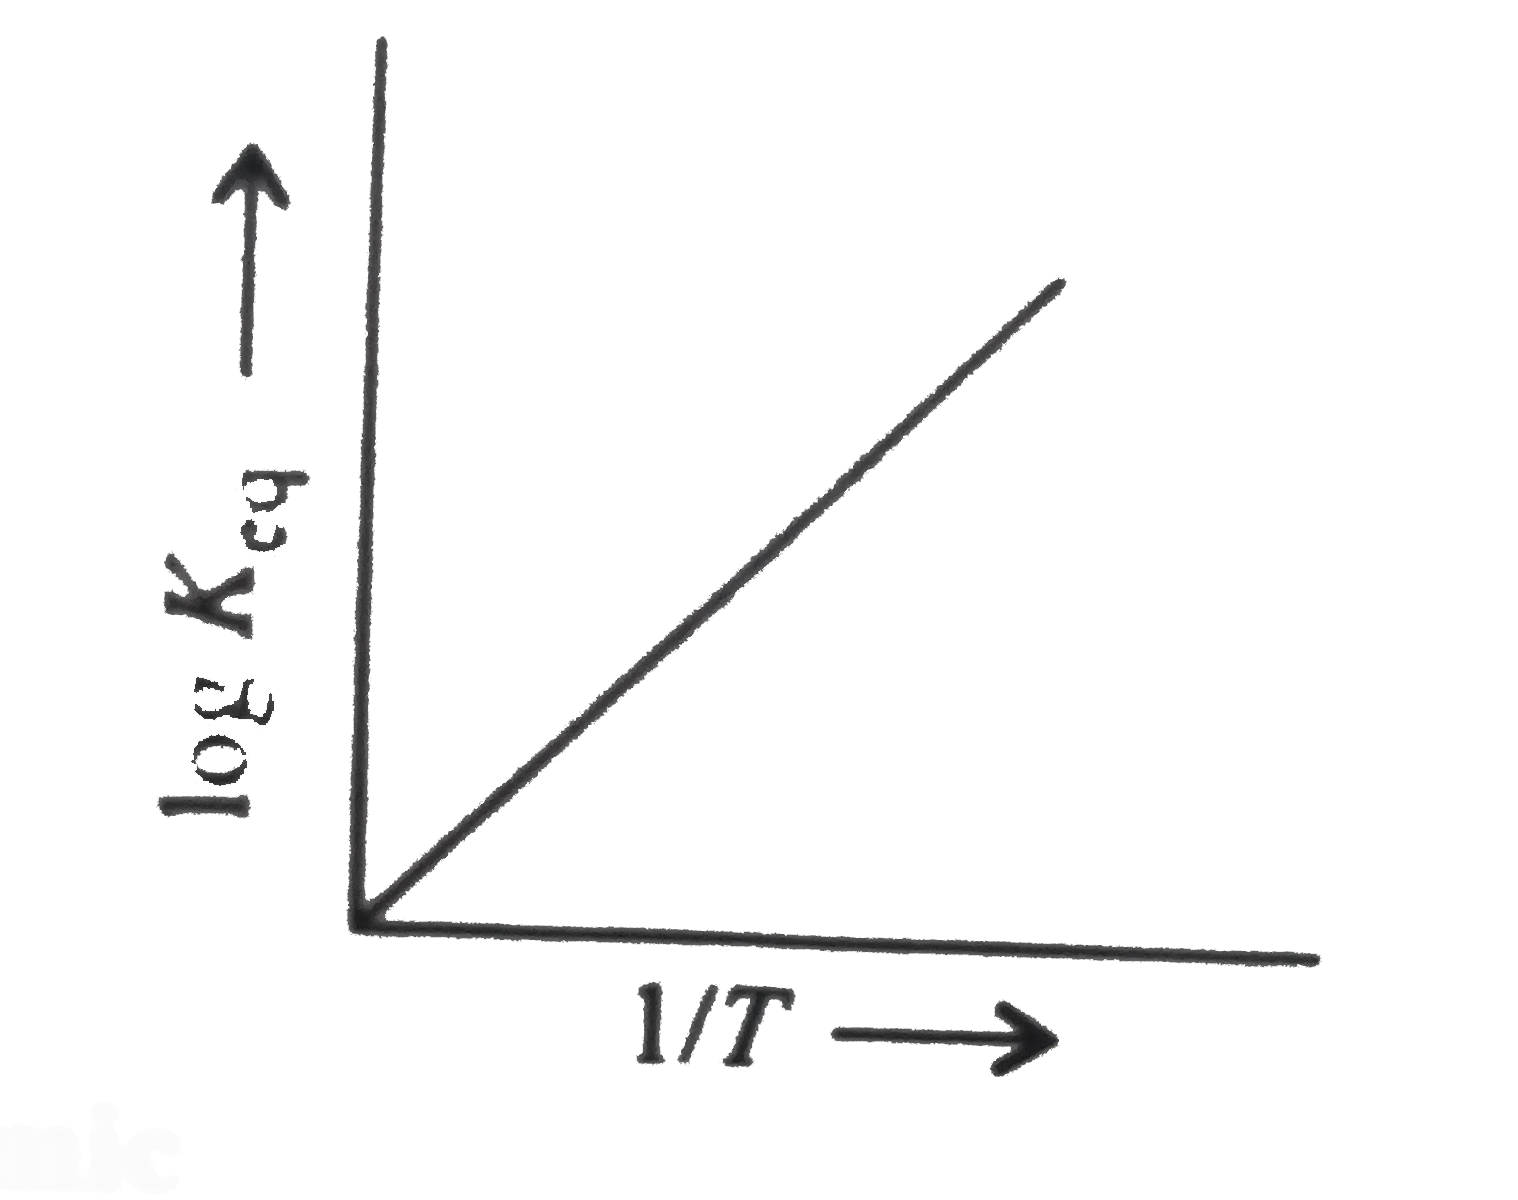 AExothermicBEndothermicCOne with negligible enthalpy changeDHighly spontaneous at ordinary temperature
The plot of In k versus 1T is liner with slope of
AEaRBEa2.303RCIn AD−EaR
Give a plot of Fahrenheit temperature versus Celsius temperature.
View SolutionThe plot of ΔG versus temperature for the formation of oxides of elements is called
View SolutionThe graph relates. In Keq.vs.1T for a reaction. The reaction must be:
View SolutionFor a reaction, consider the plot of In K versus 1/T given in the figure. If the rate constant of this reaction at 400 K is 10−5s−1, then the rate constant at 500K is :
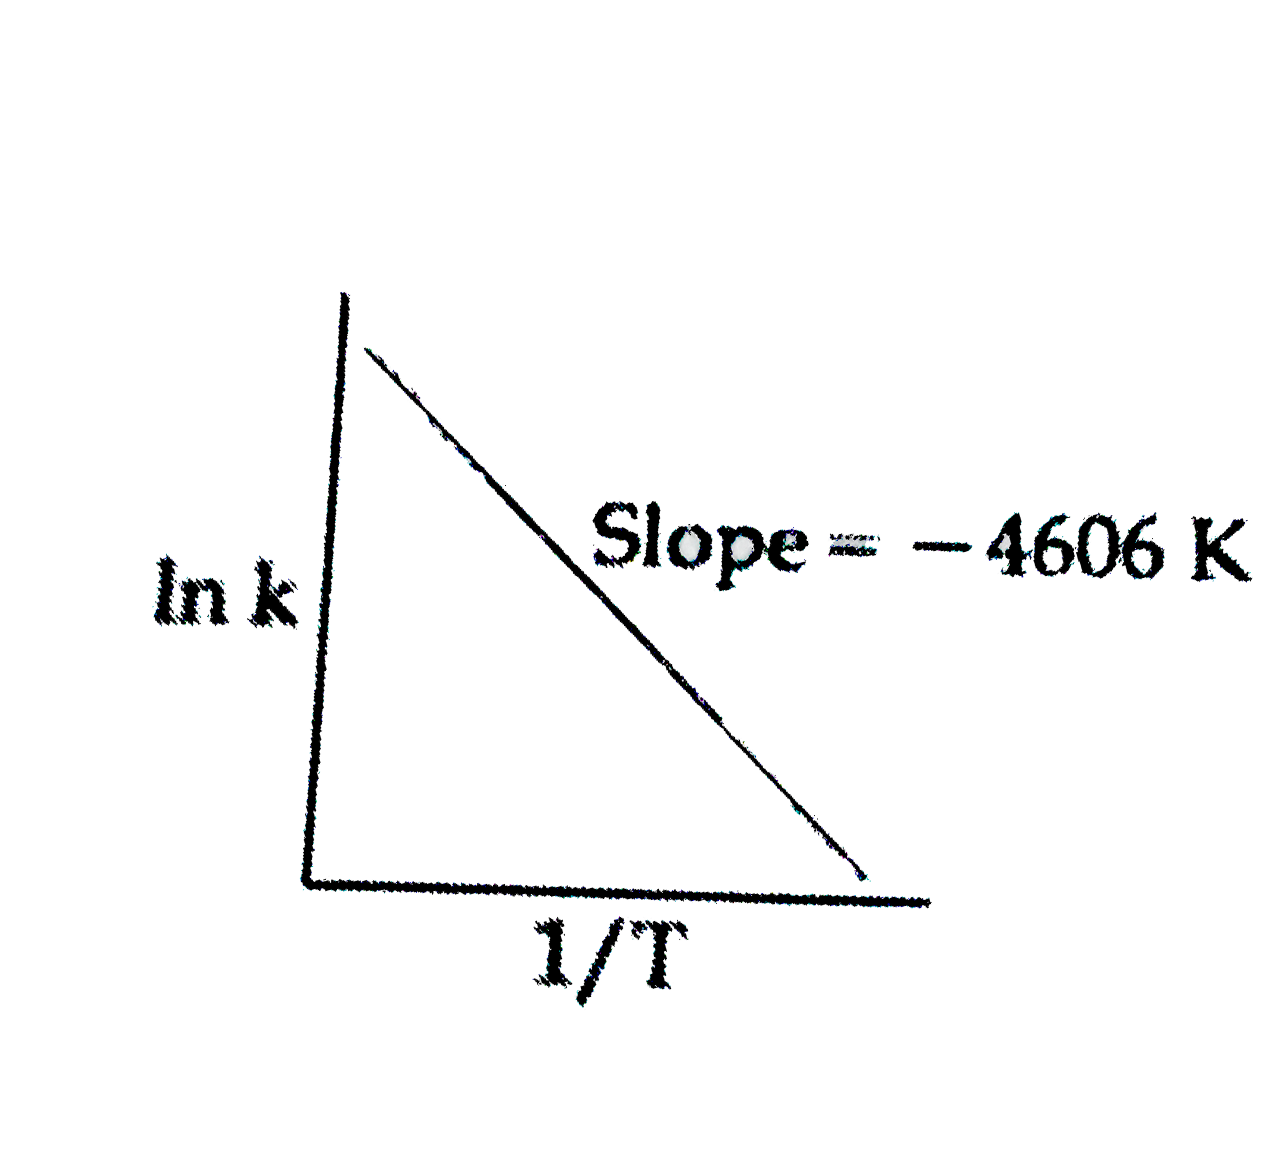
View SolutionWhen a plot of log k versus 1/T of chemical reaction is made, the energy of activation is given by the slope of straight line
View Solution
