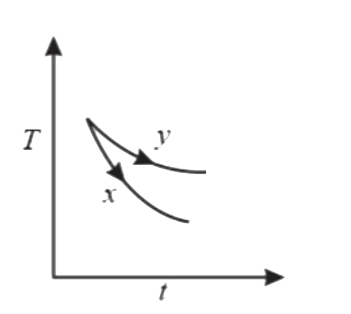
The graph shown in the adjacent diagram, represents the variation of temperature T of two bodies x and y having same surface area, with time (t) due to emission of radiation. Find the correct relation between the emissive and adsoptive powers of the two bodies :
 Solution in Kannada
Ex>Ey and ay<ay
Ex<Ey and ax>ay
Ex>Ey and ax>ay
Ex<Ey and ax<ay
The correct Answer is:C
From graph (dTdt)x>(dTdt)y⇒Ex>Ey.
According to Kirchhoff.s law good emitters are good absorbers ∴ax>ay.
∴ Coorect choice is (c ).
Topper's Solved these Questions
- TRANSFERENCE OF HEAT Book:MODERN PUBLICATIONChapter:TRANSFERENCE OF HEAT Exercise:Multiple Choice Questions (Level - III) Questions From AIEEE/JEE Examination)
Explore 5 Videos
- TRANSFERENCE OF HEAT Book:MODERN PUBLICATIONChapter:TRANSFERENCE OF HEAT Exercise:Recent Competitive Questions
Explore 4 Videos
- TRANSFERENCE OF HEAT Book:MODERN PUBLICATIONChapter:TRANSFERENCE OF HEAT Exercise:Recent Competitive Questions
Explore 4 Videos
- SOLIDS & SEMICONDUCTOR DEVICESBook:MODERN PUBLICATIONChapter:SOLIDS & SEMICONDUCTOR DEVICESExercise:Revision Test
Explore 28 Videos
- UNIFORM CIRCULAR MOTIONBook:MODERN PUBLICATIONChapter:UNIFORM CIRCULAR MOTIONExercise:Revision Test
Explore 57 Videos
Similar Questions
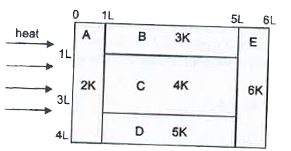
A composite block is made of slabs A,B,C,D and E of different thermal conductivities (given in terms of a constant K) and sizes (given in terms of length, L) as shown in the figure. All slabs are of same width. Heat 'Q' flows only from left to right through the blocks.
Then in steady state

View SolutionTwo slabs are of the thicknesses d1 and d2. Their thermal conductivities are K1 and K2 respectively They are in series. The free ends of the combination of these two slabs are kept at temperatures θ1 and θ2. Assume θ1>θ2. The temperature θ of their common junction is
View SolutionTwo slabs are of the thicknesses d1 and d2. Their thermal conductivities are K1 and K2 respectively They are in series. The free ends of the combination of these two slabs are kept at temperatures θ1 and θ2. Assume θ1>θ2. The temperature θ of their common junction is
View SolutionChoose the forward biased p-n junction :
View SolutionA sphere of mass m is tied to end of a string of length 1 and rotated through the other and along a horizontal circular path with speed . The work done in full horizontal circle is:
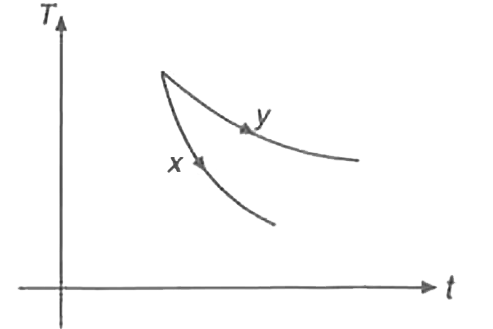
View SolutionThe graph, shown in the adjacent diagram, represents the variation of temperature (T) of two bodies, x and y having same surface area, with time (t) due to the emission of radiation. Find the correct relation between the emissivity and absorptivity power of the two bodies
View SolutionTwo bodies of same shape, same size and same radiating power have emissivities 0.2 and 0.4 The ratio of their temperature is .
View SolutionIf the rate of emission of radiation by a body at temperature TK is E then graph between log E and log T will be .
View SolutionTwo bodies A and B have emissivities 0.5 and 0.8 respectively. At some temperature the two bodies have maximum spectral emissive powers at wavelength 8000Å and 4000Å respectively. The ratio of their emissive powers at these temperatures is :
View SolutionThe energy of 6000 J is radiated in 10 minutes by a body of surface area 200 cm^(2) . Find the emissive power of the body.
View SolutionA body with surface area (A), temperature (T) and emissivity (e) = 0.6 is kept inside a spherical black body. What will be the maximum energy radiated ? [ sigma is Stefan's constant]
View SolutionThe graph shown in the adjacement diagram represents the variation of temperature (T) of two bodies x and y having the same surface area, with time (t). Both of these bodies lose heat only due to the emission of radiation. Find the correct relation between the emissive and absorptive power of the two bodies.

View Solutionचित्र में प्रदर्शित वक्र, दो वस्तुओं (x व y) जिनके पृष्ठ क्षेत्रफल समान है, के ताप का परिवर्तन, विकिरण के उत्सर्जन के कारण, समय के साथ दर्शाते है | दोनों वस्तुओं की उत्सर्जकता (Emissivity) तथा अवशोषण क्षमताओं (Absorptive power) में सम्बन्ध है

View SolutionTwo bodies of same shape, same size and same radiating power have emissivities 0.2 and 0.8. The ratio of their temperatures is
View Solution............... of a body at a given temperature is the ratio of total emissive power of the body to the total emissive power of a perfectly black body at the same temperature.
View Solution

