Which of the following graphs correctly represents the variation of g on the - Earth? Solution in Kannada
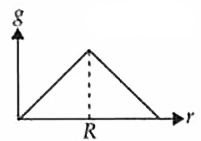
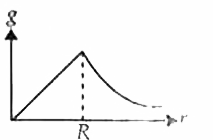
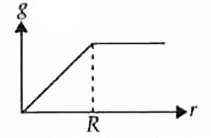
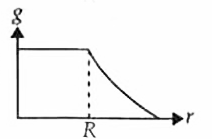
The correct Answer is:B
The variation of g with distance r from the centre of the Earth is as follows :
For r<R
g=GMrR3 or g∝r
For r≥R,
g=GMr2 or gr∝1r2
Thus, graph (b) correctly represents the variation of g on the Earth as shown in the figure above .

Topper's Solved these Questions
Similar Questions
In the A. C. circuit shown, keeping 'K' pressed, if an iron rod is inserted into the coil, the bulb in the circuit

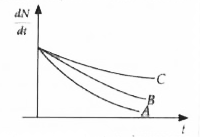
View SolutionWhich one of the following nuclei has shorter mean life?
View SolutionWhich of the following graphs correctly represents the variation of β=−dV/dPV
with P for an ideal gas at constant temperature?
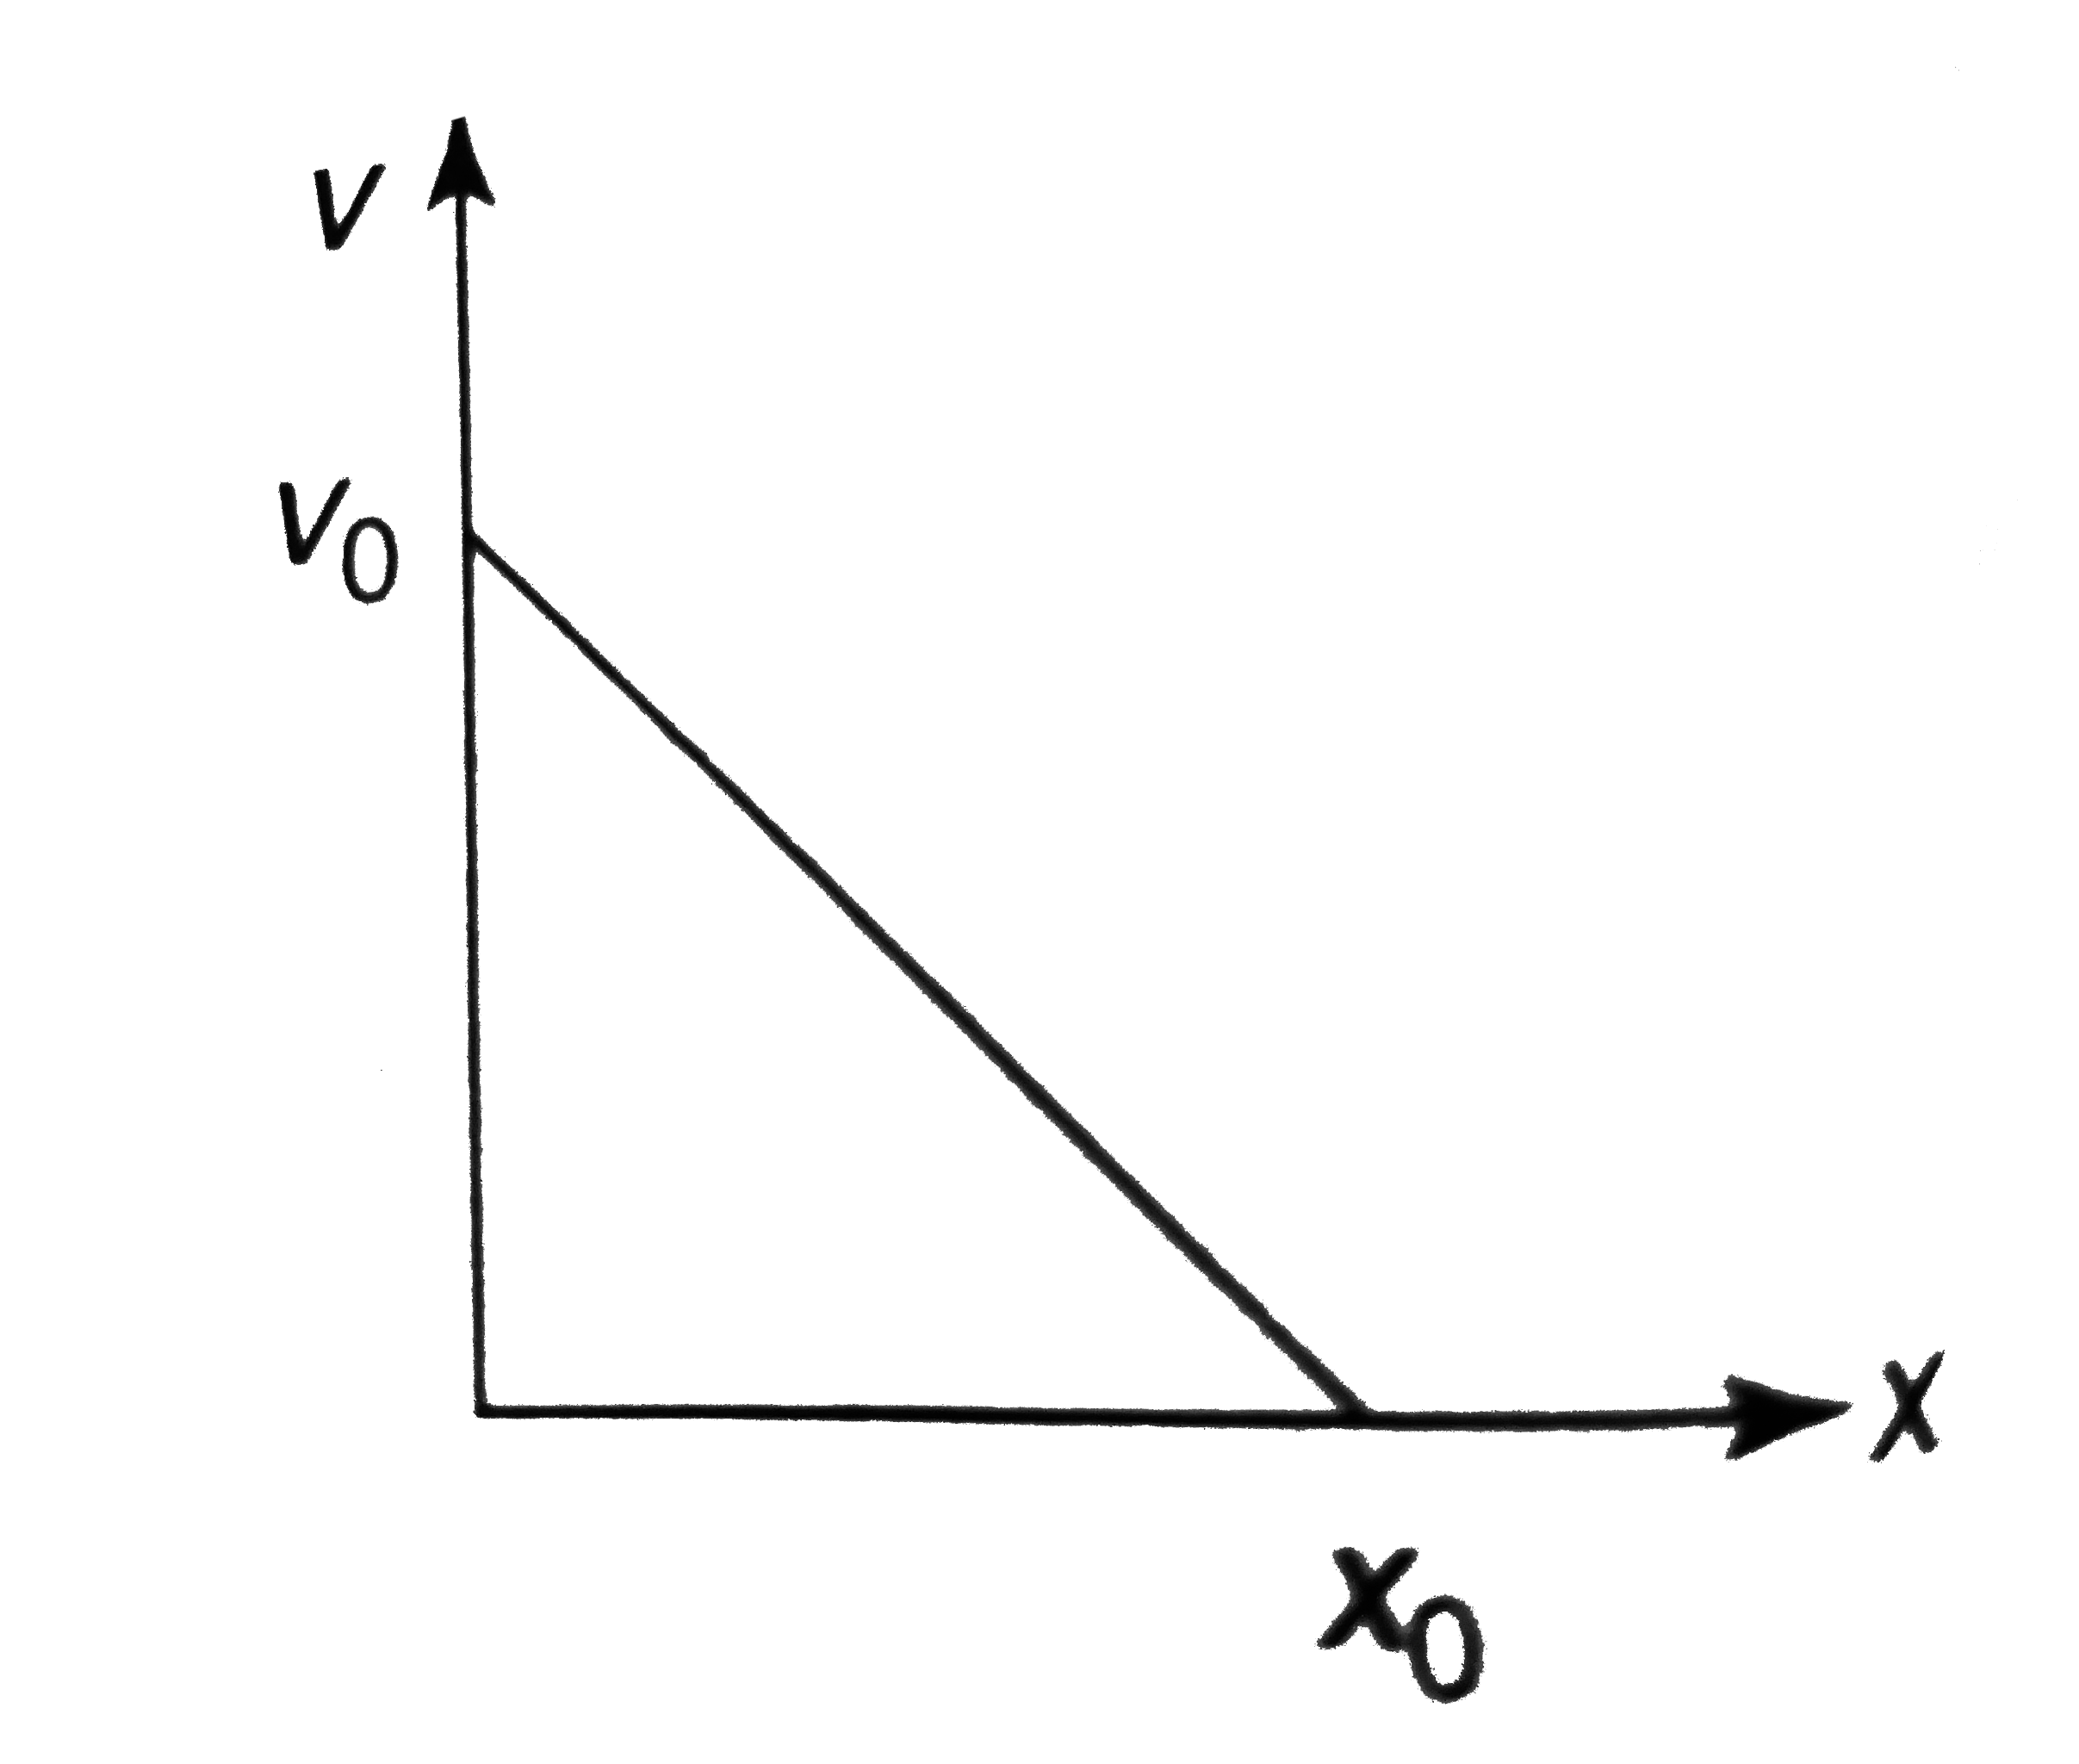
View SolutionThe given graph shows the variation of velocity with displacement. Which one of the graphs given below correctly represents the variation of acceleration with displacement ?
View SolutionWhich of the following graphs correctly represents the variation of β=−(dVdP)/V with P for an ideal gas at constant temperature
View SolutionWhich of following graphs correctly represents the variation of particle momentum with de-Broglie wavelength?
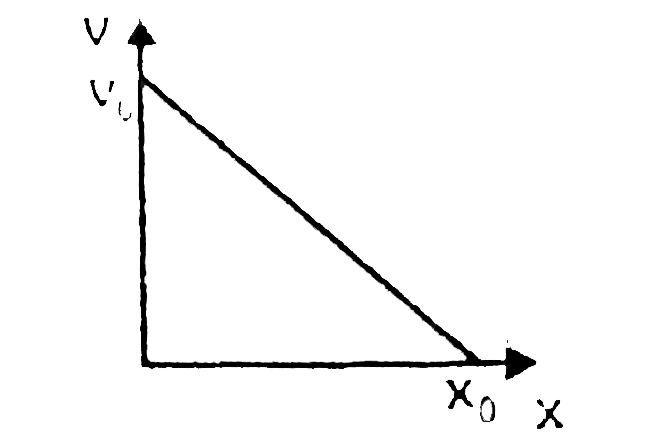
View SolutionThe velocity -displacement graph of a particle is as shown in the figure. Which of the following graphs correctly represents the variation of acceleration with displacement?
View SolutionThe graph that represents variation of g with height (h) from the surface of the earth is
View SolutionThe graph that represents variation of g with depth (d) from the surface of the earth is
View SolutionThe graph that represents variation of g at the equator with square of angular velocity of rotation of earth is
View SolutionThe variation of g with height or depth (r ) is shown correctly by the graph in Fig .4.2 (where R is radius of the earth),
View SolutionWhich of the following graph shows the variation in the value of 'g' with increasing distance from the centre of the earth. [Re = Radius of earth]
View SolutionThe velocity -displacement graph of a particle is as shown in the figure. Which of the following graphs correctly represents the variation of acceleration with displacement?

View Solutionनिम्नलिखित में से कौन-सा ग्राफ सही रूप से पृथ्वी तल पर g के परिवर्तन को प्रदर्शित करता है?
View SolutionThe given graph shows the variation of velocity with displacement. Which one of the graph given below correctly represents the variation of acceleration with displacement :-
View Solution

