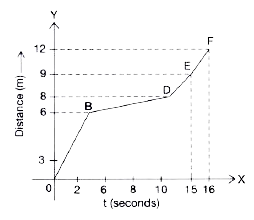
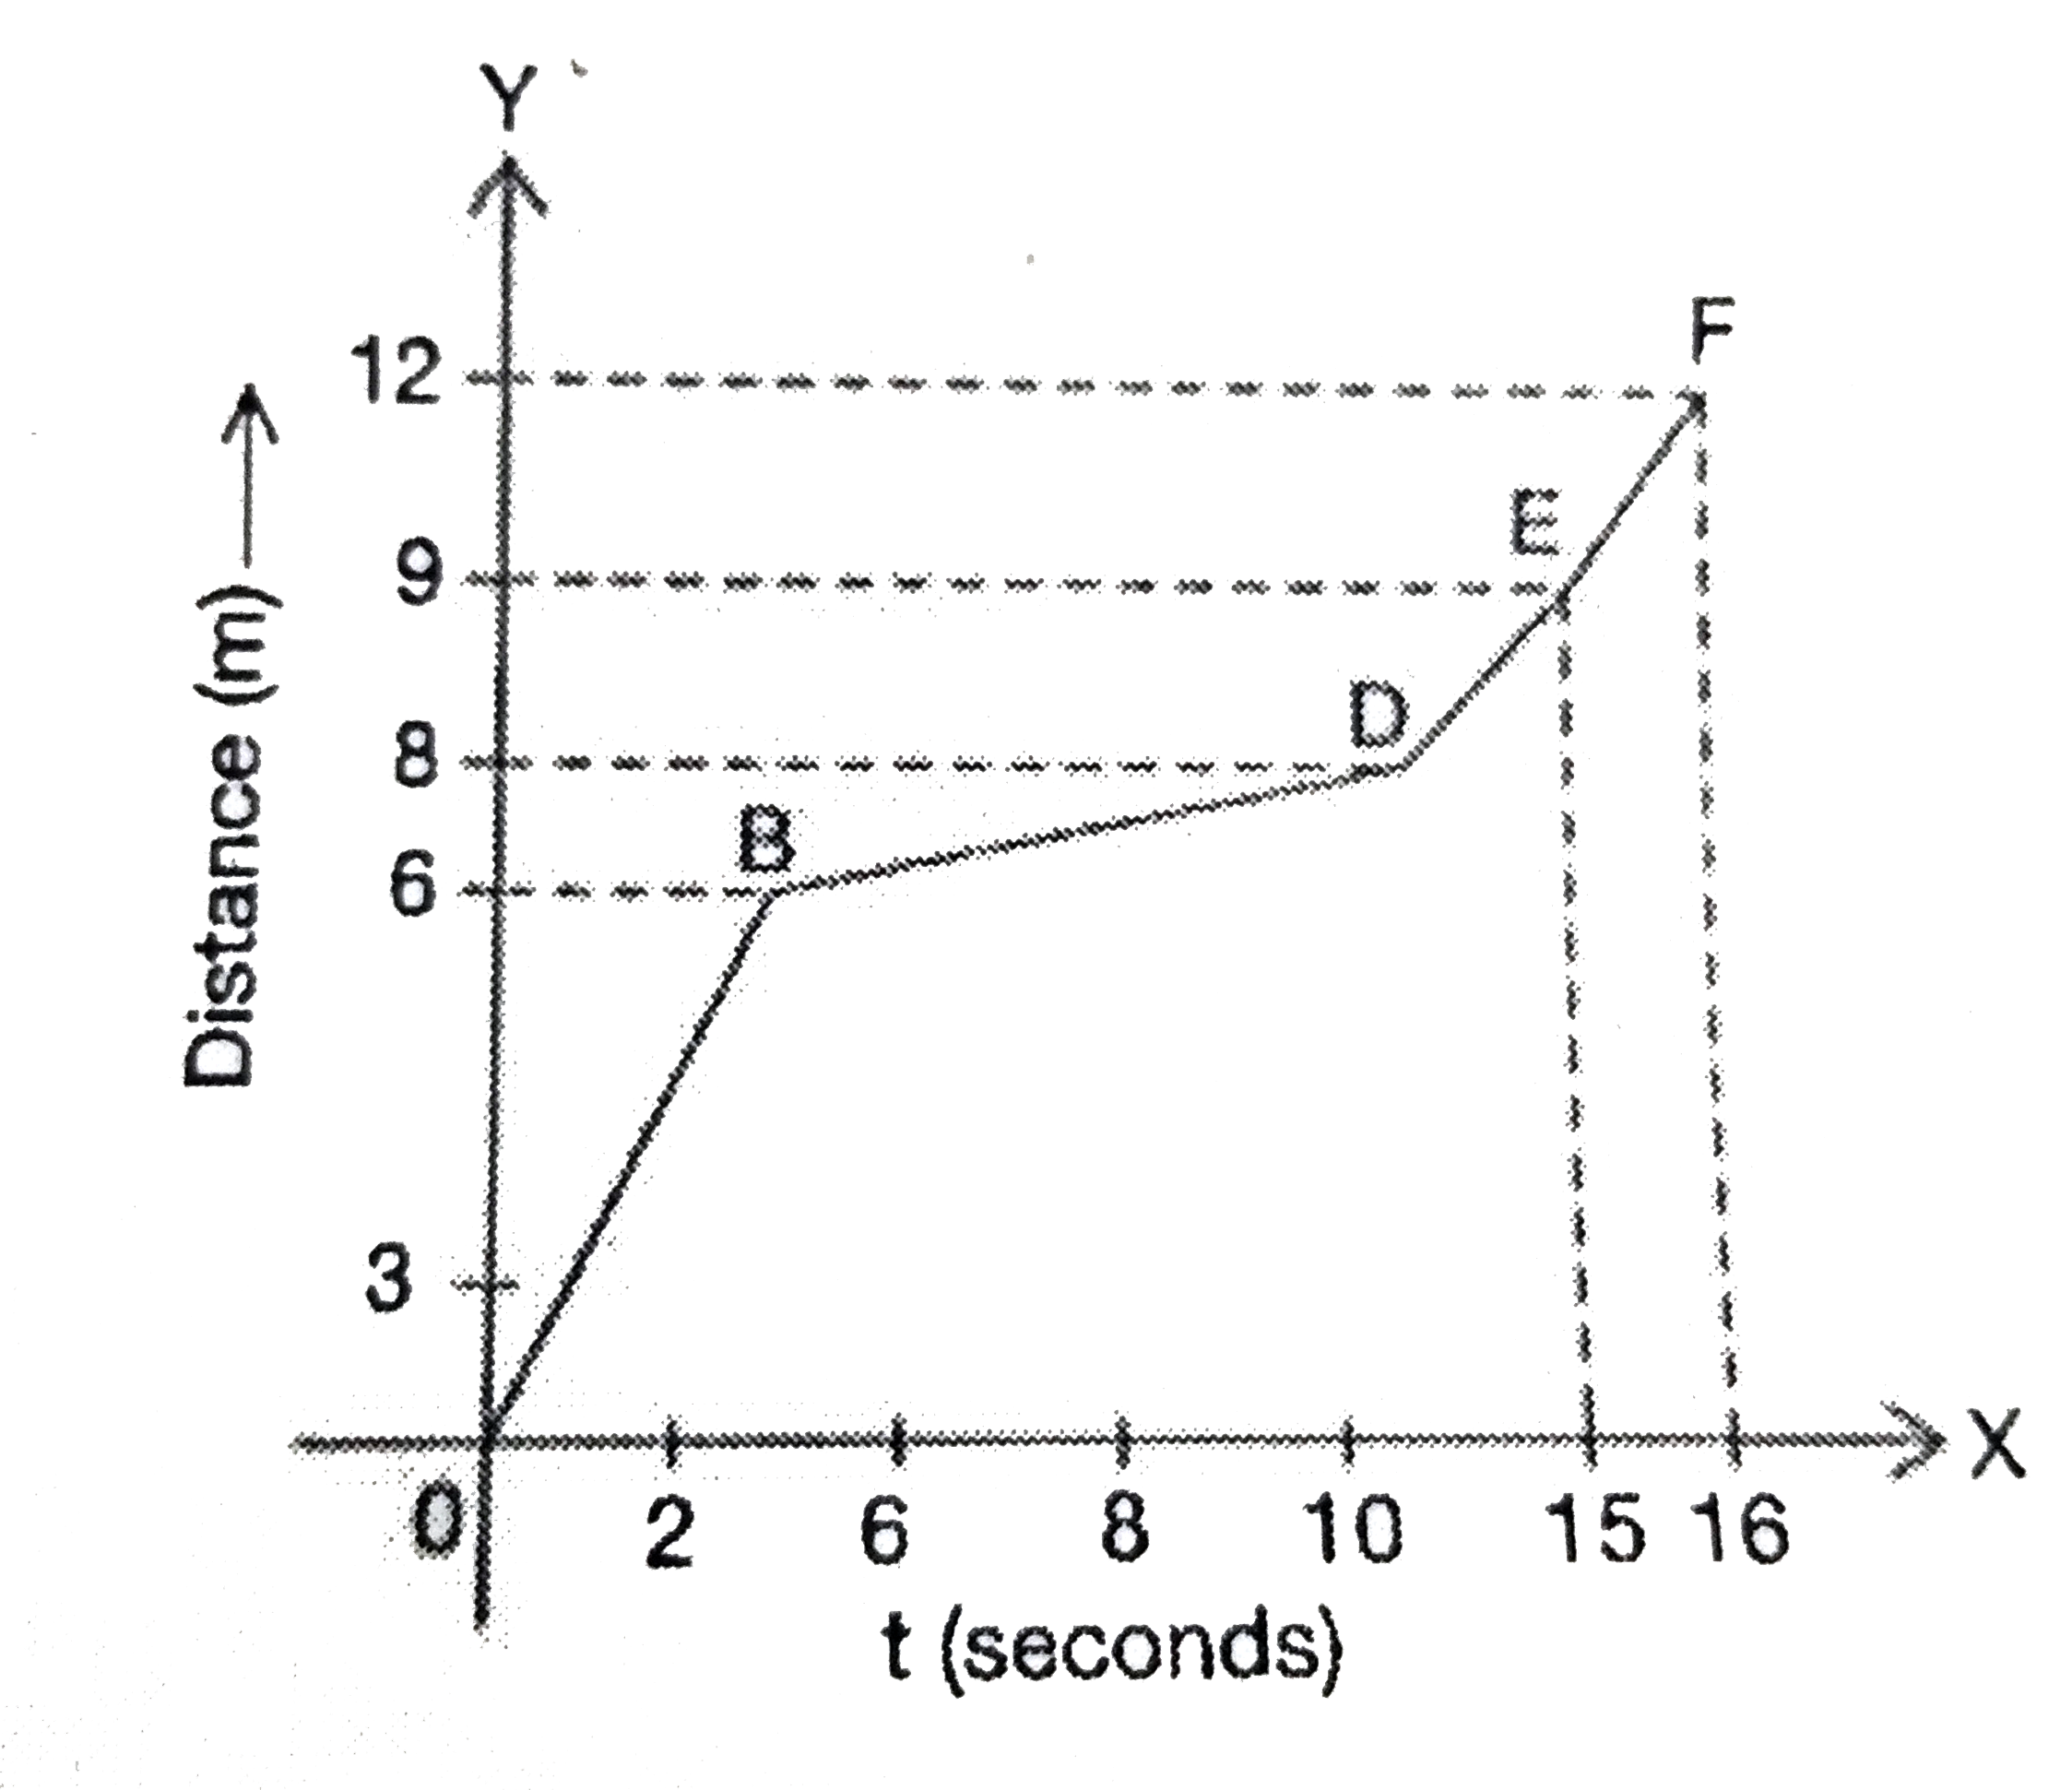
The motion of a body is depicted graphically as shown in the given figure. Then the average speed of the body is ______ m−1
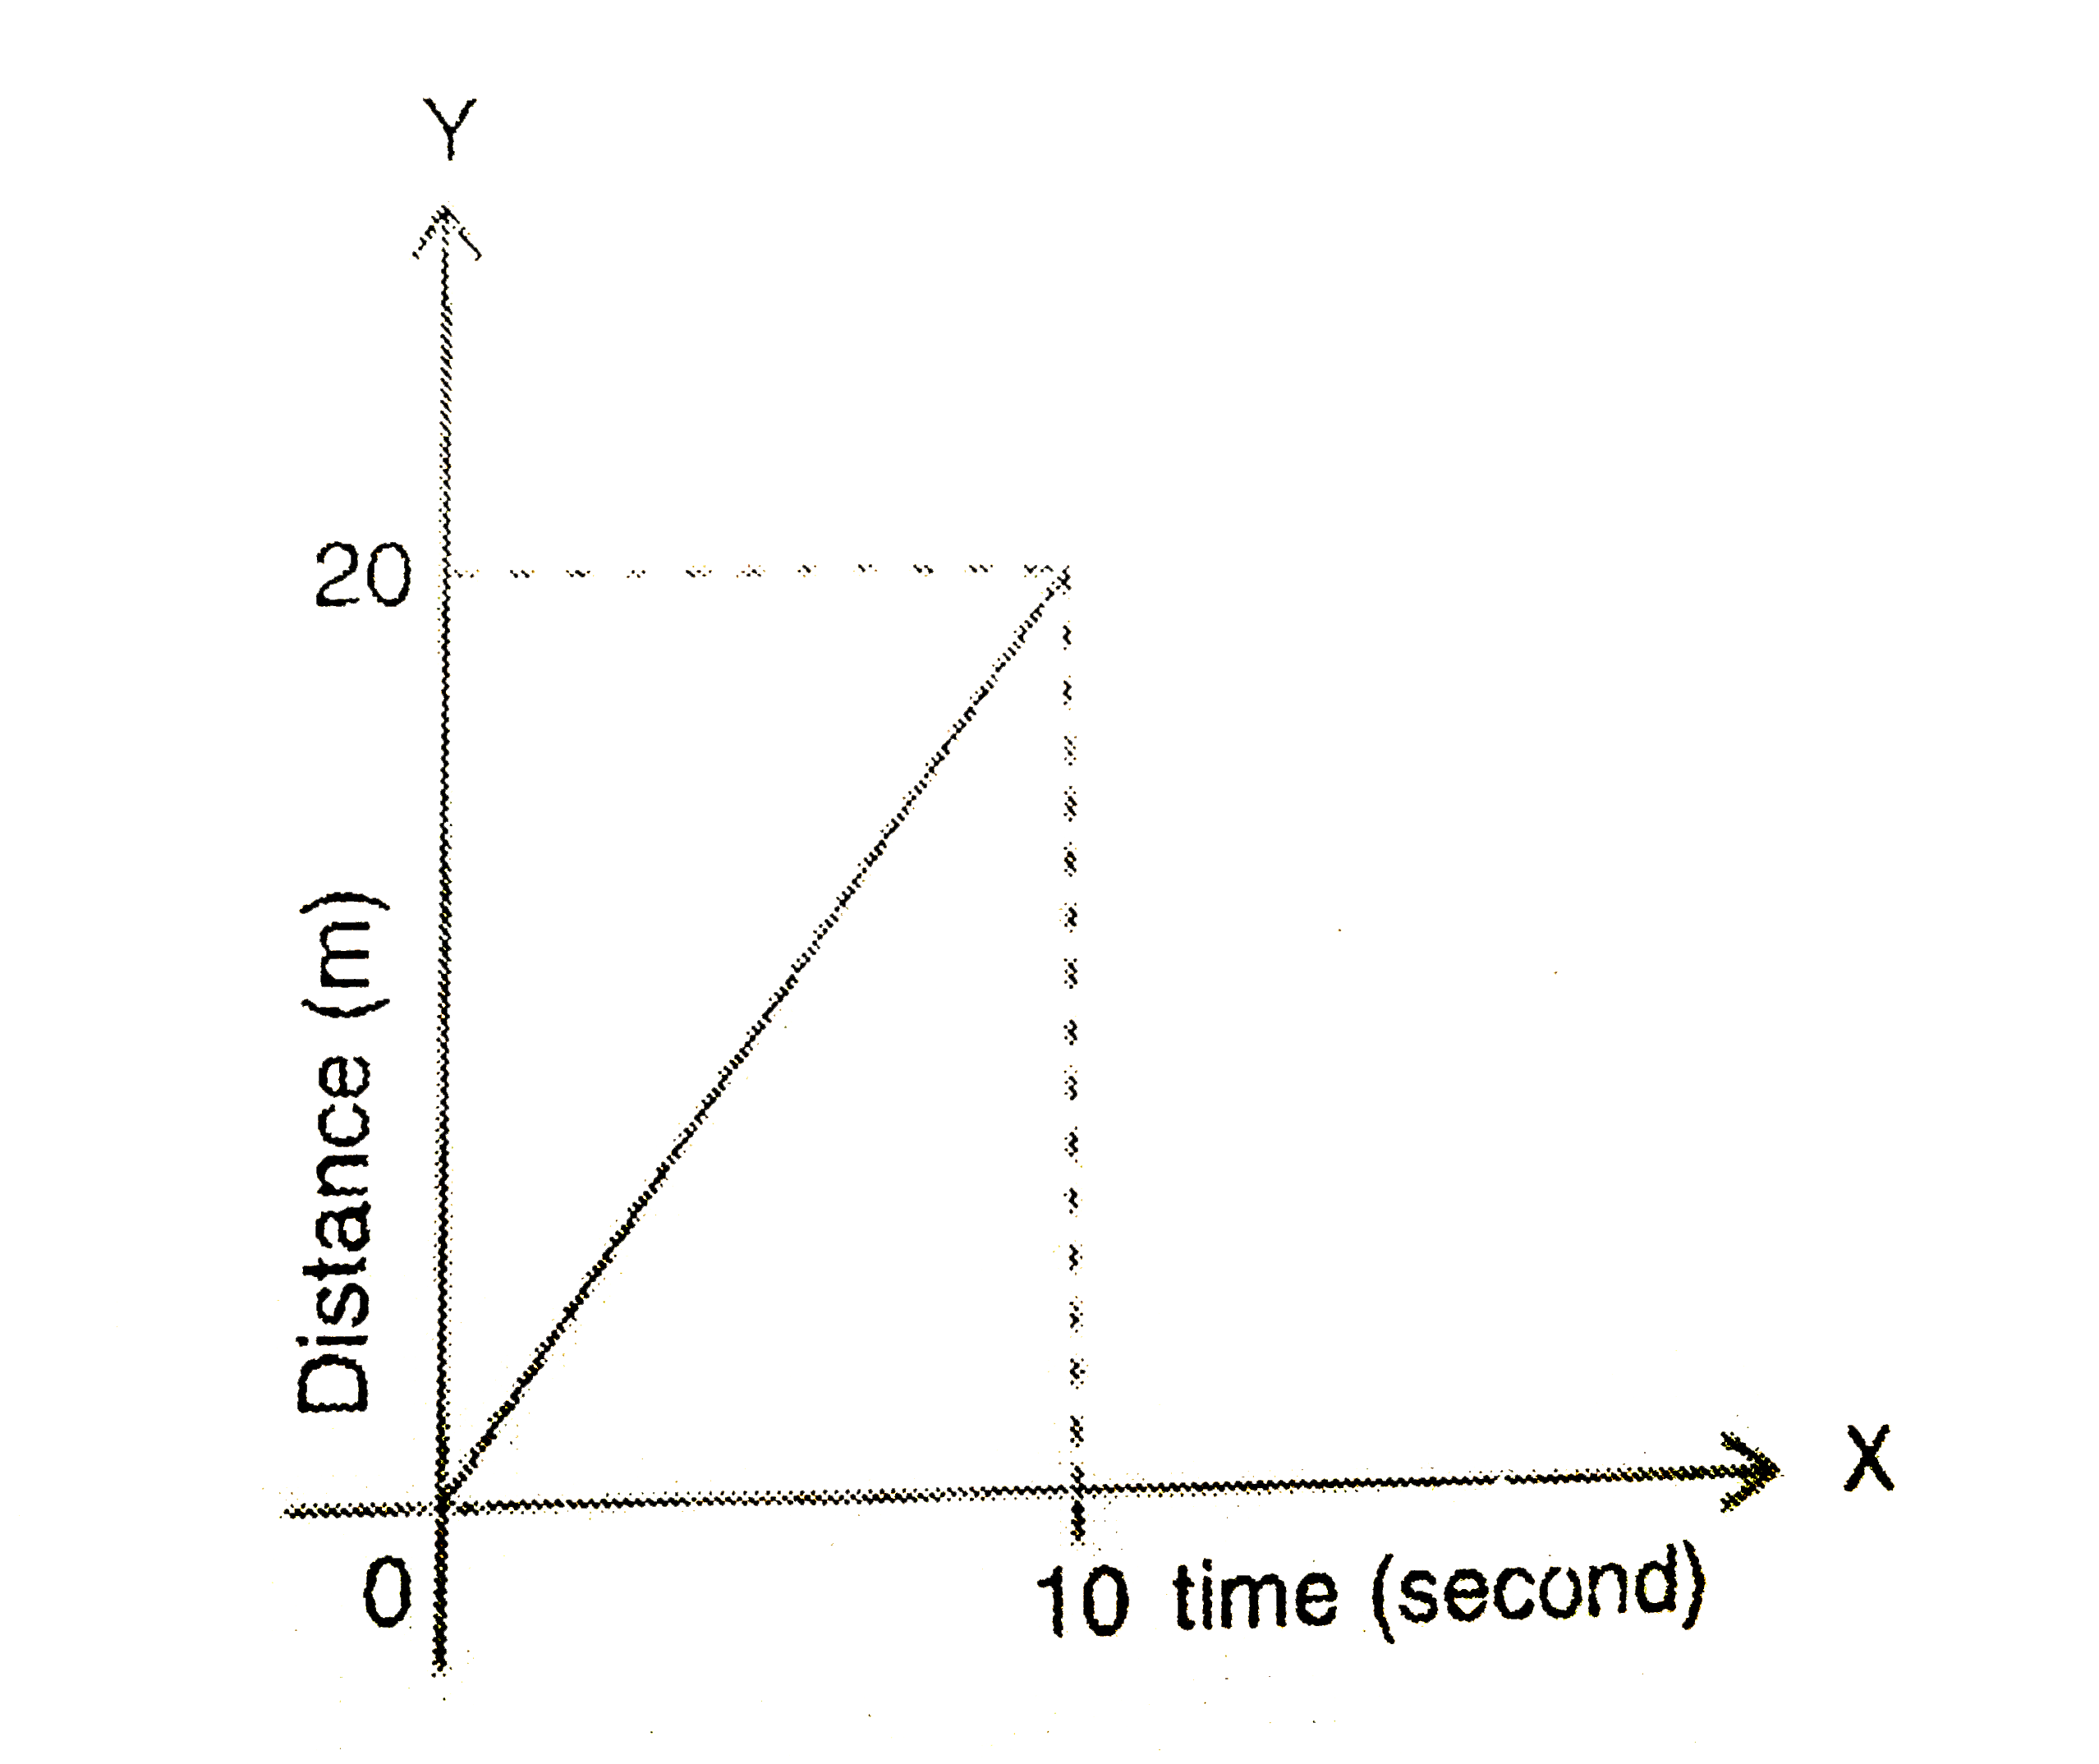
A
2
B
zero
C
200
D
20
Video Solution
Text Solution
The correct Answer is:A
Let the distance between A and B be x m.
The velocity during its first half of the journey = 72 km h−1
72×5/18ms−1
20ms−1 ,
 ltbr> The velocity during is second half of the journey= 36 km h−1
36×5/18ms−1
10ms−1
The time taken to travel the first half of the distance
t1=x/220=x40s
Similarly, the time taken to travel the second half of the distance = (t2)=x/210=x20s
The total time taken (T)=t1+t2
(x40+x20)s
=(x+2x40)s=3x40s
Average veiocity = total displacmenttotal time taken
(x3x/40)ms−1=403ms−1
13.33ms−1
13.¯3ms−1
|
Topper's Solved these Questions
- KINEMATICSBook:PEARSON IIT JEE FOUNDATIONChapter:KINEMATICSExercise:match
Explore 3 Videos
- KINEMATICSBook:PEARSON IIT JEE FOUNDATIONChapter:KINEMATICSExercise:Level 1
Explore 18 Videos
- KINEMATICSBook:PEARSON IIT JEE FOUNDATIONChapter:KINEMATICSExercise:ASSESSMENT TEST (TEST 2 (SELECT THE CORRECT ALTERNATIVE)
Explore 15 Videos
- HEAT Book:PEARSON IIT JEE FOUNDATIONChapter:HEAT Exercise:Test 2
Explore 14 Videos
- LIGHTBook:PEARSON IIT JEE FOUNDATIONChapter:LIGHTExercise:ASSESSMENT TEST (TEST 2 (SELECT THE CORRECT ALTERNATIVE))
Explore 15 Videos
Similar Questions
Knowledge Check
The motion of a body is depicted graphically as shown in the given figure. Then
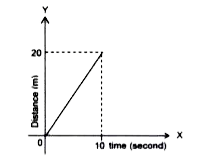 A2BzeroC200D20
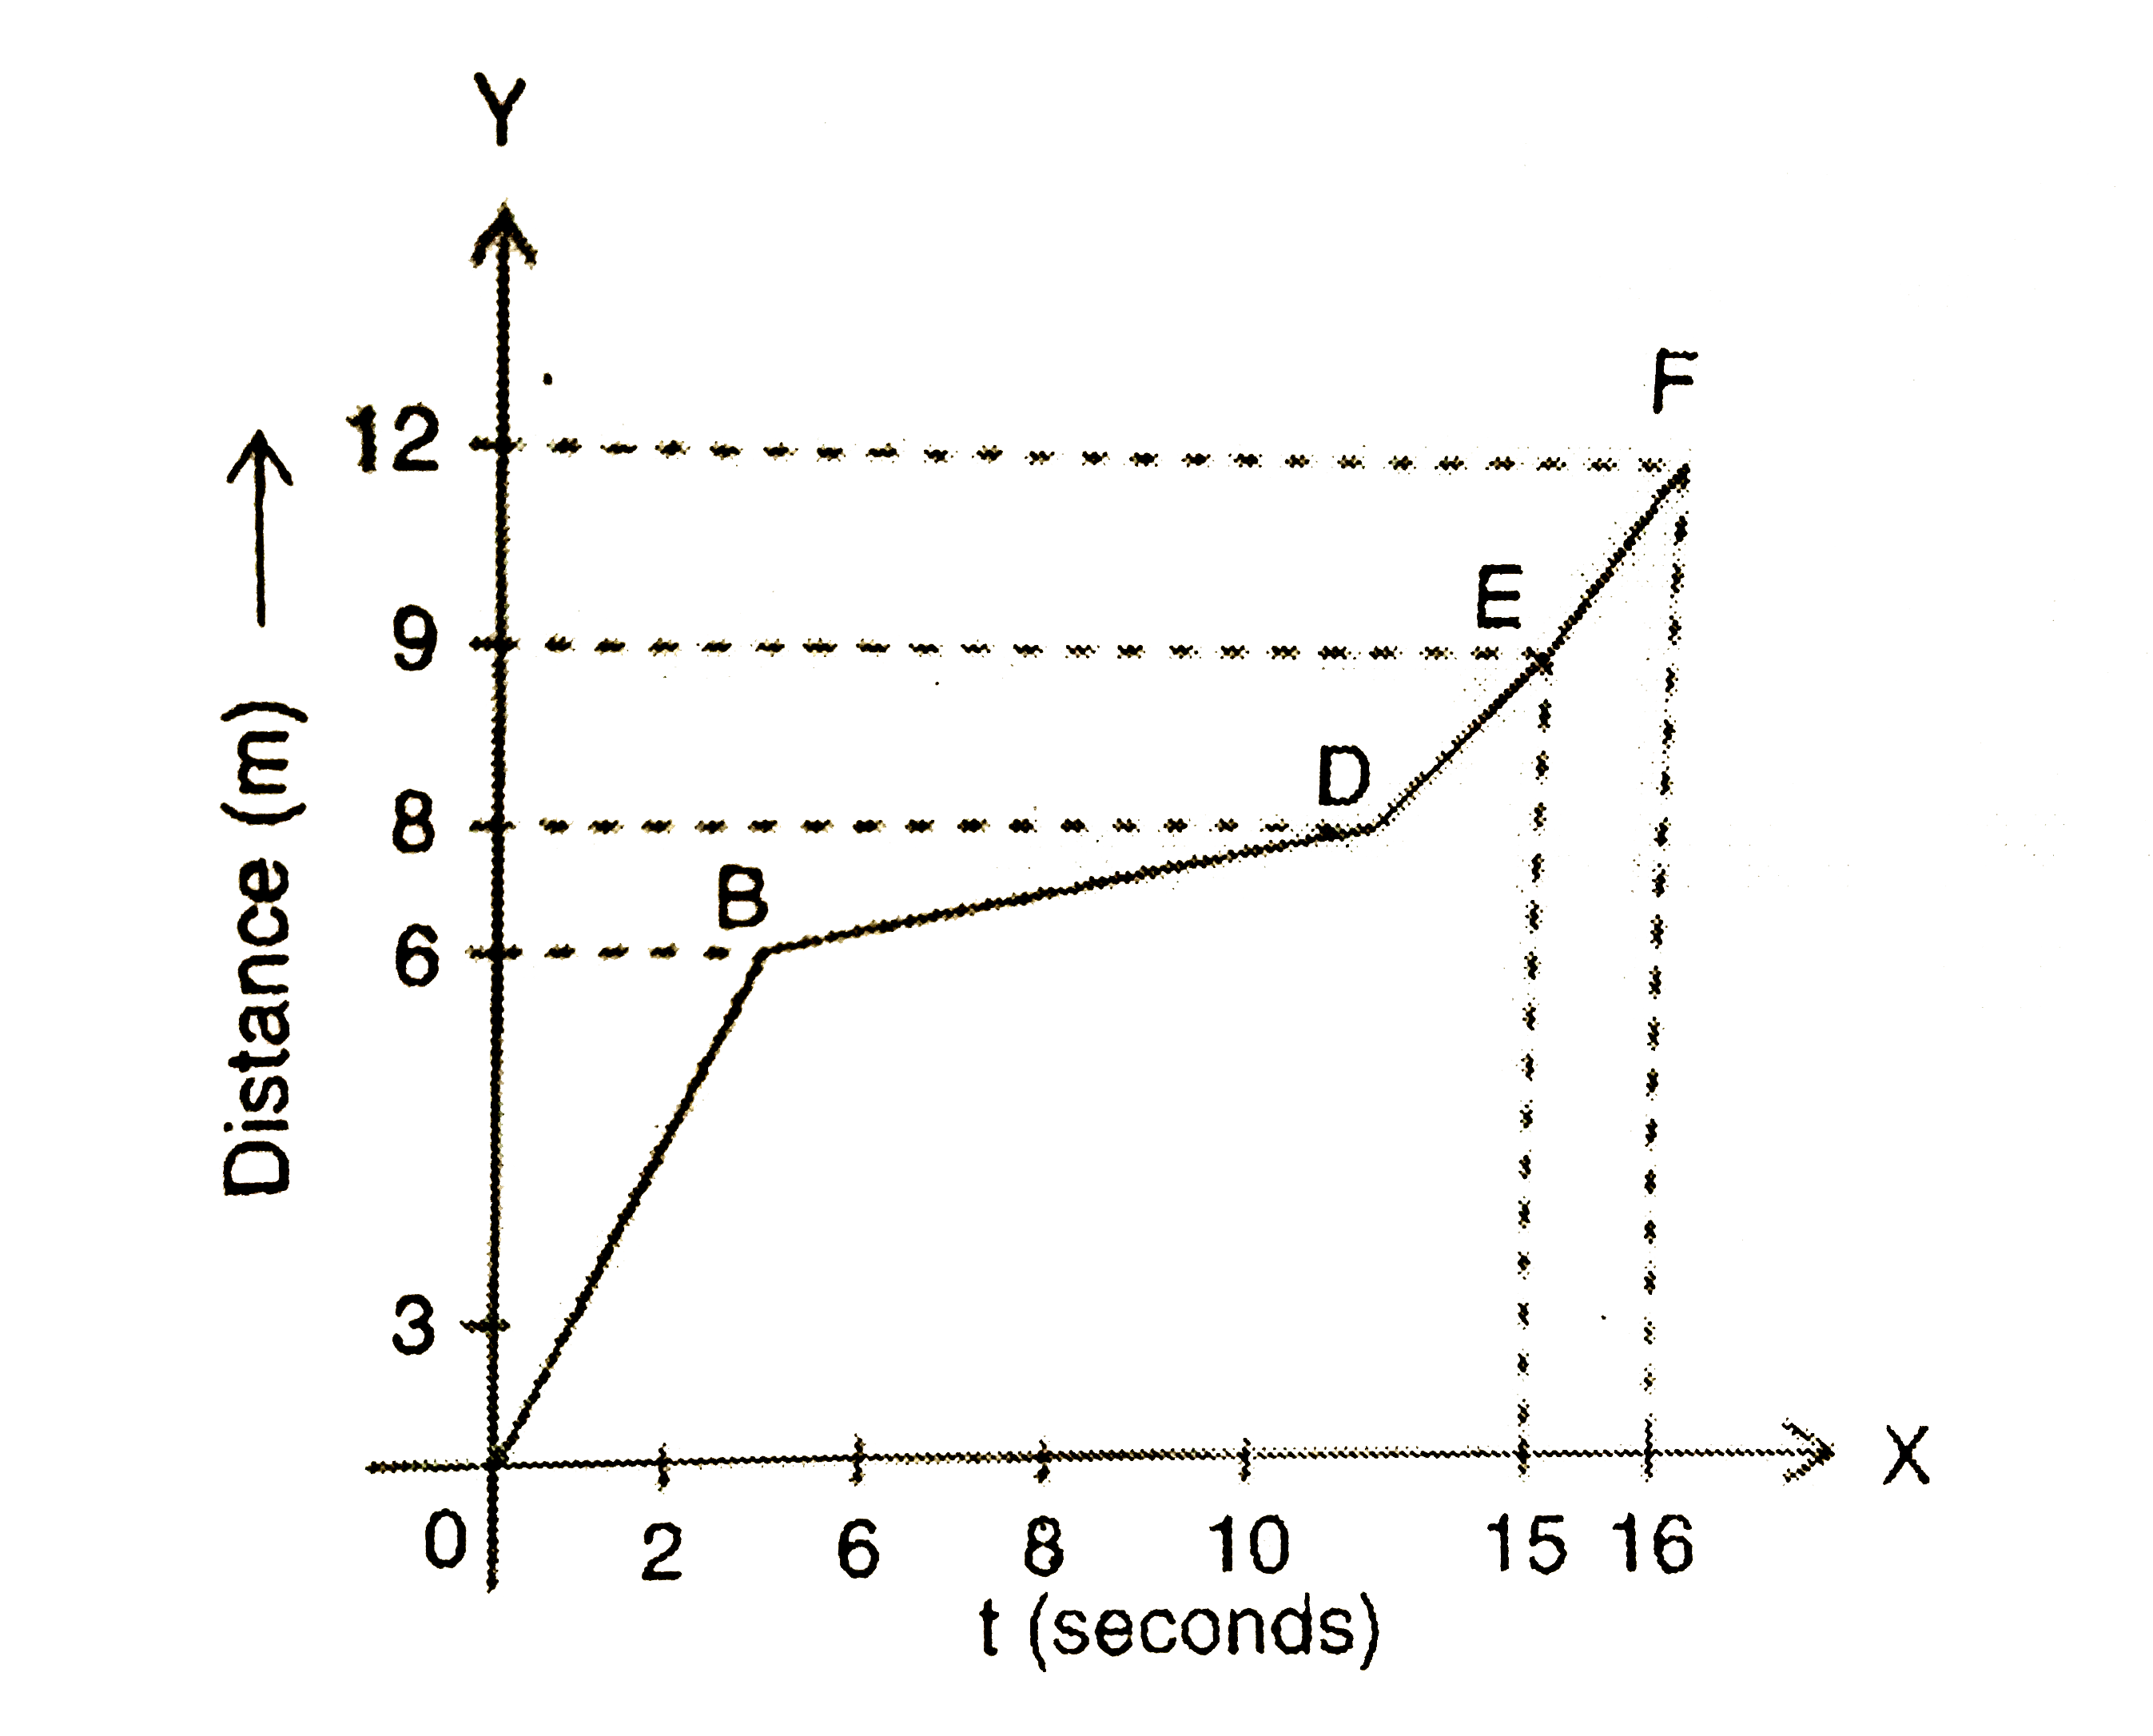
The motion of a body is depicted graphically as shown in the figure, then the average speed of the body is _____ ms−1.
 A34B98C43D89
The motion of a body is depicted graphically as shown in the figure, then the average speed of the body is _____ ms−1.
 A34B98C43D89
Motion of a body is depicted graphically as shown in the figure. The average speed of the body is ________ ms−1
View SolutionA body travels 10 m in 2s then the speed of the body is _______ m s−1.
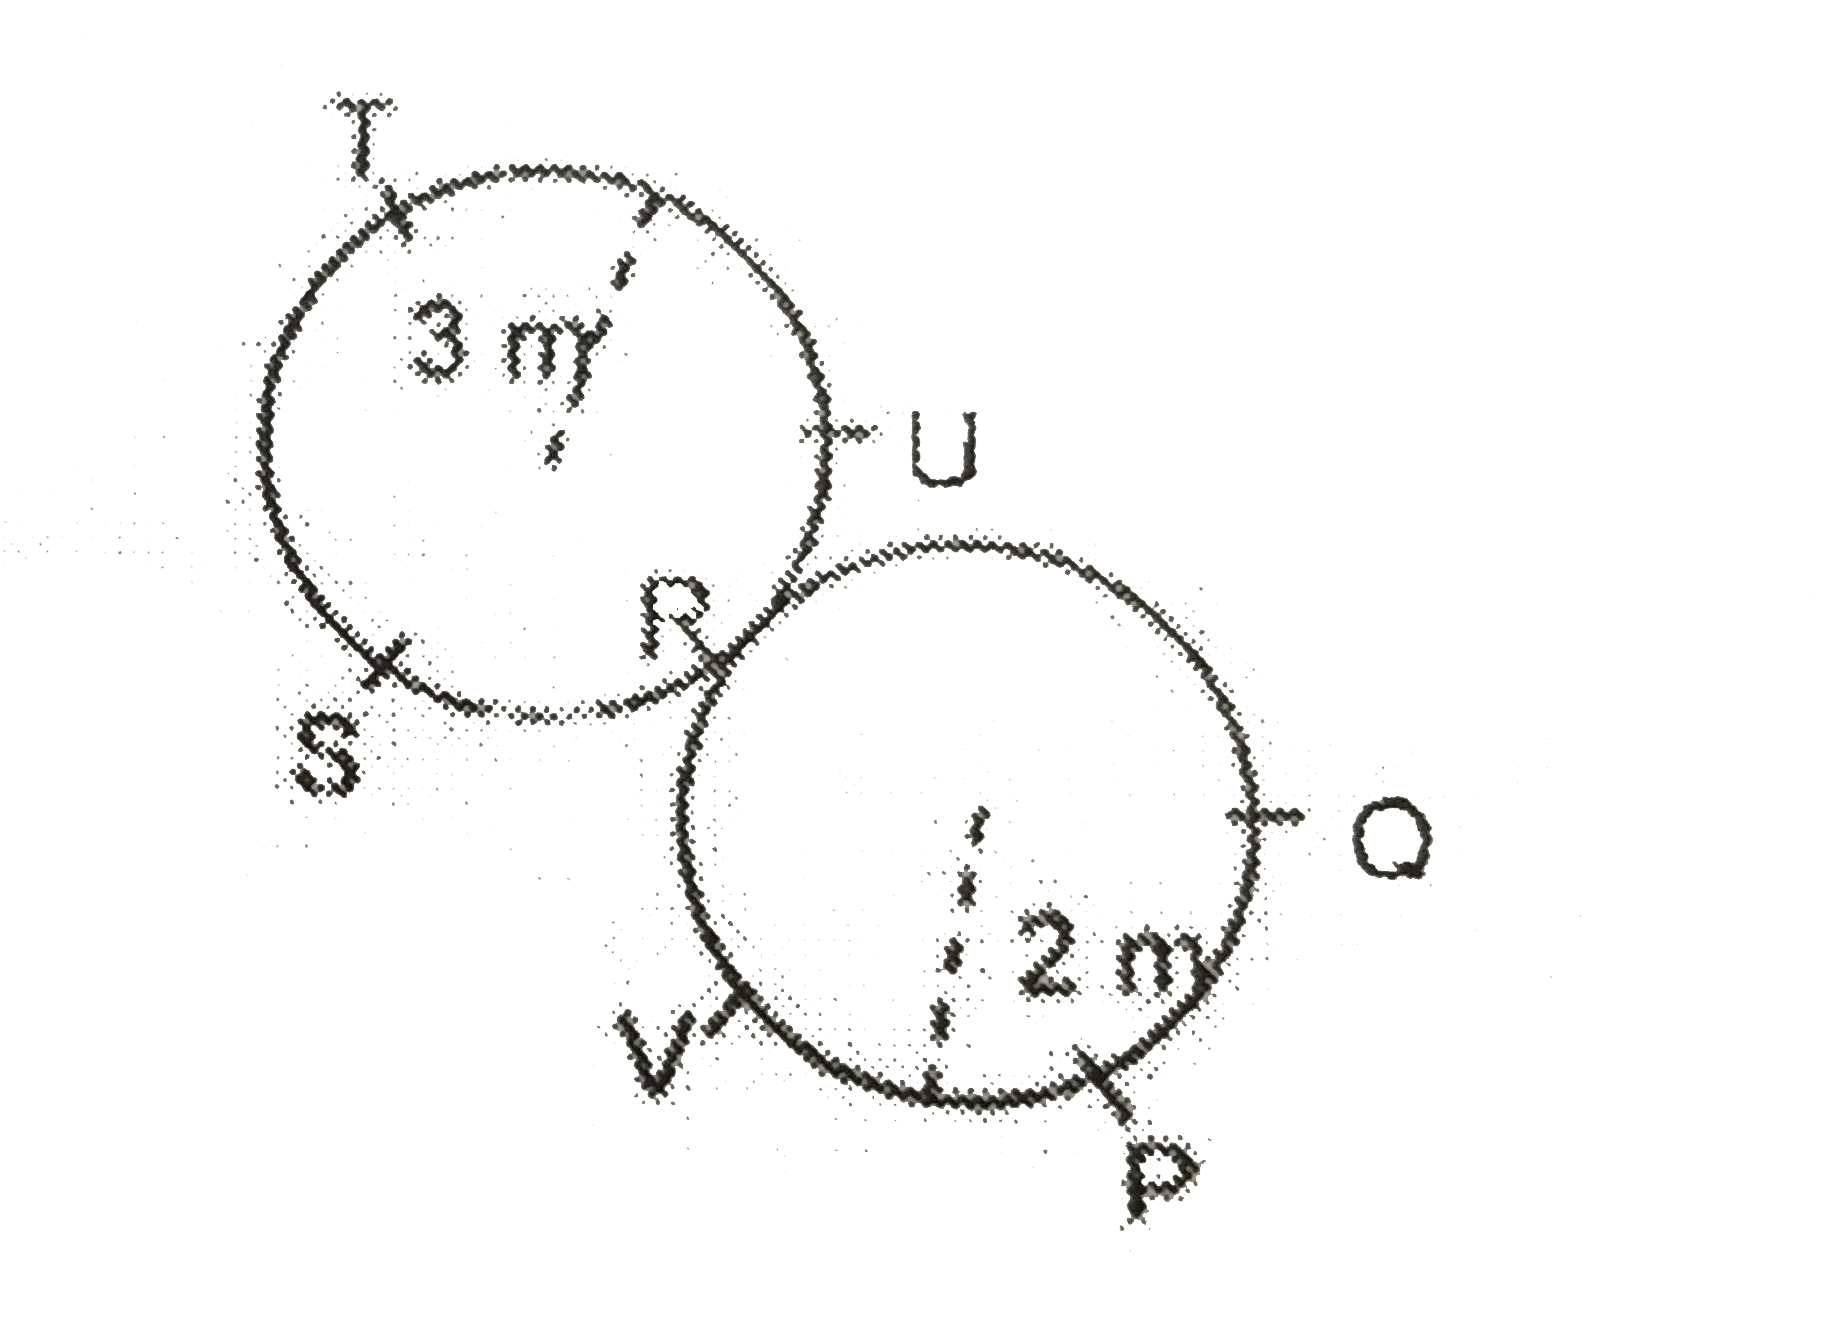
View SolutionAn athelete moves along a path PQRSTUVP, in 44 seconds as shown in the figure, then the average speed of the athlete is ______ ms−1
View SolutionA body travels 10 m in 2s then the speed of the body is _____ ms−1 .
View SolutionA body moves with a uniform speed of 10 km h−1 for 2 h. The average speed of the body is ______ km h−1.
View Solution

