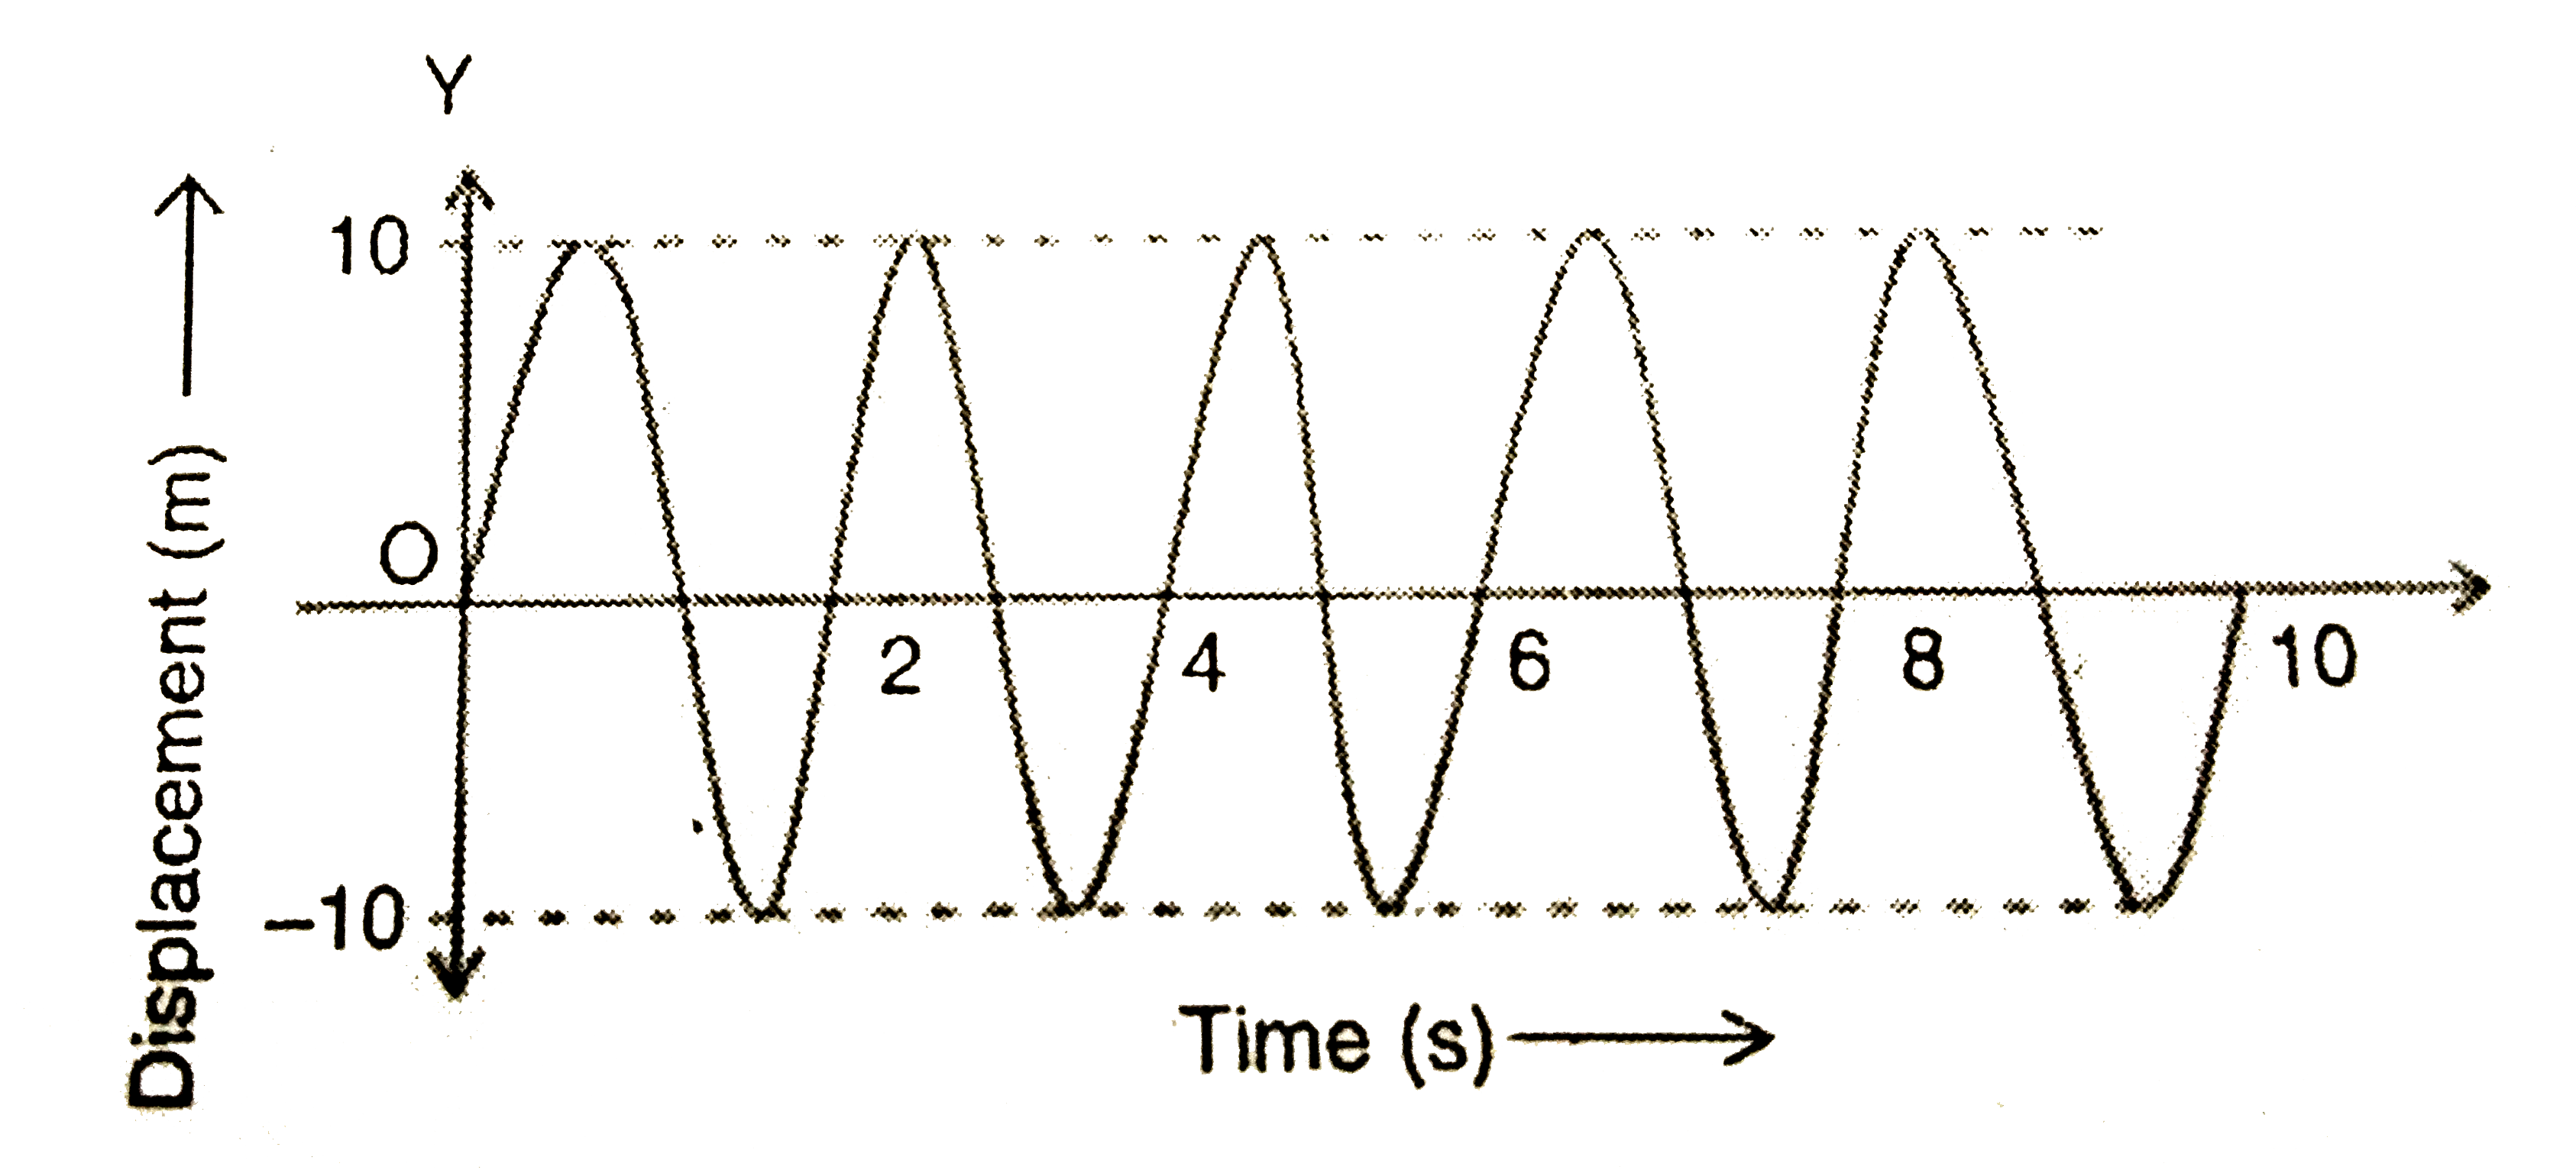
A graph is drawn between the displacement and time taken for the oscillations of a simple pendulum. The length of the penddulum is _______ m ( if g = 10 s−2andπ2=10)
2
1
0.5
0.25
The correct Answer is:B
As the time period of oscillation is (T)=2s
T=2π√lg
T2=4π2lg
lgT24π2=10×44×10=1m
Topper's Solved these Questions
- KINEMATICSBook:PEARSON IIT JEE FOUNDATIONChapter:KINEMATICSExercise:Level 2
Explore 18 Videos
- KINEMATICSBook:PEARSON IIT JEE FOUNDATIONChapter:KINEMATICSExercise:Level 3
Explore 6 Videos
- KINEMATICSBook:PEARSON IIT JEE FOUNDATIONChapter:KINEMATICSExercise:Level 1 macth
Explore 3 Videos
- HEAT Book:PEARSON IIT JEE FOUNDATIONChapter:HEAT Exercise:Test 2
Explore 14 Videos
- LIGHTBook:PEARSON IIT JEE FOUNDATIONChapter:LIGHTExercise:ASSESSMENT TEST (TEST 2 (SELECT THE CORRECT ALTERNATIVE))
Explore 15 Videos
Similar Questions
Knowledge Check
A graph is drawn between the displacement and time taken for the oscillations of a simple pendulum is 2s. The length of the penddulum is _______ m ( if g = 10 s−2andπ2=10)
A2B1C0.5D0.25A graph is drawn between the displacement and time taken for the oscillations of a simple pendulum.find the no of oscillation?
 A2B1C0.5D0.25
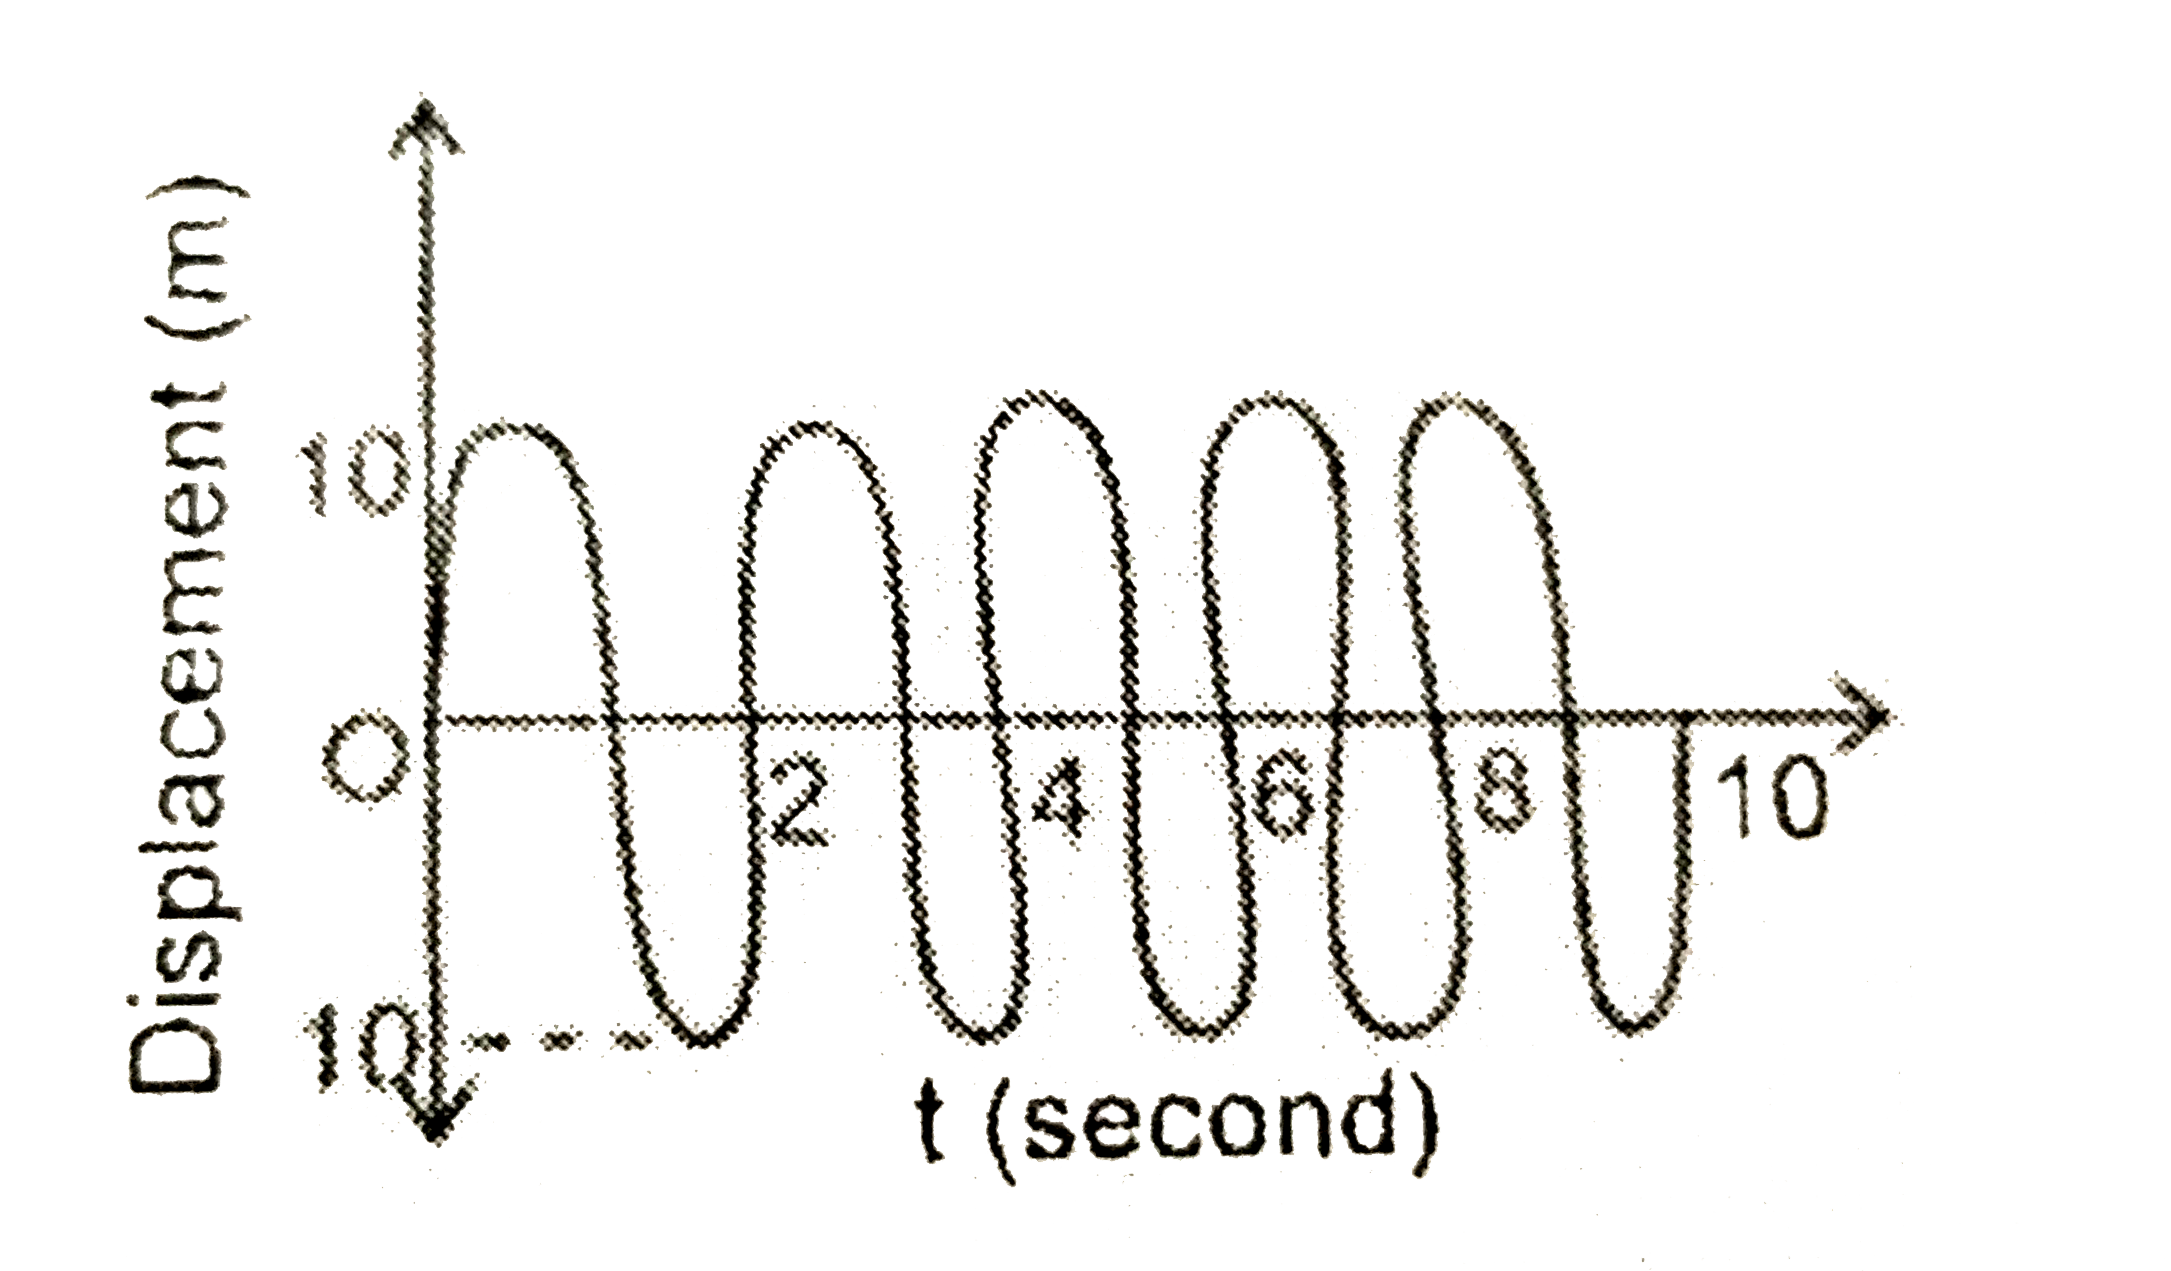
A graph is drawn between the displacement and time taken for the oscillations of a simple pendulum.find the no of oscillation?
 A0.5B2 hC50D100
The time taken to complete 100 oscillations is ______ s.

View SolutionA graph is drawn between the displacement and time taken for the oscillations of a simple pendulum.find the no of oscillation?

View SolutionA graph is drawn between the displacement and time taken for the oscillations of a simple pendulum.find the no of oscillation?

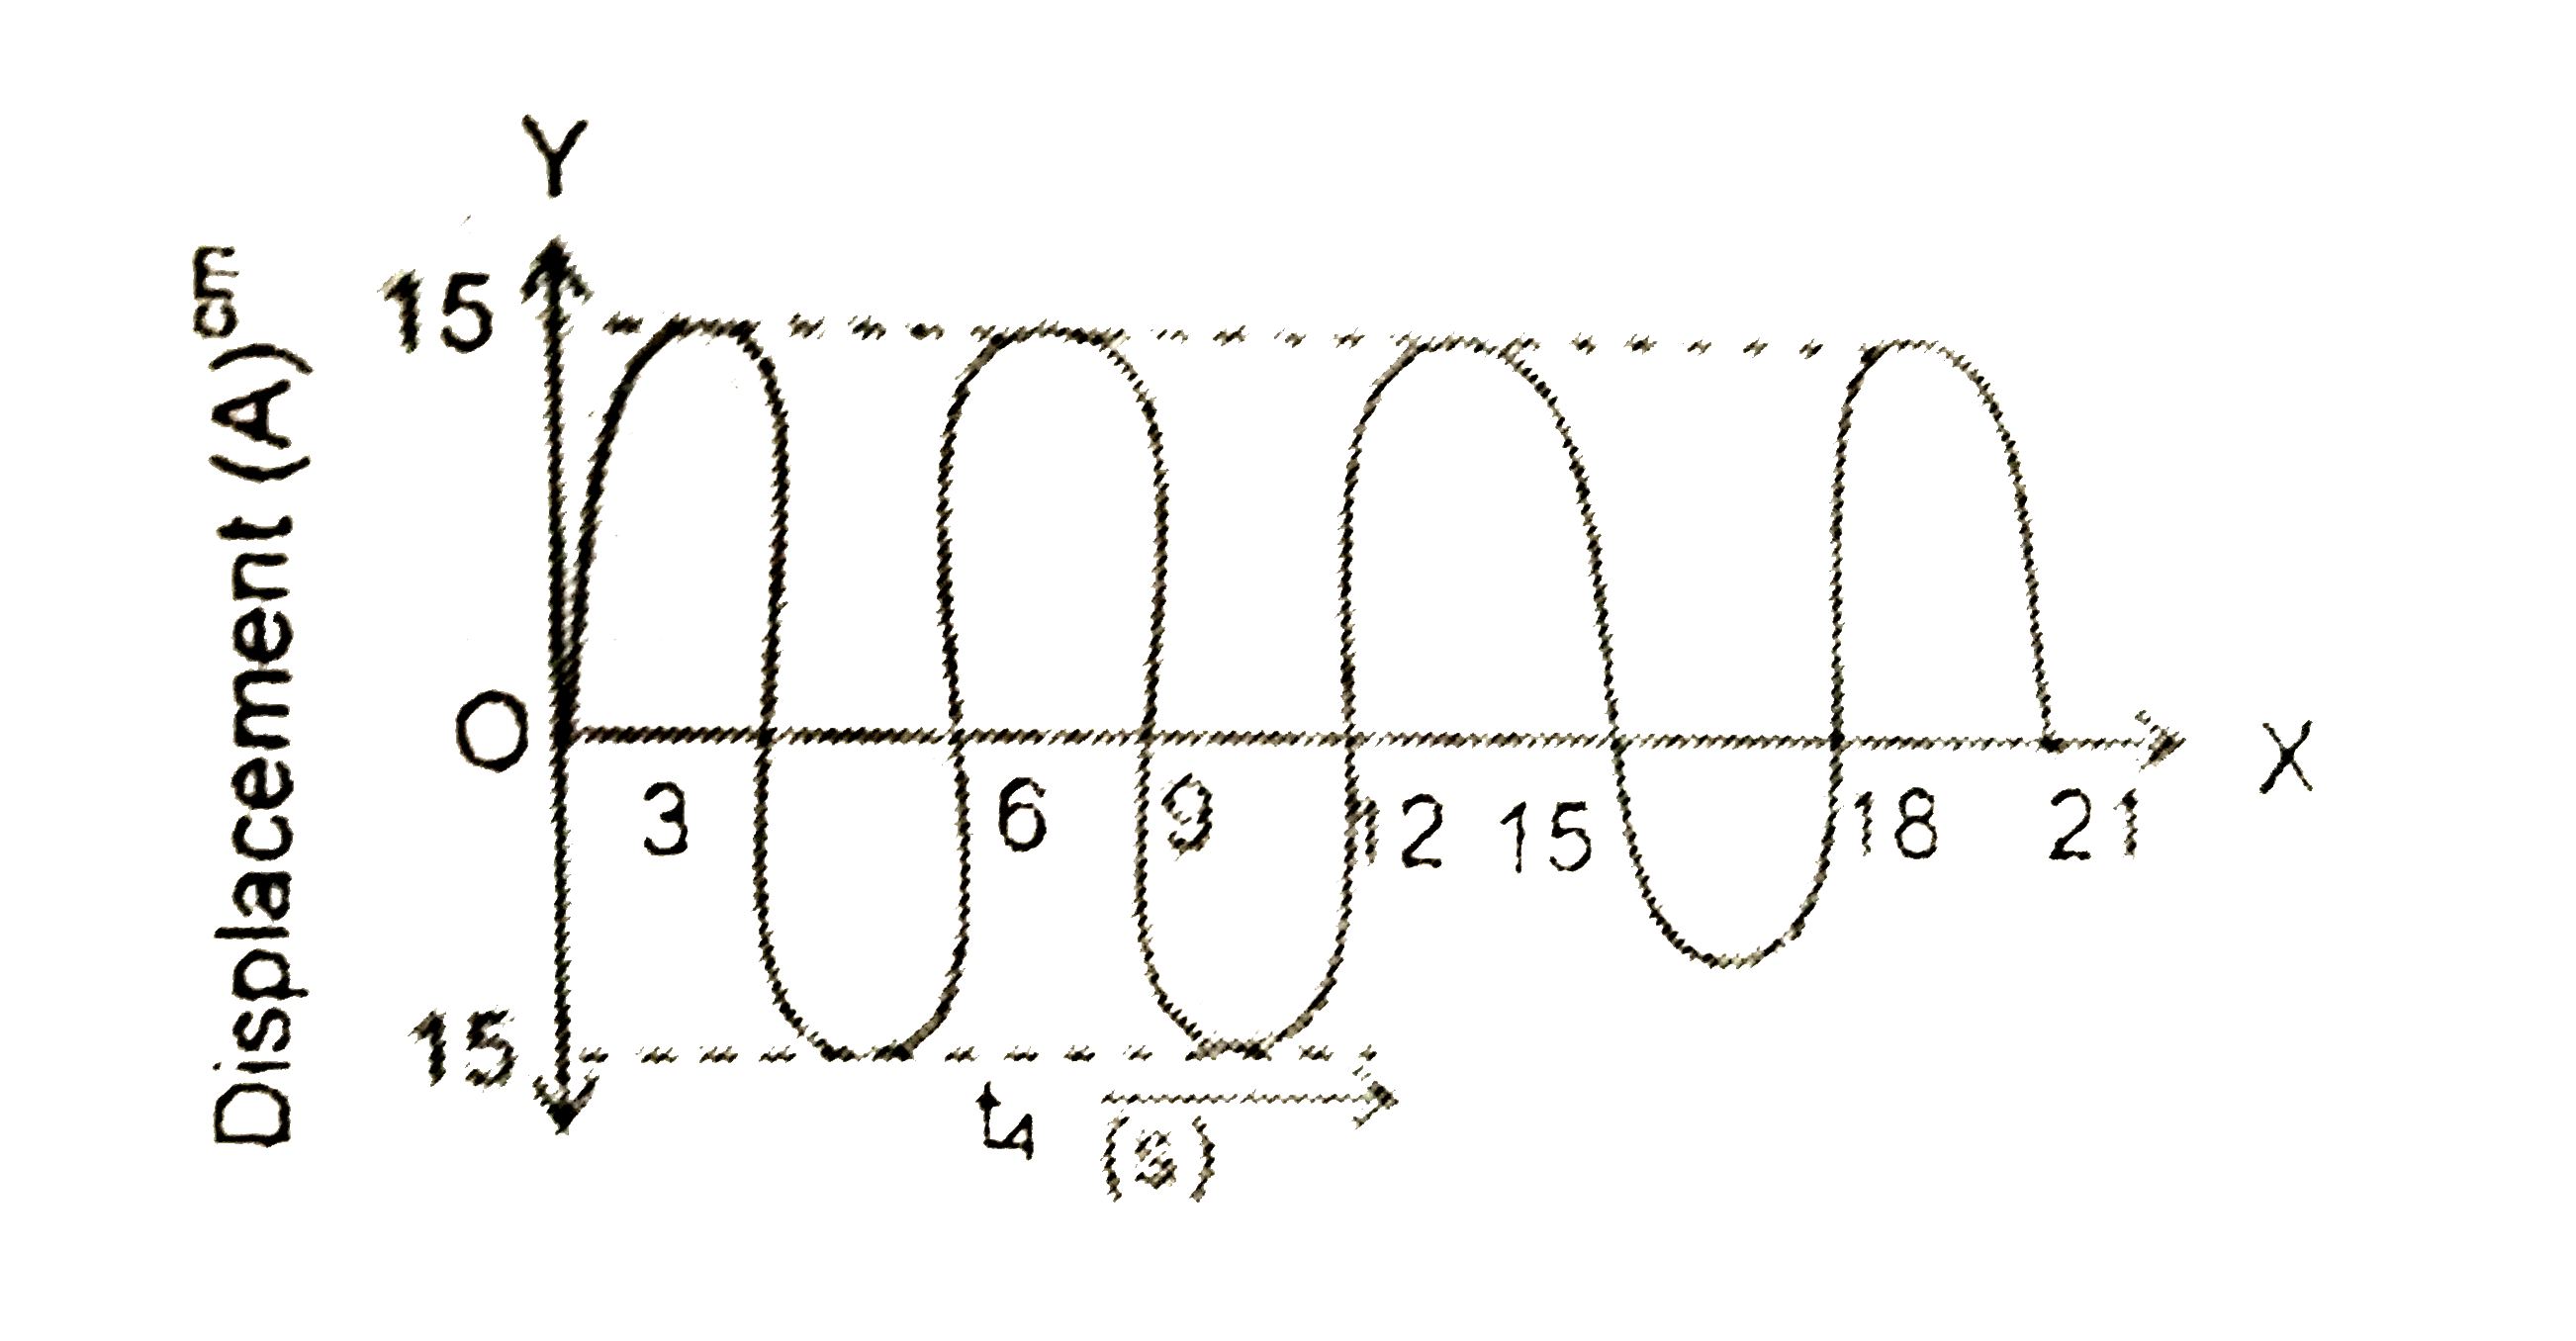
View SolutionIn the case of a simple pendulum, a graph is drawn between the displacement and time taken for its oscillations as shown in the figure. Then

Time period of the pendulum bob is ______ s.
View SolutionIn the case of a simple pedulum a fraoh is drawn between th displacement and time taken for its oscillations as shown in the figure then.
Time period of the pendulum bob is ______

View Solution
