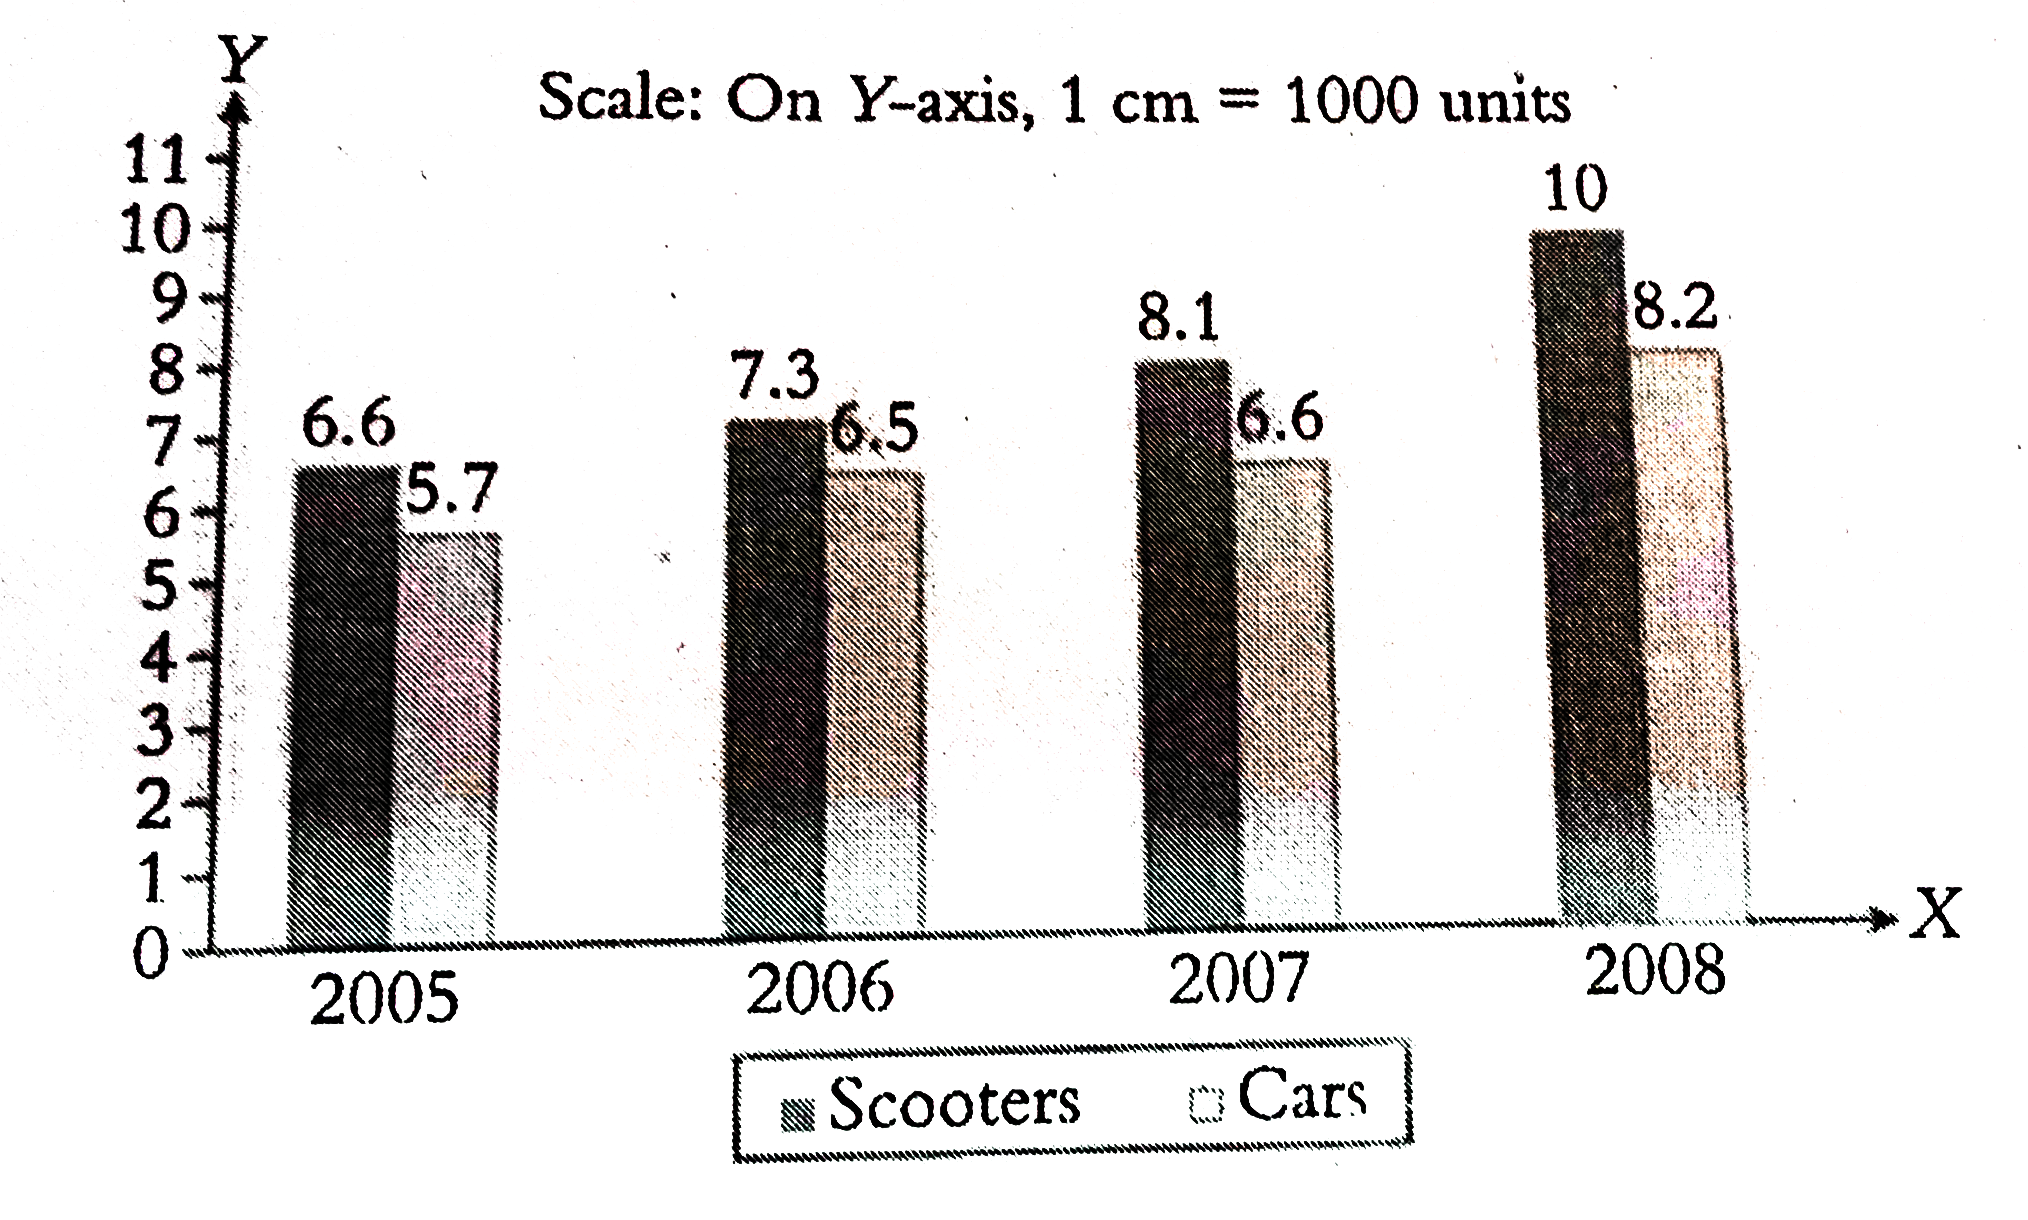
Find the total number of scooters sold in the four years.
26000
27000
31000
32000
The correct Answer is:D
Step by step video, text & image solution for Find the total number of scooters sold in the four years. by Maths experts to help you in doubts & scoring excellent marks in Class 7 exams.
Updated on:21/07/2023Topper's Solved these Questions
- STATISTICSBOOK - PEARSON IIT JEE FOUNDATIONCHAPTER - STATISTICSEXERCISE - Short Answer Type
21 Videos
- STATISTICSBOOK - PEARSON IIT JEE FOUNDATIONCHAPTER - STATISTICSEXERCISE - Essay Type
6 Videos
- STATISTICSBOOK - PEARSON IIT JEE FOUNDATIONCHAPTER - STATISTICSEXERCISE - CONCEPT APPLICATION (LEVEL 3)
11 Videos
- SIMPLE INTEREST AND COMPOUND INTEREST BOOK - PEARSON IIT JEE FOUNDATIONCHAPTER - SIMPLE INTEREST AND COMPOUND INTEREST EXERCISE - Level 3
9 Videos
Similar Questions
A book exhibition was held for four days in a school. The number of tickets sold at the counter on the first, second, third and final day was respectively 1094, 1812, 2050 and 2751. Find the total number of tickets sold on all the four days.
View SolutionA book exhibition was held for four days in a school. The number of tickets sold at the counter on the first, second, third and final days were respectively 1094, 1812, 2050 and 2751. Find the total number of tickets sold on all the four days.
View Solution
Knowledge Check
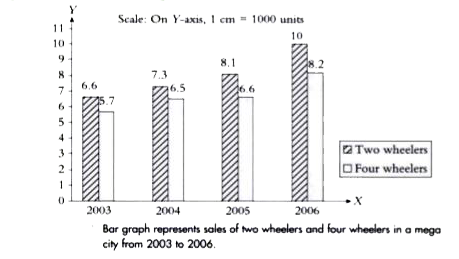
Find the total number of two wheelers sold in four years.A26000B27000C31000D32000Study the graph carefully and answer the following questions.
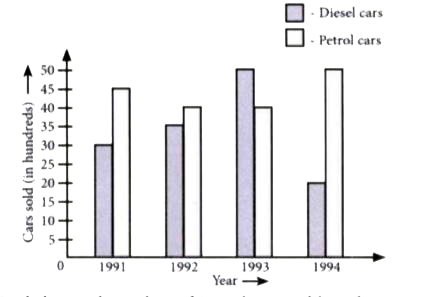
Find the total number of Diesel cars sold in the year 1992 and 1994 together.A2500B5500C1500D4500The bar chart given below shows the sales (in '000 units) of 4 mobile brands for 3 years.
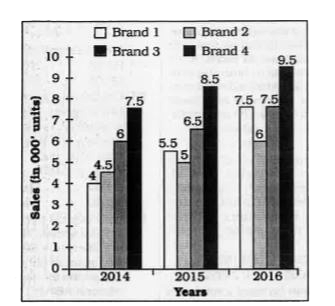
What is the percentage increase in the total number of mobiles sold by these four brands from 2014 to 2016?A42.16B38.63C32.43D30.16
A book exhibition was held for four days in a school. The number of tickets sold at the counter on the first, second, third and final days were respectively 1094, 1812, 2050 and 2751. Find the total number of tickets sold on all the four days.
View SolutionThe bar chart given below shows the sales (in '000 units) of 4 mobile brands for 3 years.
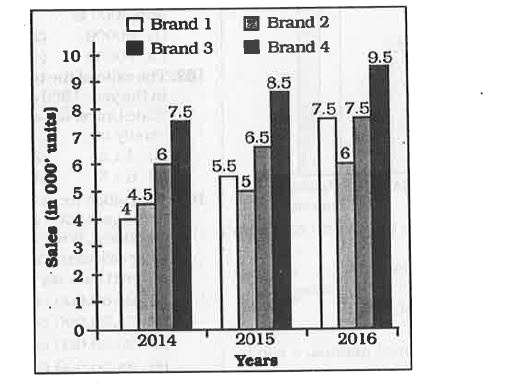
What is the percentage increase in the total number of mobiles sold by these four brands from 2014 to 2016?
View SolutionThe table shows the number of cars sold by three showrooms over a period of six year.
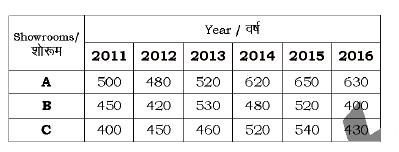
The total number of cars sold by all three showrooms over the years is represented as a pie chart, what is the central angle of the sector representing the total number of cars sold in the year 2013
View SolutionThe given table represents the number of computers sold by four dealers A,B, C and D during the first six months of 2016. Study the table carefully and answer the questions that follows:
दी गयी तालिका चार विक्रेताओं A, B, C और D के द्वारा 2016 के पहले छः महीनों में बेचे गए कंप्यूटरों की संख्या दर्शाती है | इस तालिका का ध्यानपूर्वक अध्ययन करें तथा पूछे गए प्रश्नों का उत्तर दें |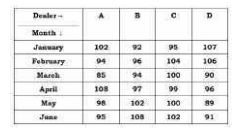 The total number of computers sold by dealer A during February to June is what percentage more
than the total number of computers sold by all the dealers in June?(Correct to one decimal place) /
फरवरी से जून के दौरान विक्रेता A के द्वारा बेचे गए कंप्यूटरों की कुल संख्या सभी विक्रेताओं के द्वारा जून में बेचे गए कंप्यूटरों की कुल संख्या से कितना प्रतिशत अधिक है ?
View Solution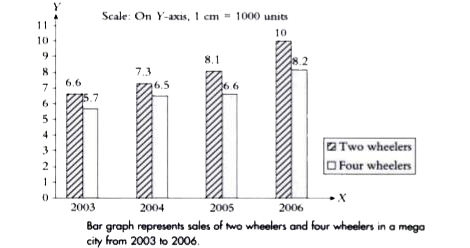
Find the ratio between number of vehicles sold in the year 2004 and in the year 2006.
View Solution
