The graphs drawn generally for representing a data are _______.
The correct Answer is:Pictograph, bar graph, double bar graph, ...
Step by step video, text & image solution for The graphs drawn generally for representing a data are _______. by Maths experts to help you in doubts & scoring excellent marks in Class 7 exams.
Updated on:21/07/2023Topper's Solved these Questions
- STATISTICSBOOK - PEARSON IIT JEE FOUNDATIONCHAPTER - STATISTICSEXERCISE - Short Answer Type
21 Videos
- STATISTICSBOOK - PEARSON IIT JEE FOUNDATIONCHAPTER - STATISTICSEXERCISE - Essay Type
6 Videos
- STATISTICSBOOK - PEARSON IIT JEE FOUNDATIONCHAPTER - STATISTICSEXERCISE - CONCEPT APPLICATION (LEVEL 3)
11 Videos
- SIMPLE INTEREST AND COMPOUND INTEREST BOOK - PEARSON IIT JEE FOUNDATIONCHAPTER - SIMPLE INTEREST AND COMPOUND INTEREST EXERCISE - Level 3
9 Videos
Similar Questions
Knowledge Check
Data is represented in a DBMS as______.
AFileBBinaryCRecordDtableA pie-diagram representing the following data is_____
 A
A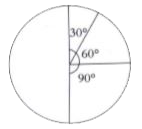 B
B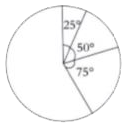 C
C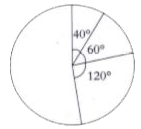 D
D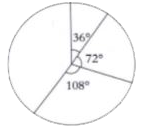
This graph represents:
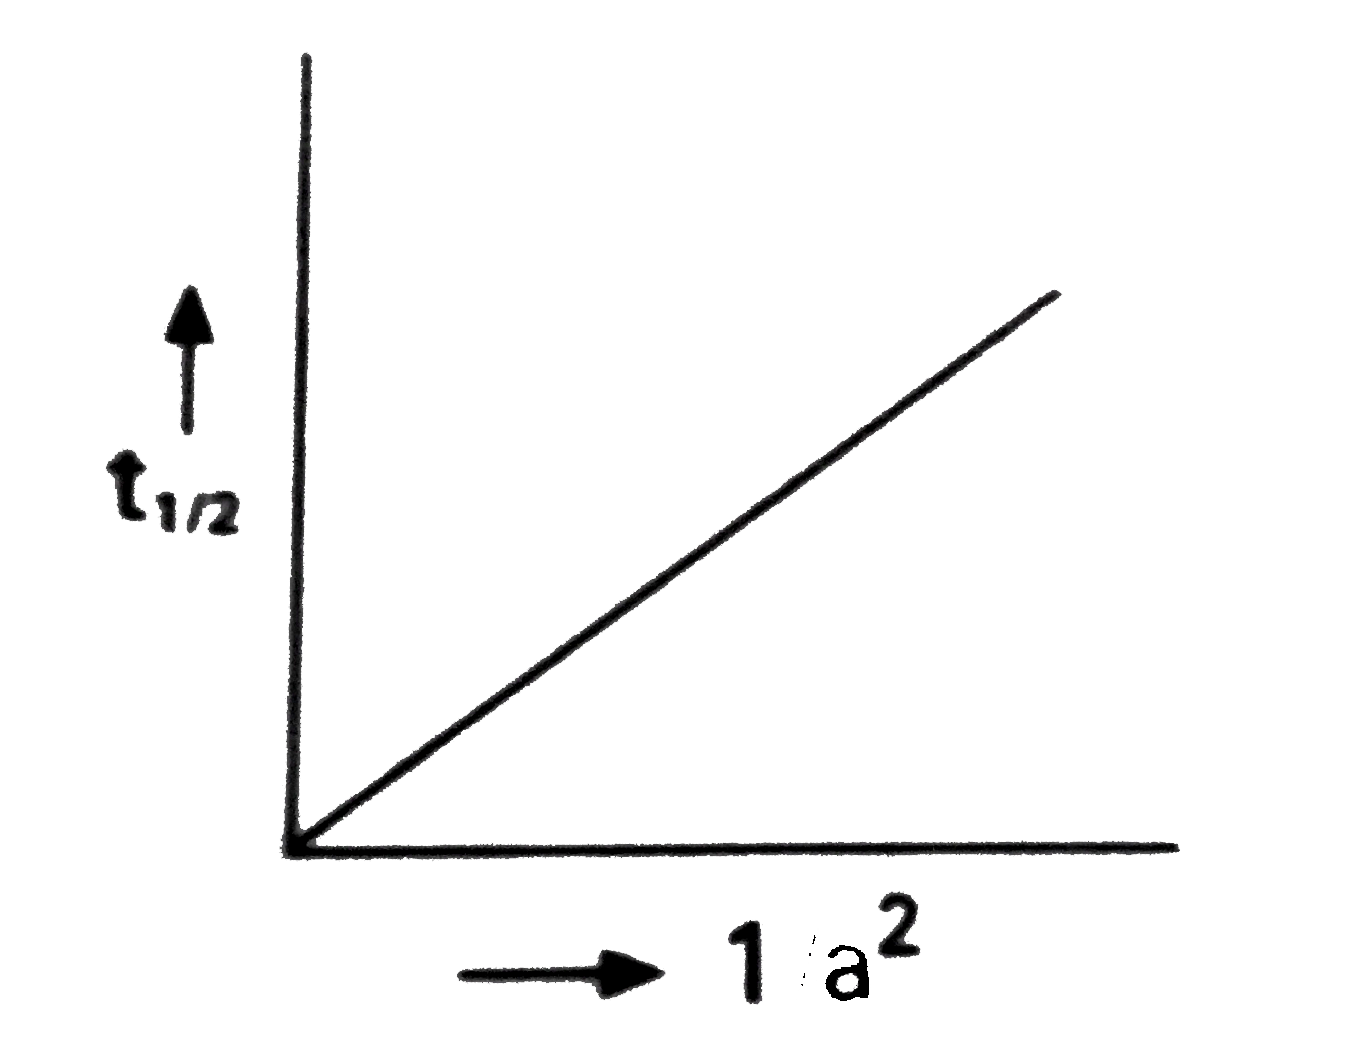 Afirst order reactionBzero order reactionCsecond order reactionDthird order reaction
A double bar graph is useful for the __________ of two sets of data.
Data represented in a circular form is called a _________ chart.
The graph of a linear equation is always a __________ line.
The cartesian system used two axes which are __________ to each other.
View SolutionDraw the histogram to represent the following data.

View SolutionThe expenditure of a family of different heads in a month is given below

Draw a bar graph to represent the data above.
View SolutionThe sales of a shopkeeper in the first week of january 2012, are given below :

Draw a graph representing the above data.
View SolutionA bar graph is drawn to the scale 1 cm = 250 units. The length of the bar representing a quantity of 300 units is________
View Solution

