A graph is plotted between pO2 and percentage saturation of Hb with O2 from Hb?
O2 association curve
CO2−O2 dissociation curve
O2 dissociation curve
CO2−O2 association curve
The correct Answer is:C
Step by step video & text solution for A graph is plotted between pO_(2) and percentage saturation of Hb with O_(2) from Hb? by Biology experts to help you in doubts & scoring excellent marks in Class 12 exams.
Updated on:21/07/2023Similar Questions
Knowledge Check
Assertion : A sigmoid curve is obtained when percentage saturation of haemoglobin with O2 is plotted against the PO2.
Reason : Every 100 mL of oxygenated blood can deliver around 5mL of O2 to the tissues under normal physiological conditions.AIf both assertion and reason are true and reason is the correct explanation of assertionBIf both assertion and reason are true and reason is not the correct explanation of assertionCIf assertion is true but reason is false.DIf both assertion and reason are false.The graph plotted between concentration versus time
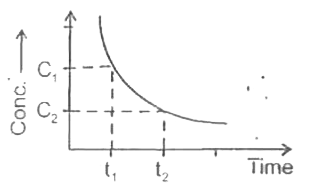
 AIt gives rate of disappearance of reactantBRate =(d[C2−C1)])t2−t1CBoth (1) & (2)DIt predicts the order of reaction
Which factors affect the dissociation of O2 from
Hb?ApH,pO2,pCO2 and temperatureBOnly pHCSalinity, temperature and pCO2DHCO−3 ions concentration, pH and salinity
The graph plotted between acceleration and displacement of a particle in SHM is
View SolutionWhat will be the change in graph depicting percentage saturation of oxyhaemoglobin and pO2 (mm of Hg) with increase in H+ concentration in blood ?
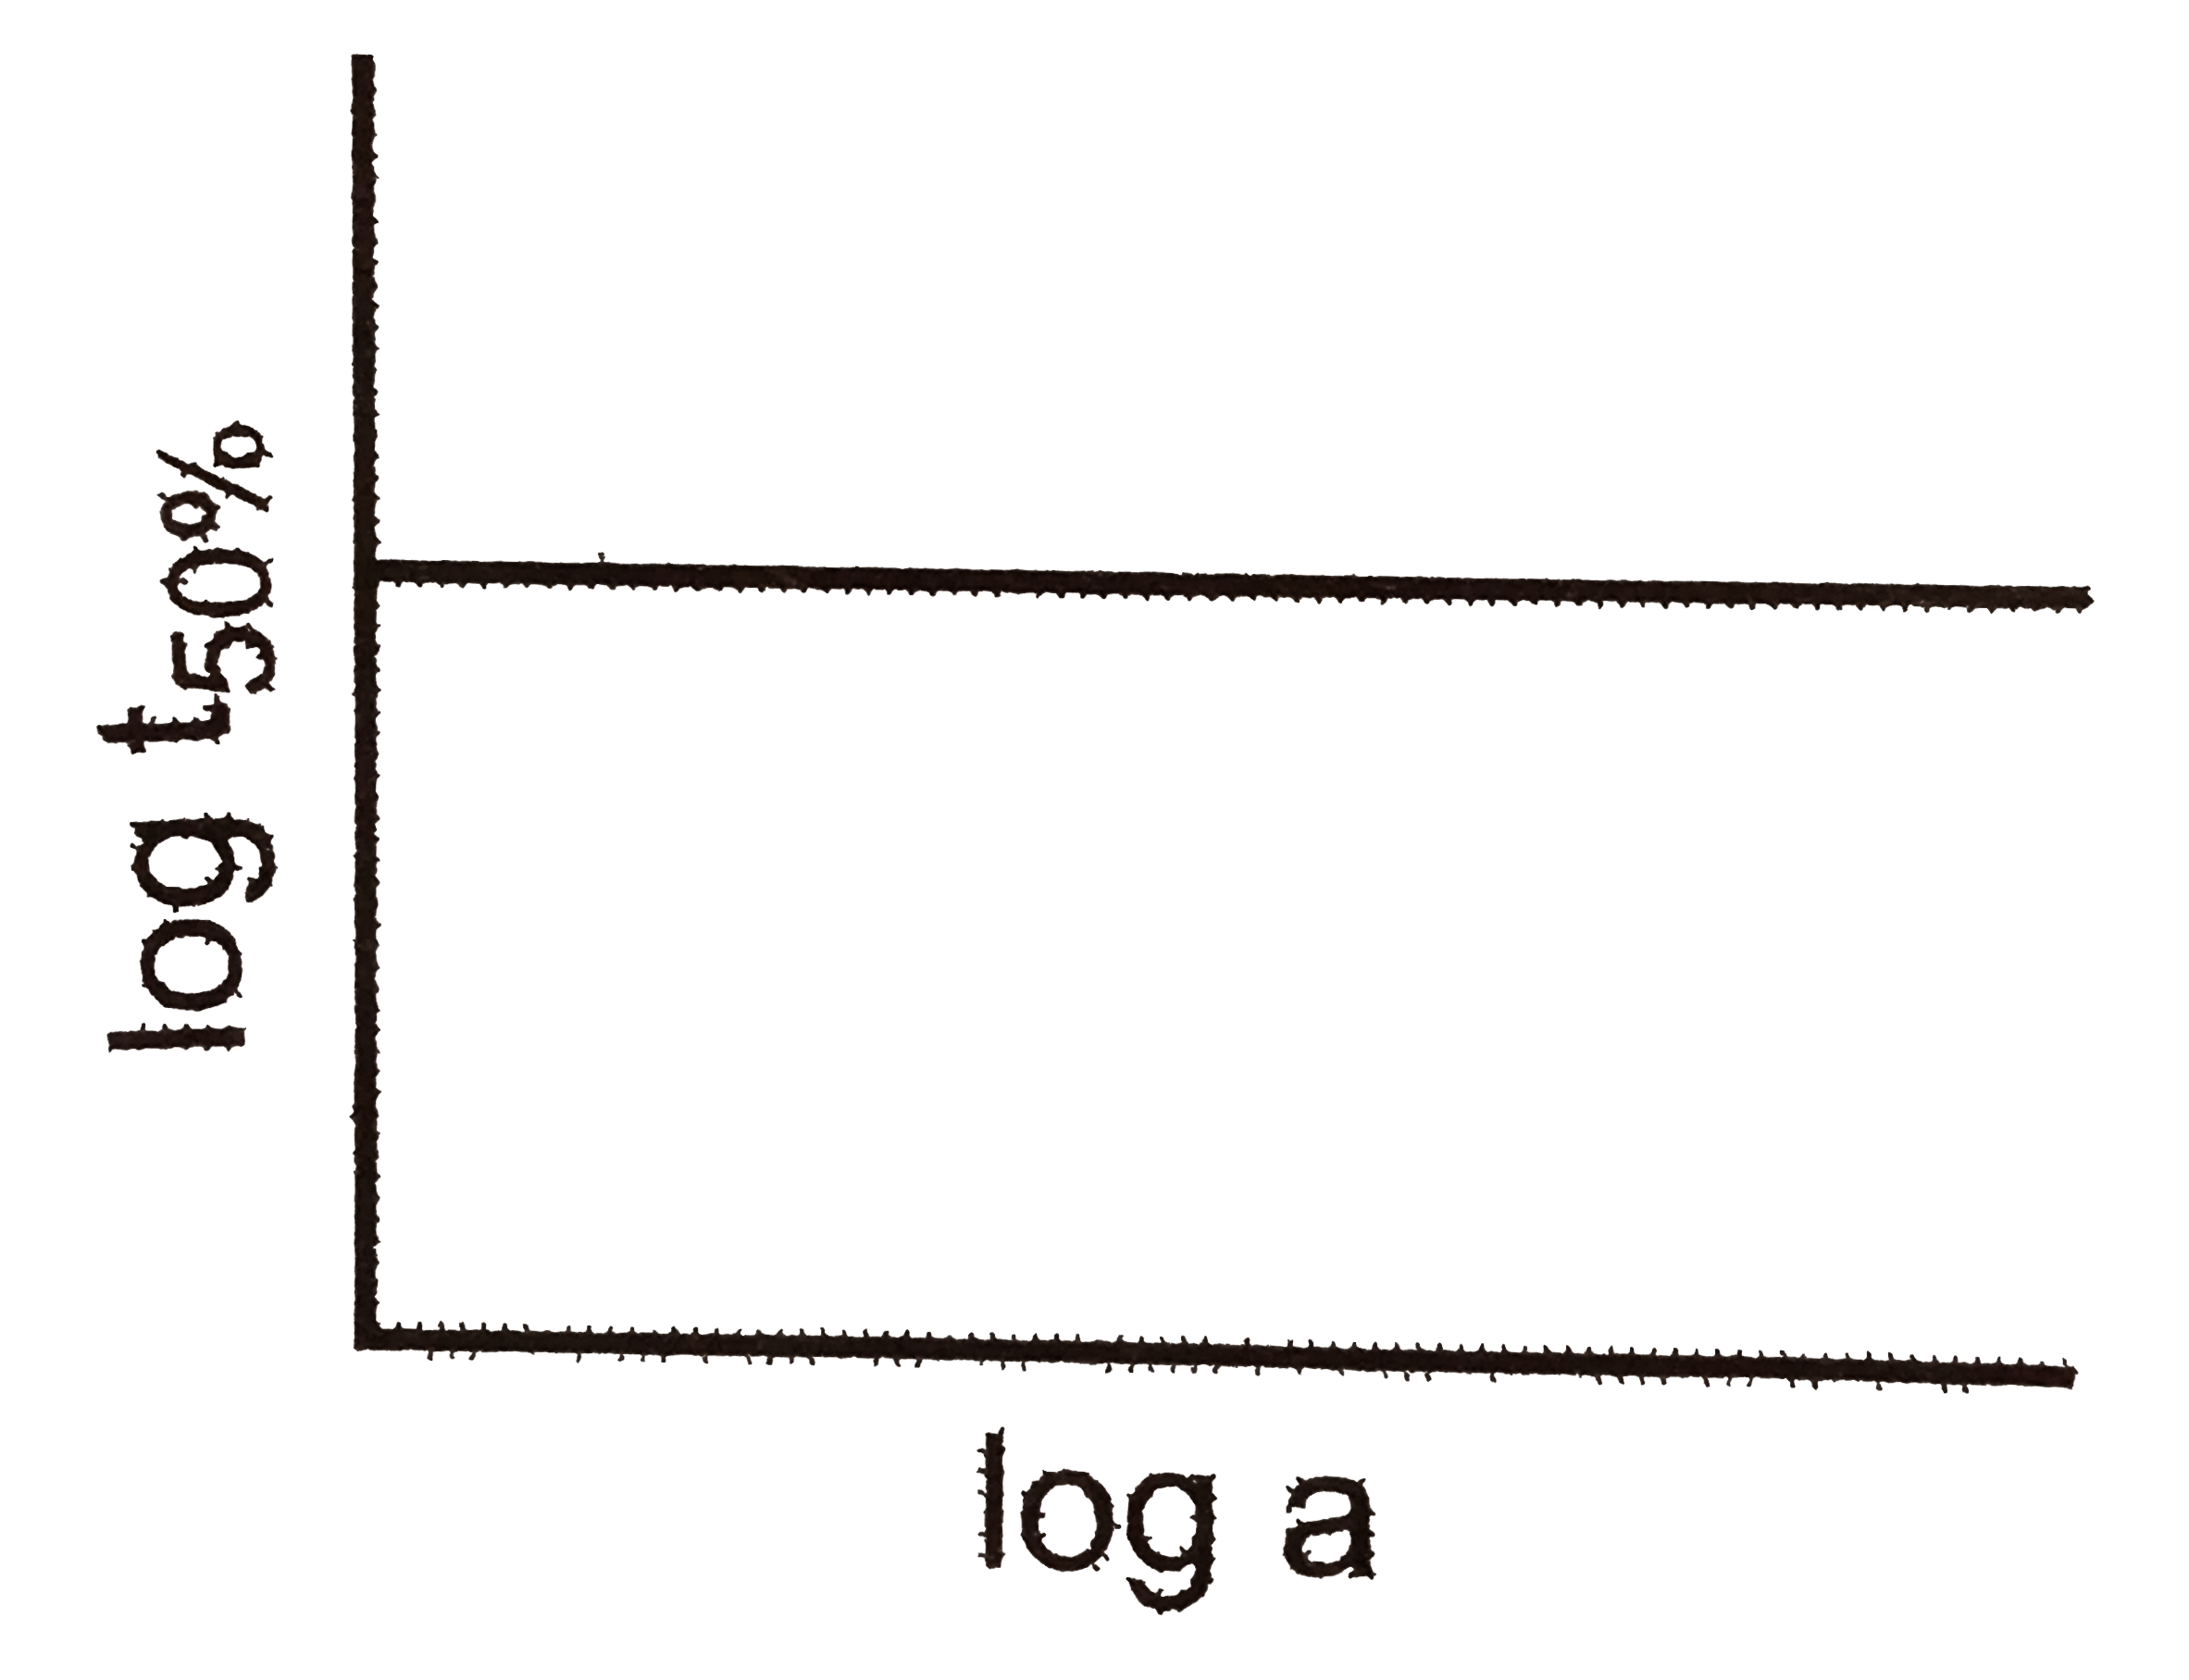
View SolutionA graph plotted between log t50% vs log concentration is a straight line. What conclusion can you draw from this graph?

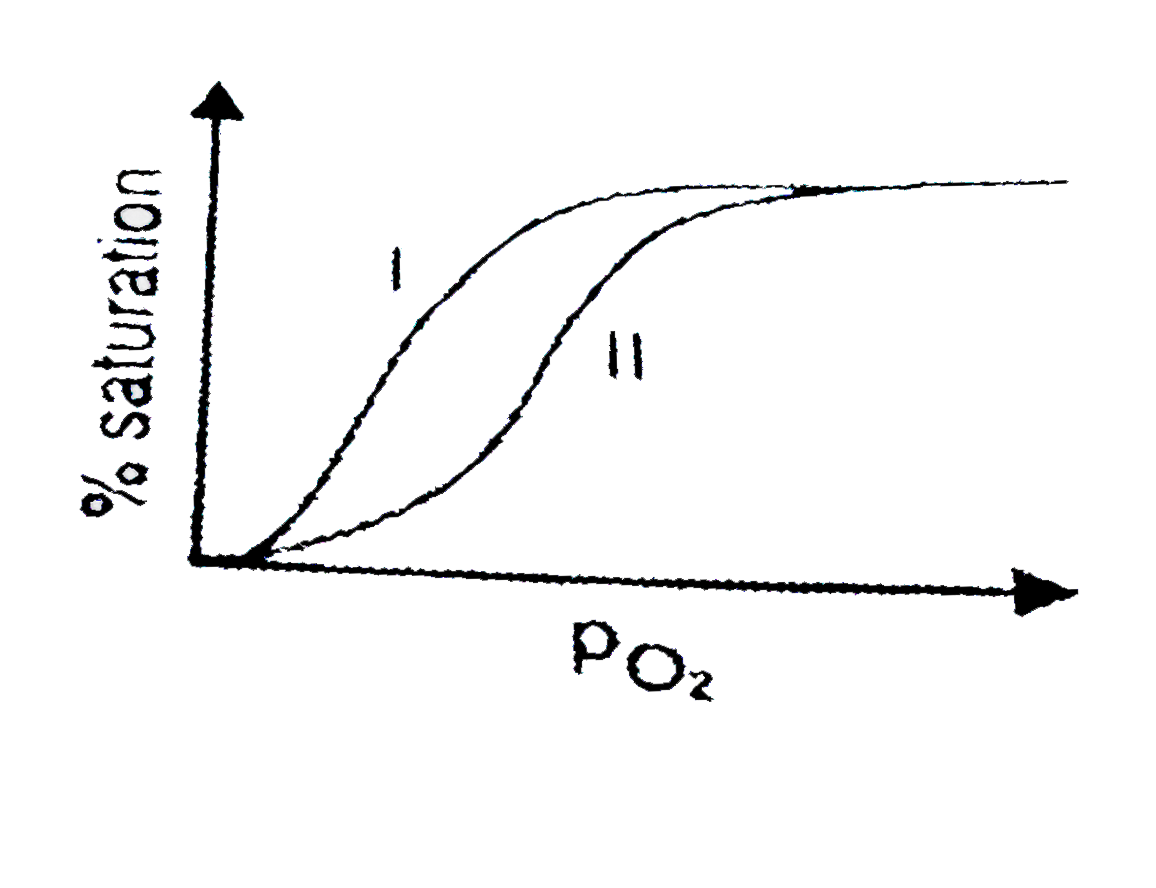
View SolutionHaemoblobin is a Fe containing protein responsible for oxygen transport in the blood. The curves given below idicate the percentage suturation of haemoglobin by O2 as a funcion of partial pressure of O2.
Which of the following statement/s is/are correct for the given curves?
I. In presence of CO2, higher PO2 is needed for a given percentage saturation.
II. In presence of CO2, lower PO2 is needed for a give percentage saturation.
III. The maximum percentgae saturation is not affected by the presence of CO2
IV. In the absence of CO2, maximum saturation of haemoglobin occurs at lower pO2.

View SolutionO2 dissociation curve is plotted between pO2 and......
View Solution