The graph between the (velocity2) and temperature T of a gas is
Video Solution
Text Solution
The correct Answer is:B
Vα√T⇒Vα√T+273⇒V2=kt+273k is similar to y=mx+c
|
Topper's Solved these Questions
- WAVESBOOK - NARAYNACHAPTER - WAVESEXERCISE - Exercise-I (C.W)
104 Videos
- WAVESBOOK - NARAYNACHAPTER - WAVESEXERCISE - Exercise-I (H.W)
101 Videos
- WAVESBOOK - NARAYNACHAPTER - WAVESEXERCISE - Evaluate yourself-5
7 Videos
- VECTORSBOOK - NARAYNACHAPTER - VECTORSEXERCISE - LEVEL-II (H.W)
14 Videos
- WORK , ENERGY & POWER BOOK - NARAYNACHAPTER - WORK , ENERGY & POWER EXERCISE - EXERCISE IV
43 Videos
Similar Questions
Knowledge Check
The graph between surface tension and temperature T is
A B
B C
C D
D
The graph between L and T2 is
A B
B C
C D
D
The graph between L and T2 is
A B
B C
C D
D
The slope of the graph between log P and log V at constant temperature for a given mass of gas is
View SolutionThe graph between pressure P and volume V for a given mass of a gas a fixed temperature T is a ________ .
View SolutionA particle is exdecuting a linear SHM. What is the nature of the graph between the velocity and displacement of the particle at any ins"tan"t ?
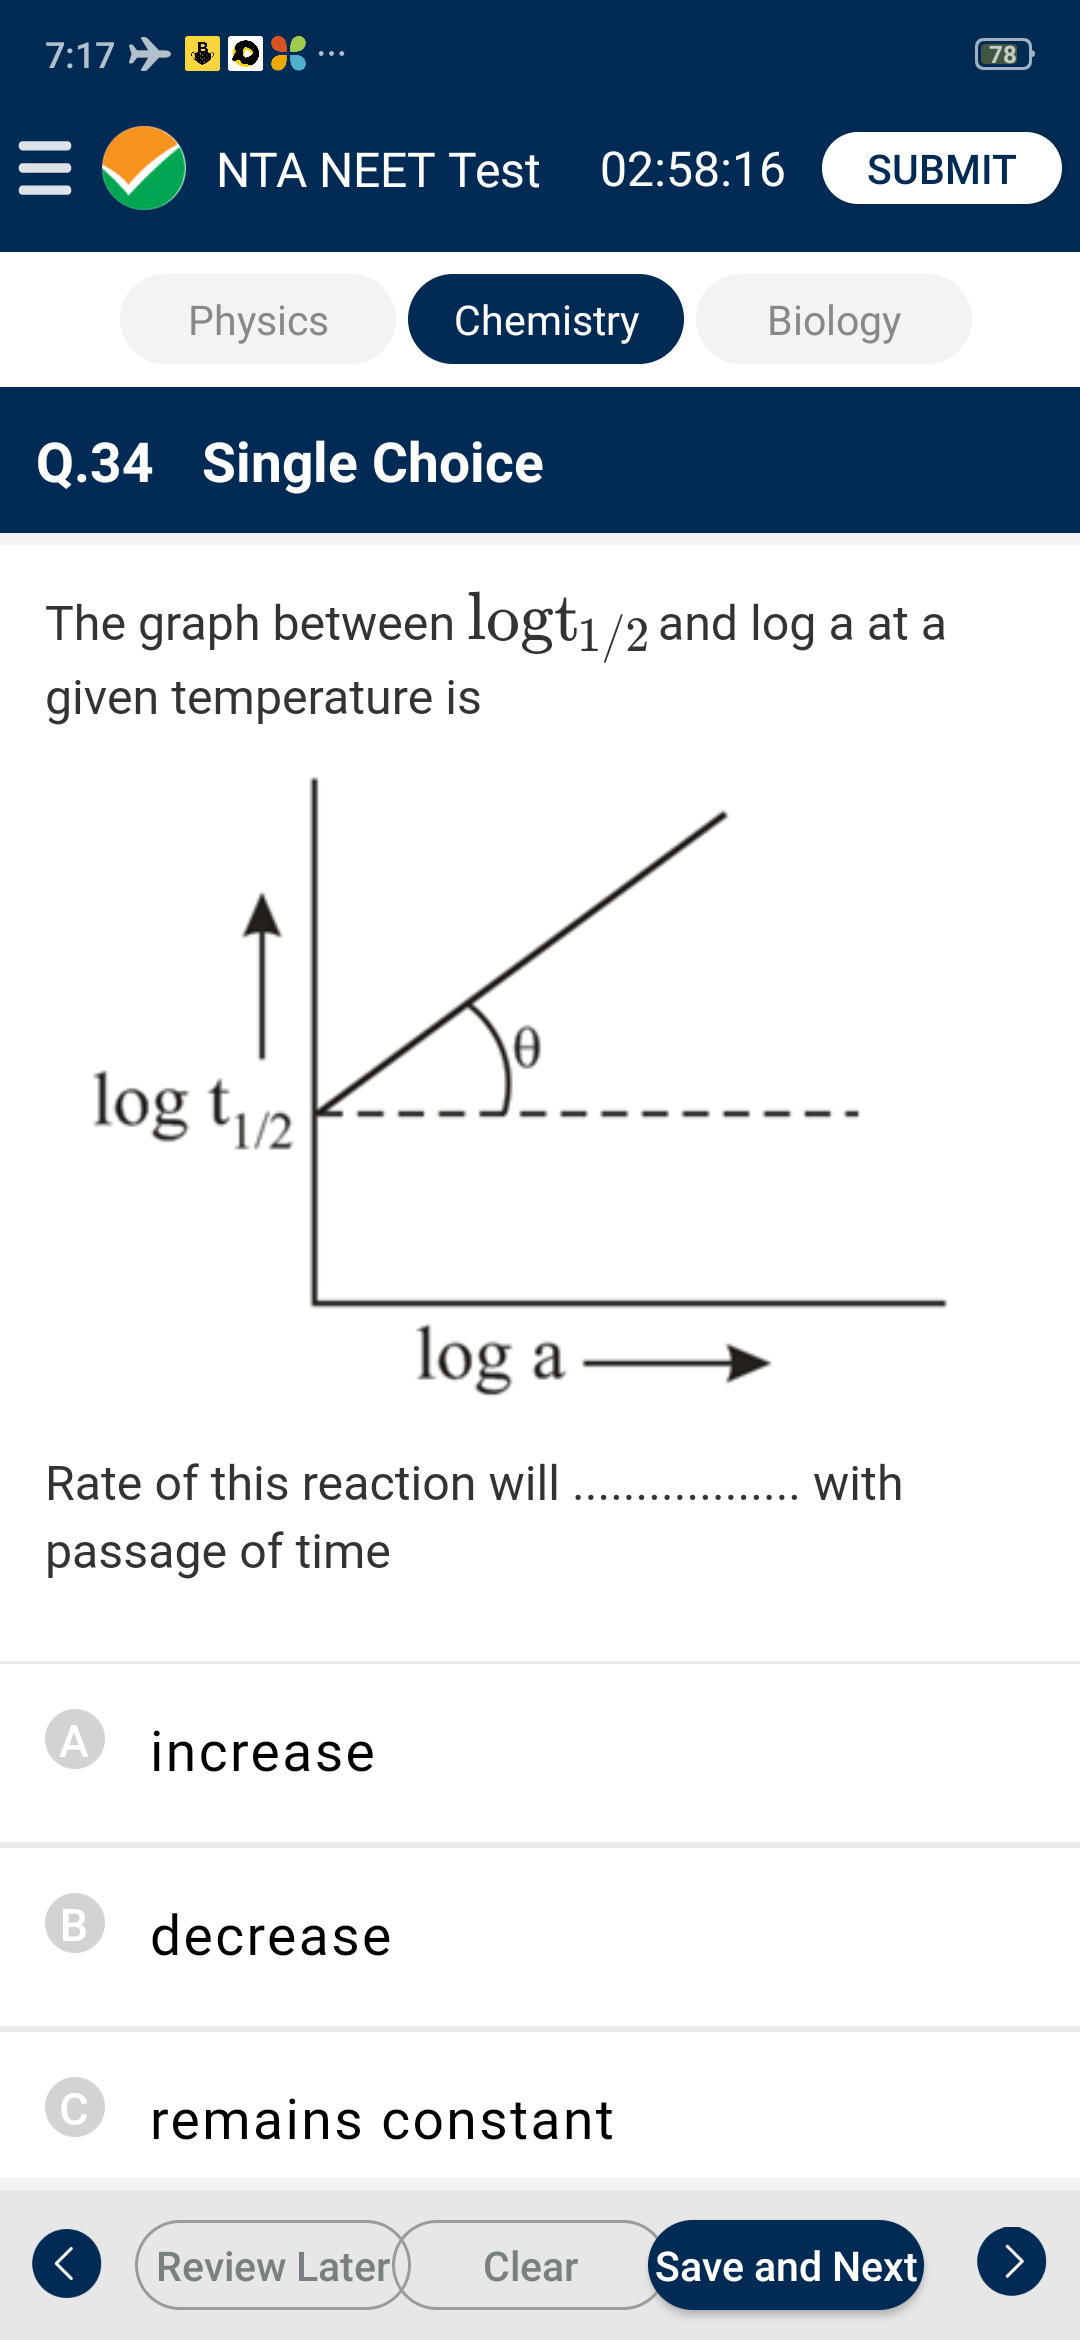
View SolutionThe graph between log t1/2 and log a at a given temperature is

Rate of this reaction will …….with passage of time
View SolutionIf a piece of metal is heated to temperature θ and the allowed to cool in a room which is at temperature θ0, the graph between the temperature T of the metal and time t will be closet to
View Solution
