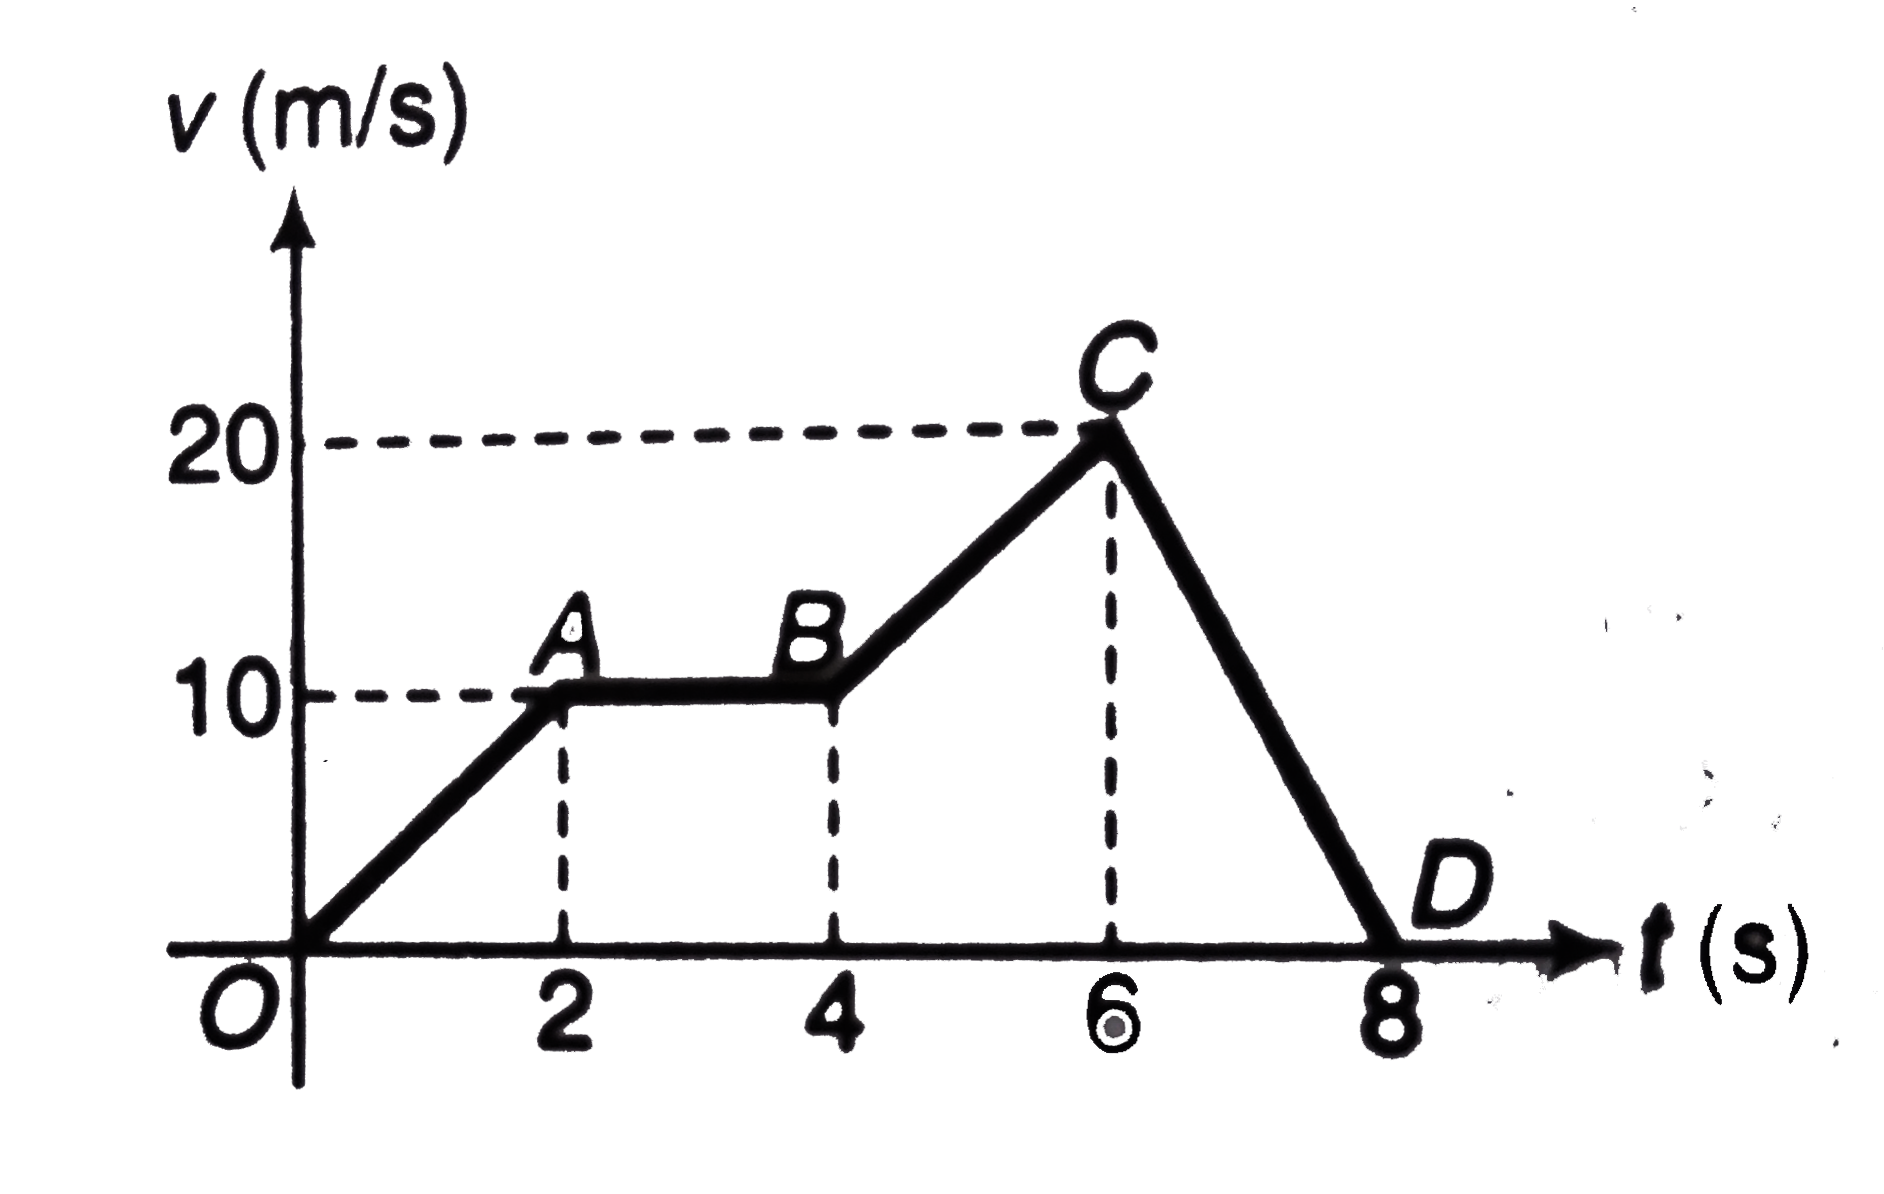
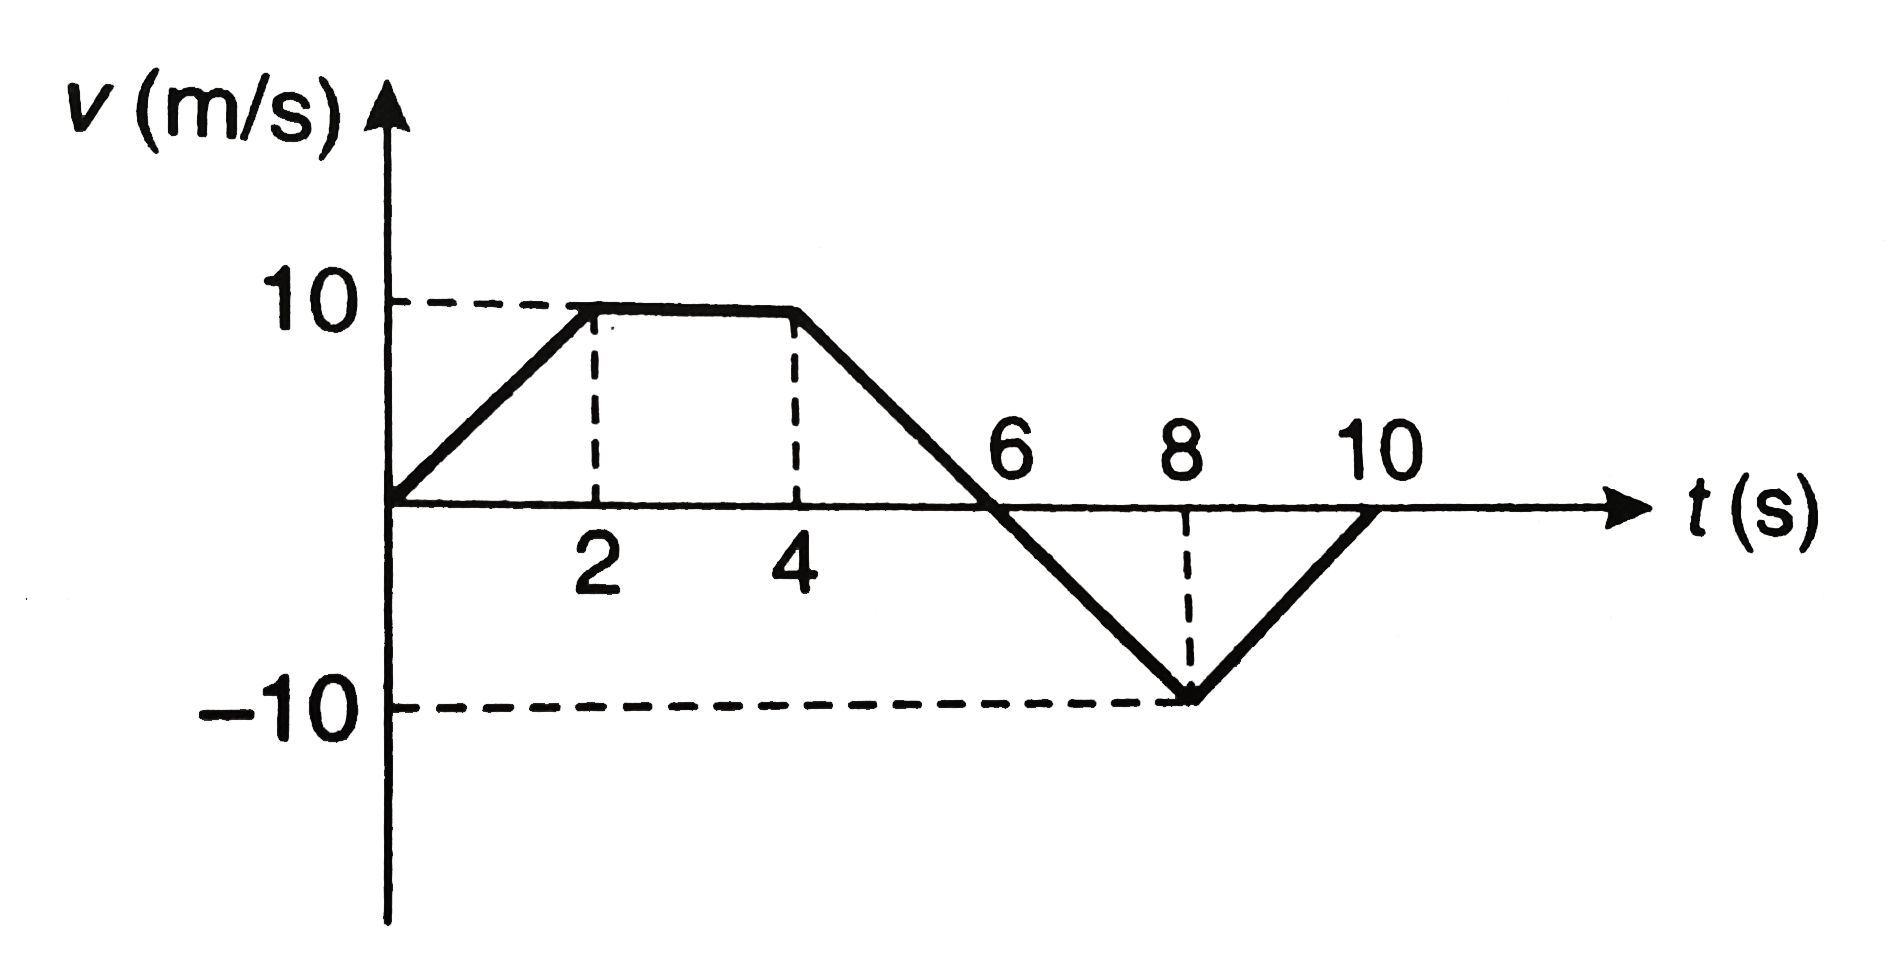
Velocity-time graph of a particle moving in a straight line is shown in figure. Plot the corresponding displacement-time graph of the particle if at time t=0, displacement s=0.
Video Solution
Text Solution
Displacement=area under velocity-time graph.
Hence, sDA=12××10=10m
sAB=2×10=20m
or sOAB=10+20=30m
sBC=2×(10+202)=30m
or sOABC=30+30=60m
and sCD=2×(20+02)=20m
or sOABCD=60+20=80m
Between 0 to 2 s and 4 to 6s motion is accelerated, hence displacement-time graph is a parabola. Between 2 to 4 s motion is uniform, so displacement-time will be a straight line. Between 6 to 8 s motion is decelerated hence displacement-time graph is again a parabola but inverted in shape. At the end of 8s velocity is zero. therefore, slope of displacement time graph should be zero. The corresponding graph is shown in figure.
|
Topper's Solved these Questions
- MOTION IN A PALNEBook:ALLENChapter:MOTION IN A PALNEExercise:EXERCISE-1
Explore 99 Videos
- MOTION IN A PALNEBook:ALLENChapter:MOTION IN A PALNEExercise:EXERCISE-2
Explore 170 Videos
- KINEMATICS-2DBook:ALLENChapter:KINEMATICS-2DExercise:Exercise (O-2)
Explore 48 Videos
- NEWTON'S LAWS OF MOTION & FRICTIONBook:ALLENChapter:NEWTON'S LAWS OF MOTION & FRICTIONExercise:EXERCISE (JA)
Explore 4 Videos
Similar Questions
Knowledge Check
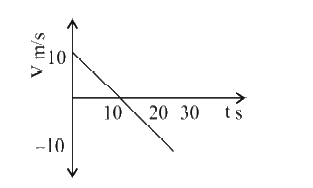
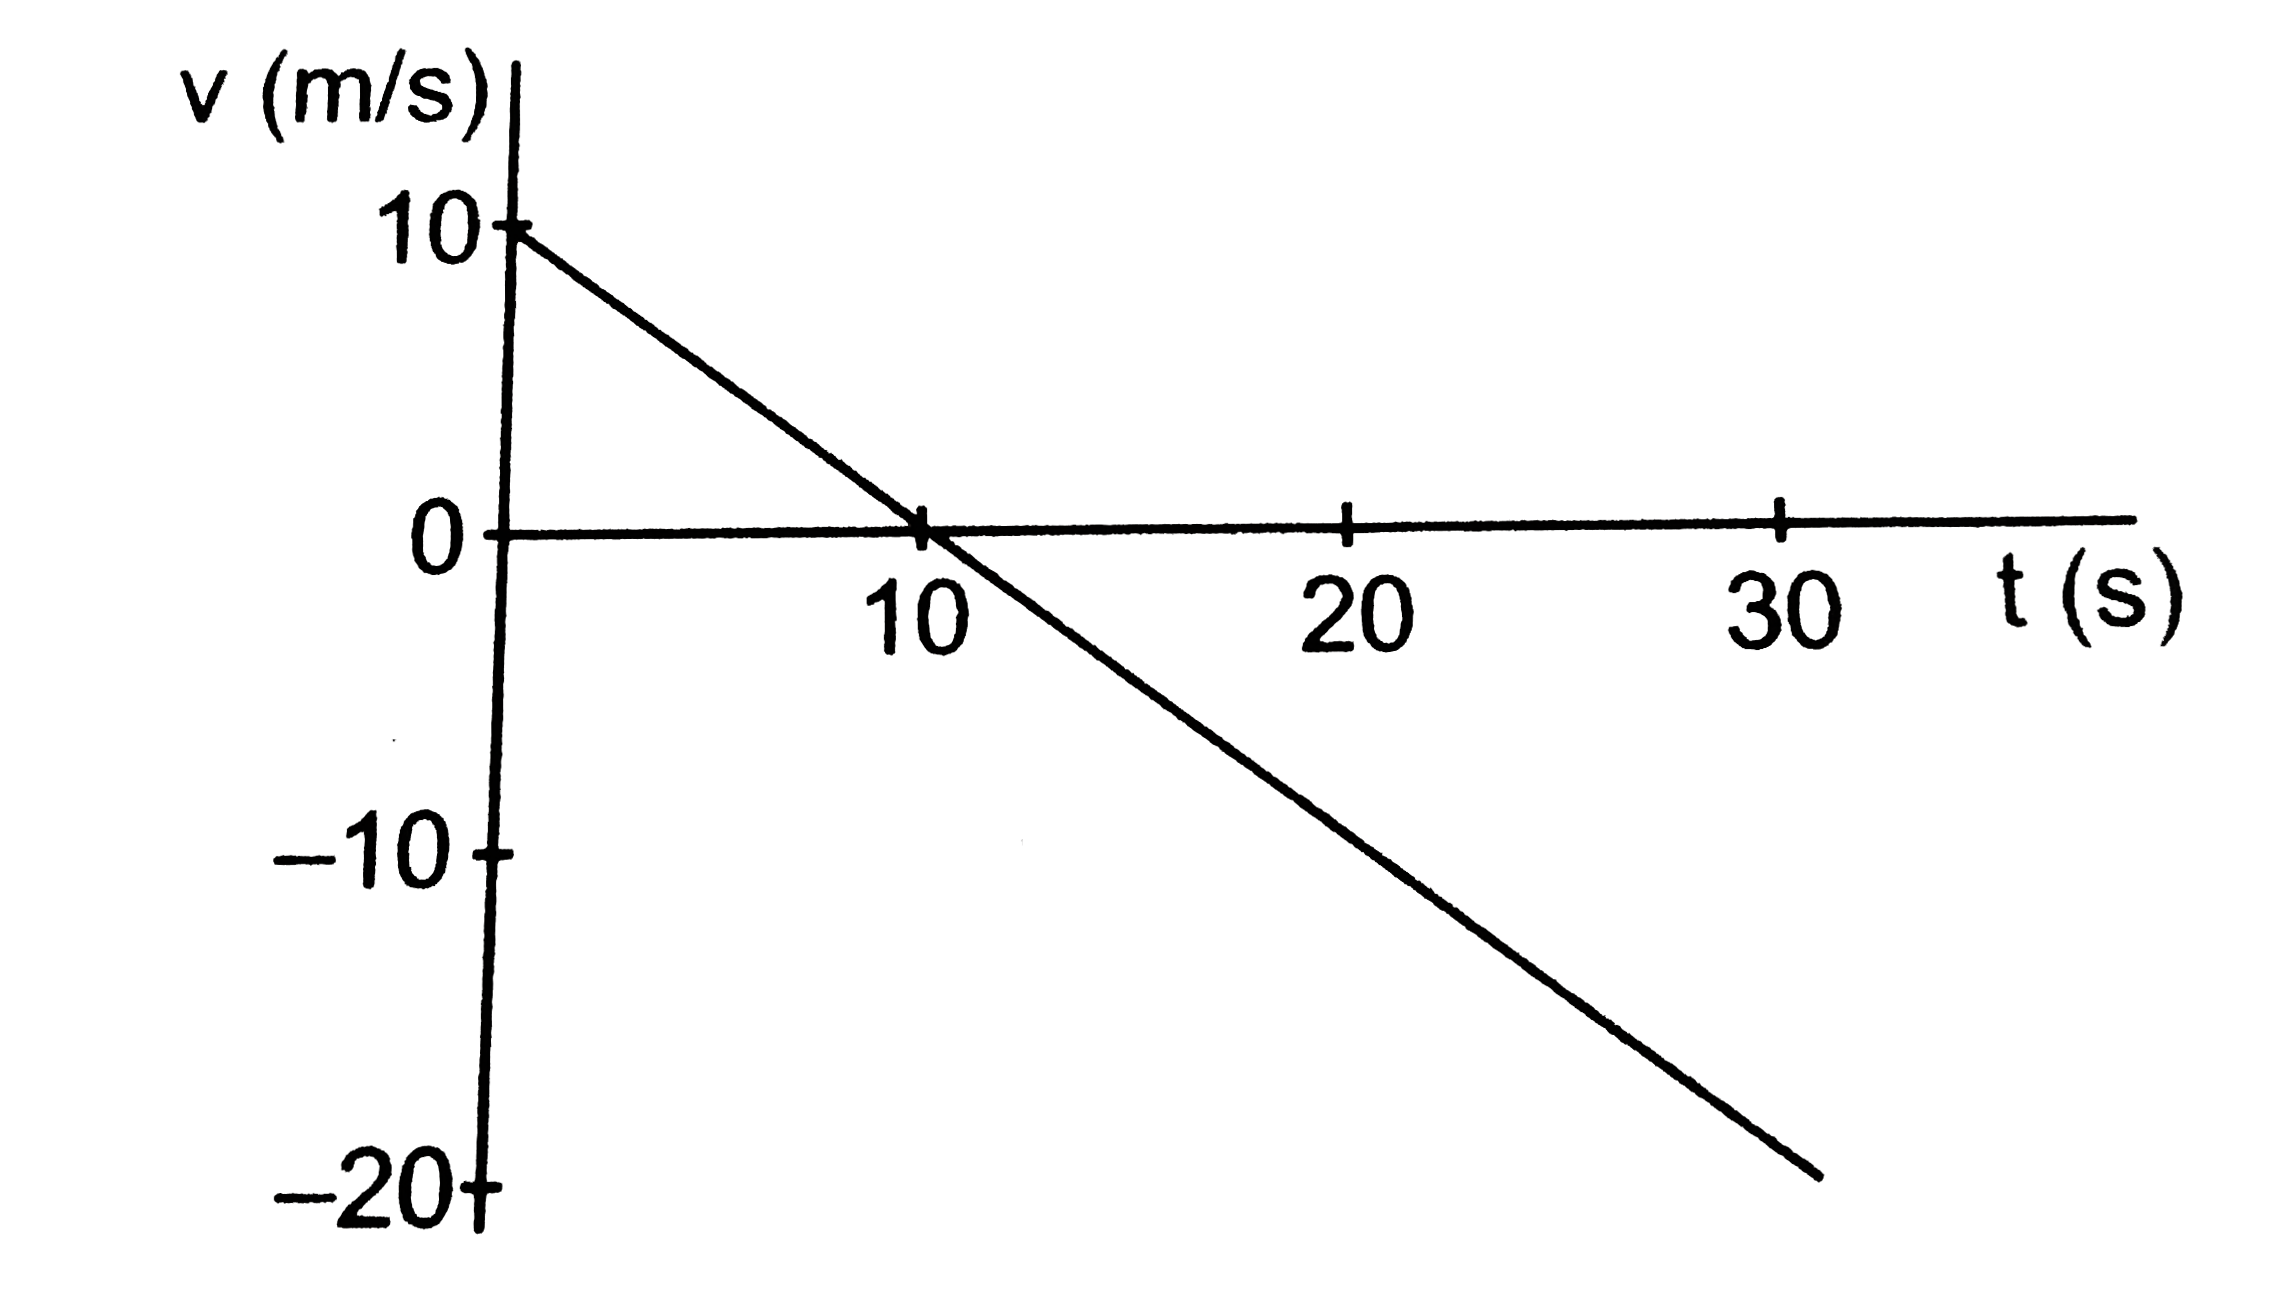
The velocity-time plot for a particle moving on a straight line is shown in figure.
 AThe particle has a constant acceleration.BThe particle has never tumed around.CThe particle has zero displacement.DThe average speed in the interval 0 to 10 s is the same as the average speed in the interval 10s to 20 s.
Displacement time graph of a particle moving in a straight line is a shown in figure.
 Ain region A acceleration is positiveBin region B acceleration is negativeCin region C acceleration is positiveDin region D acceleration is negative
Velocity displacement graph of a particle moving in a straight line is as shown in figure.
 Amagnitude of acceleration of particle is decreasingBmagnitude of acceleration of particlre is increasingCacceleration versus displacement graph straight lineDacceleration versus displacement graph is parabola
The velocity-time graph of a particle moving along a straight line is shown in the figure-given below
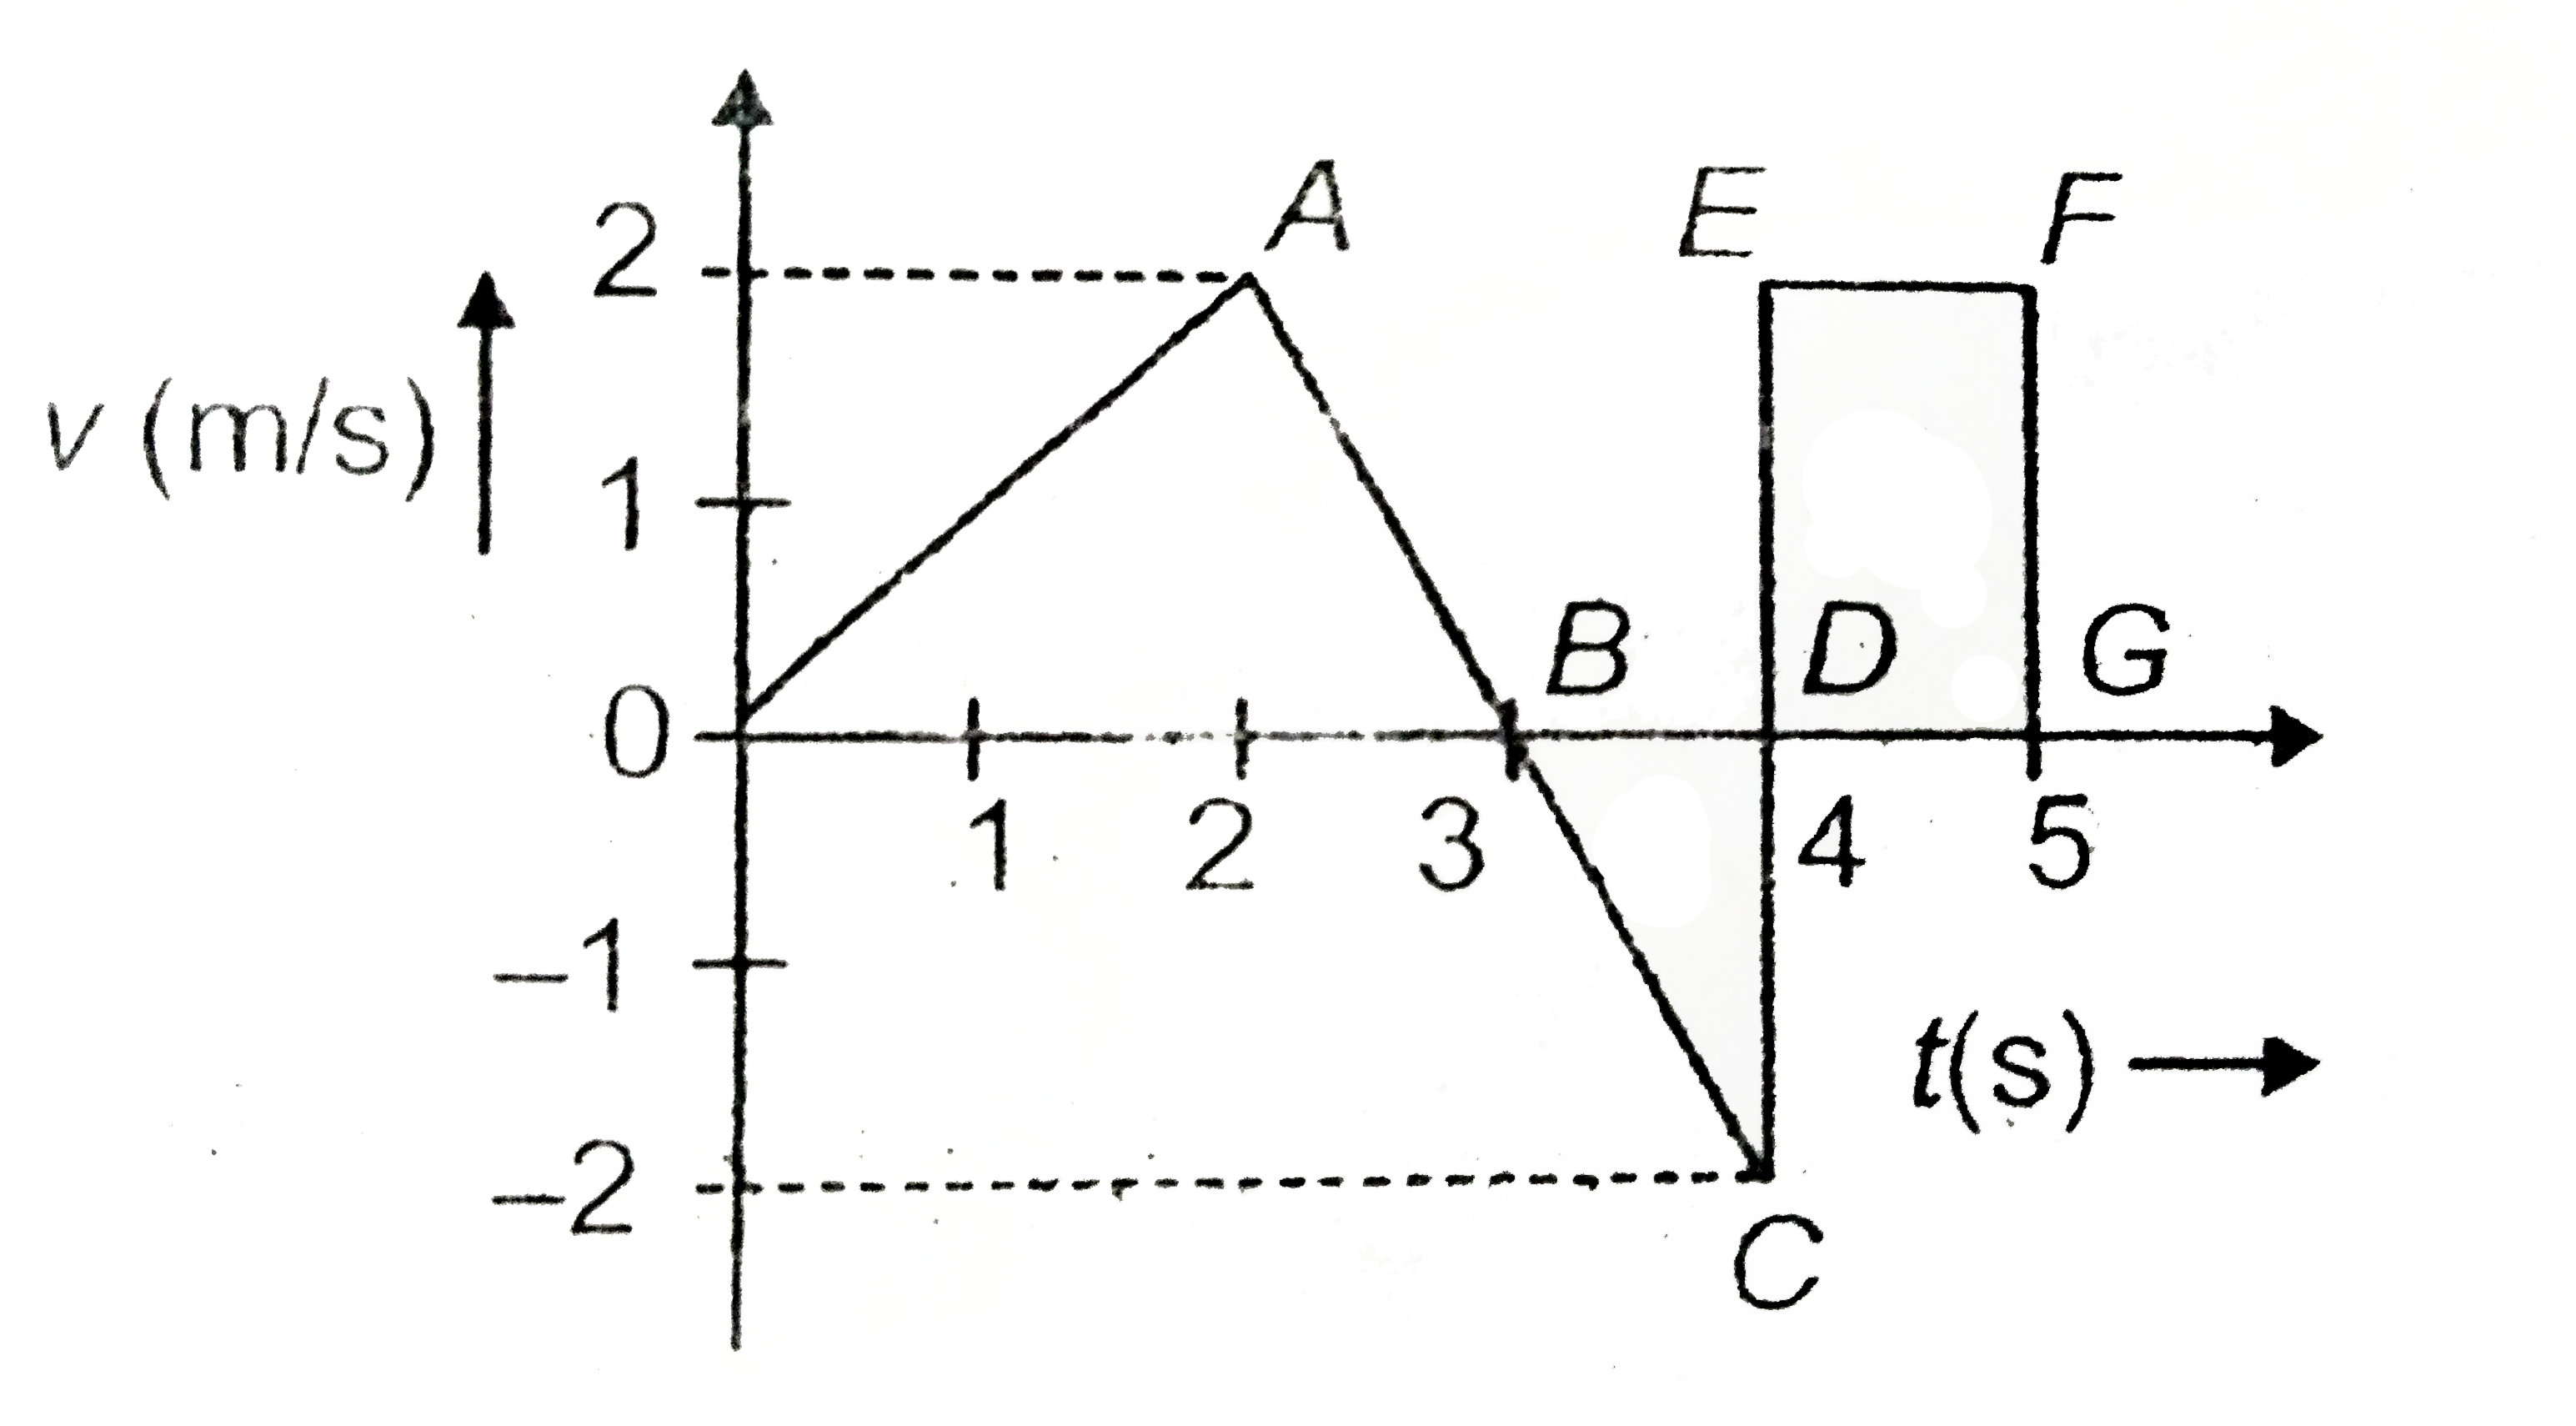
The displacement of the particle in 5 second is
View SolutionVelocity-time graph of a particle moving in a straight line is shown in figure. At time t=0,s=−10m. Plot corresponding a-t and s-t graphs.
View SolutionThe velocity- time plot for a particle moving on a straight line is shown in the figure
View SolutionThe velocity time plot for a particle moving on straight line is shown in the figure.
View SolutionThe velocity - time graph of a particle moving along a straight line is shown in the figure given below
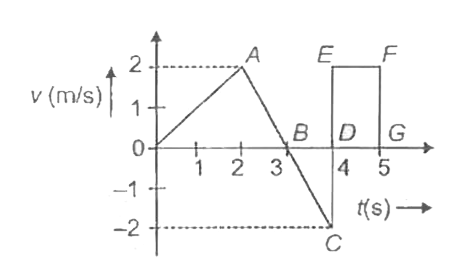
The displacement of the particle in 5 second is
View Solution

