The slope of graph as shown in figure at points 1,2 and 3 is m1,m2 and m3 respectively then
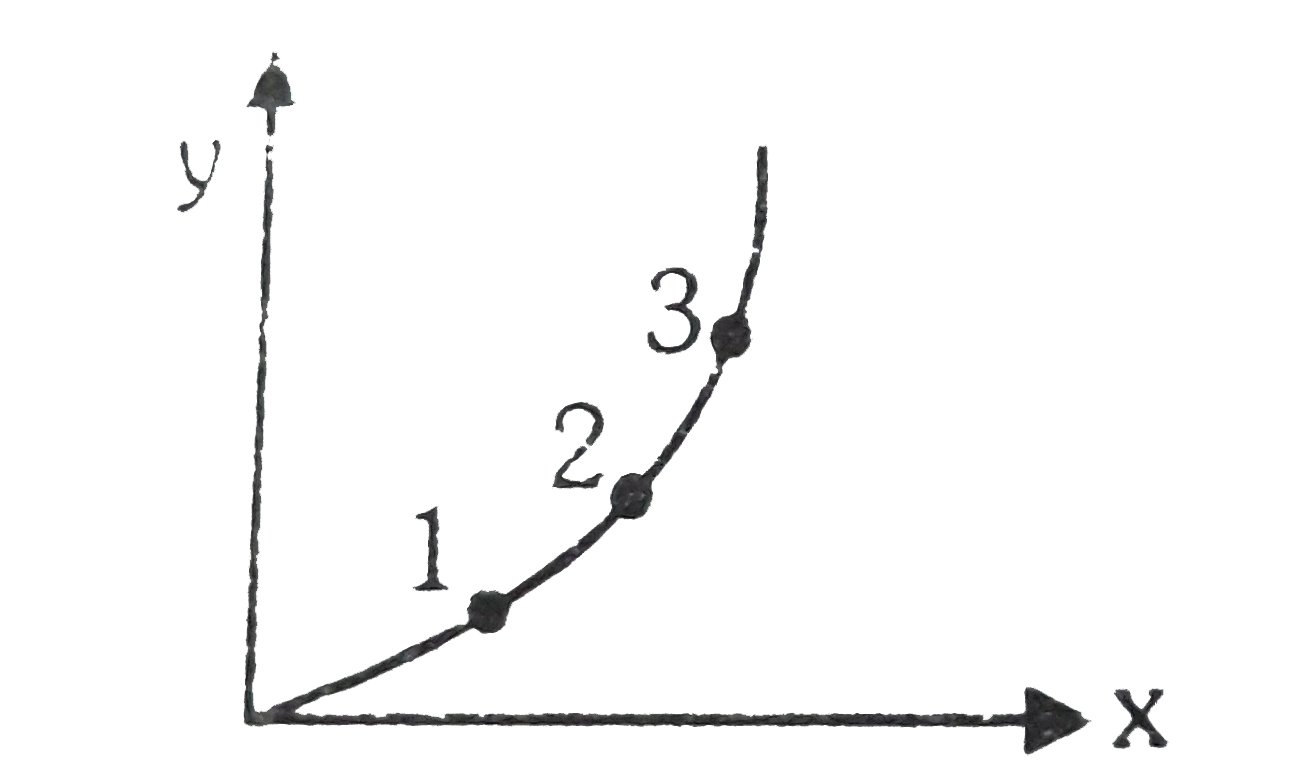
m1>m2>m3
m1<m2<m3
m1=m2=m3
m1=m3>m2
The correct Answer is:B
Step by step video, text & image solution for The slope of graph as shown in figure at points 1,2 and 3 is m_(1), m_(2) and m_(3) respectively then by Physics experts to help you in doubts & scoring excellent marks in Class 12 exams.
Updated on:21/07/2023Topper's Solved these Questions
- BASIC MATHSBook:ALLENChapter:BASIC MATHSExercise:EXERCISE-3
Explore 20 Videos
- BASIC MATHSBook:ALLENChapter:BASIC MATHSExercise:UNIT & DIMENSIONS
Explore 19 Videos
- BASIC MATHSBook:ALLENChapter:BASIC MATHSExercise:EXERCISE-1
Explore 128 Videos
- AIIMS 2019Book:ALLENChapter:AIIMS 2019Exercise:PHYSICS
Explore 40 Videos
- CIRCULAR MOTIONBook:ALLENChapter:CIRCULAR MOTIONExercise:EXERCISE (J-A)
Explore 6 Videos
Similar Questions
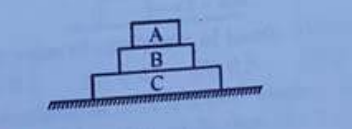
Three blocks are placed as shown in figure. Mass of A, B and C are m1,m2,and m3respectively. The force exerted by block 'C' on 'B' is :-
View SolutionShown in the figure is a system of three particles having masses m1=1kg,m2=2kgand m1=4kg respectively connected by two springs. The accelartion of A, B and C at any instant are 1m/sec2,2m/sec2 and 1/2msec2 respectively directed as shown in the figure. the external force in N acting on the system is. . . ..

View Solution
Knowledge Check
A pulley-block arrangement is shown in the adjacent figure, if acceleration of m1,m2 and m3 are a1,a2 and a3 respectively, then relation between a1,a2 and a3 is ( All string and pulleys are ideal . )
 Aa2−a3+10a1=0Ba3−a2+10a1=0Ca2−2a3+10a1=0D2a2+a3+5a1=0
In the adjacent figure, all the pulleys are frictioniess and massless, all the stringes are also massless. The relation between a1,a2 and a3 is (where a1,a2 and a3 are the acceleration of masses m1,m2 and m3 respectively in the direction as shown in the figure)
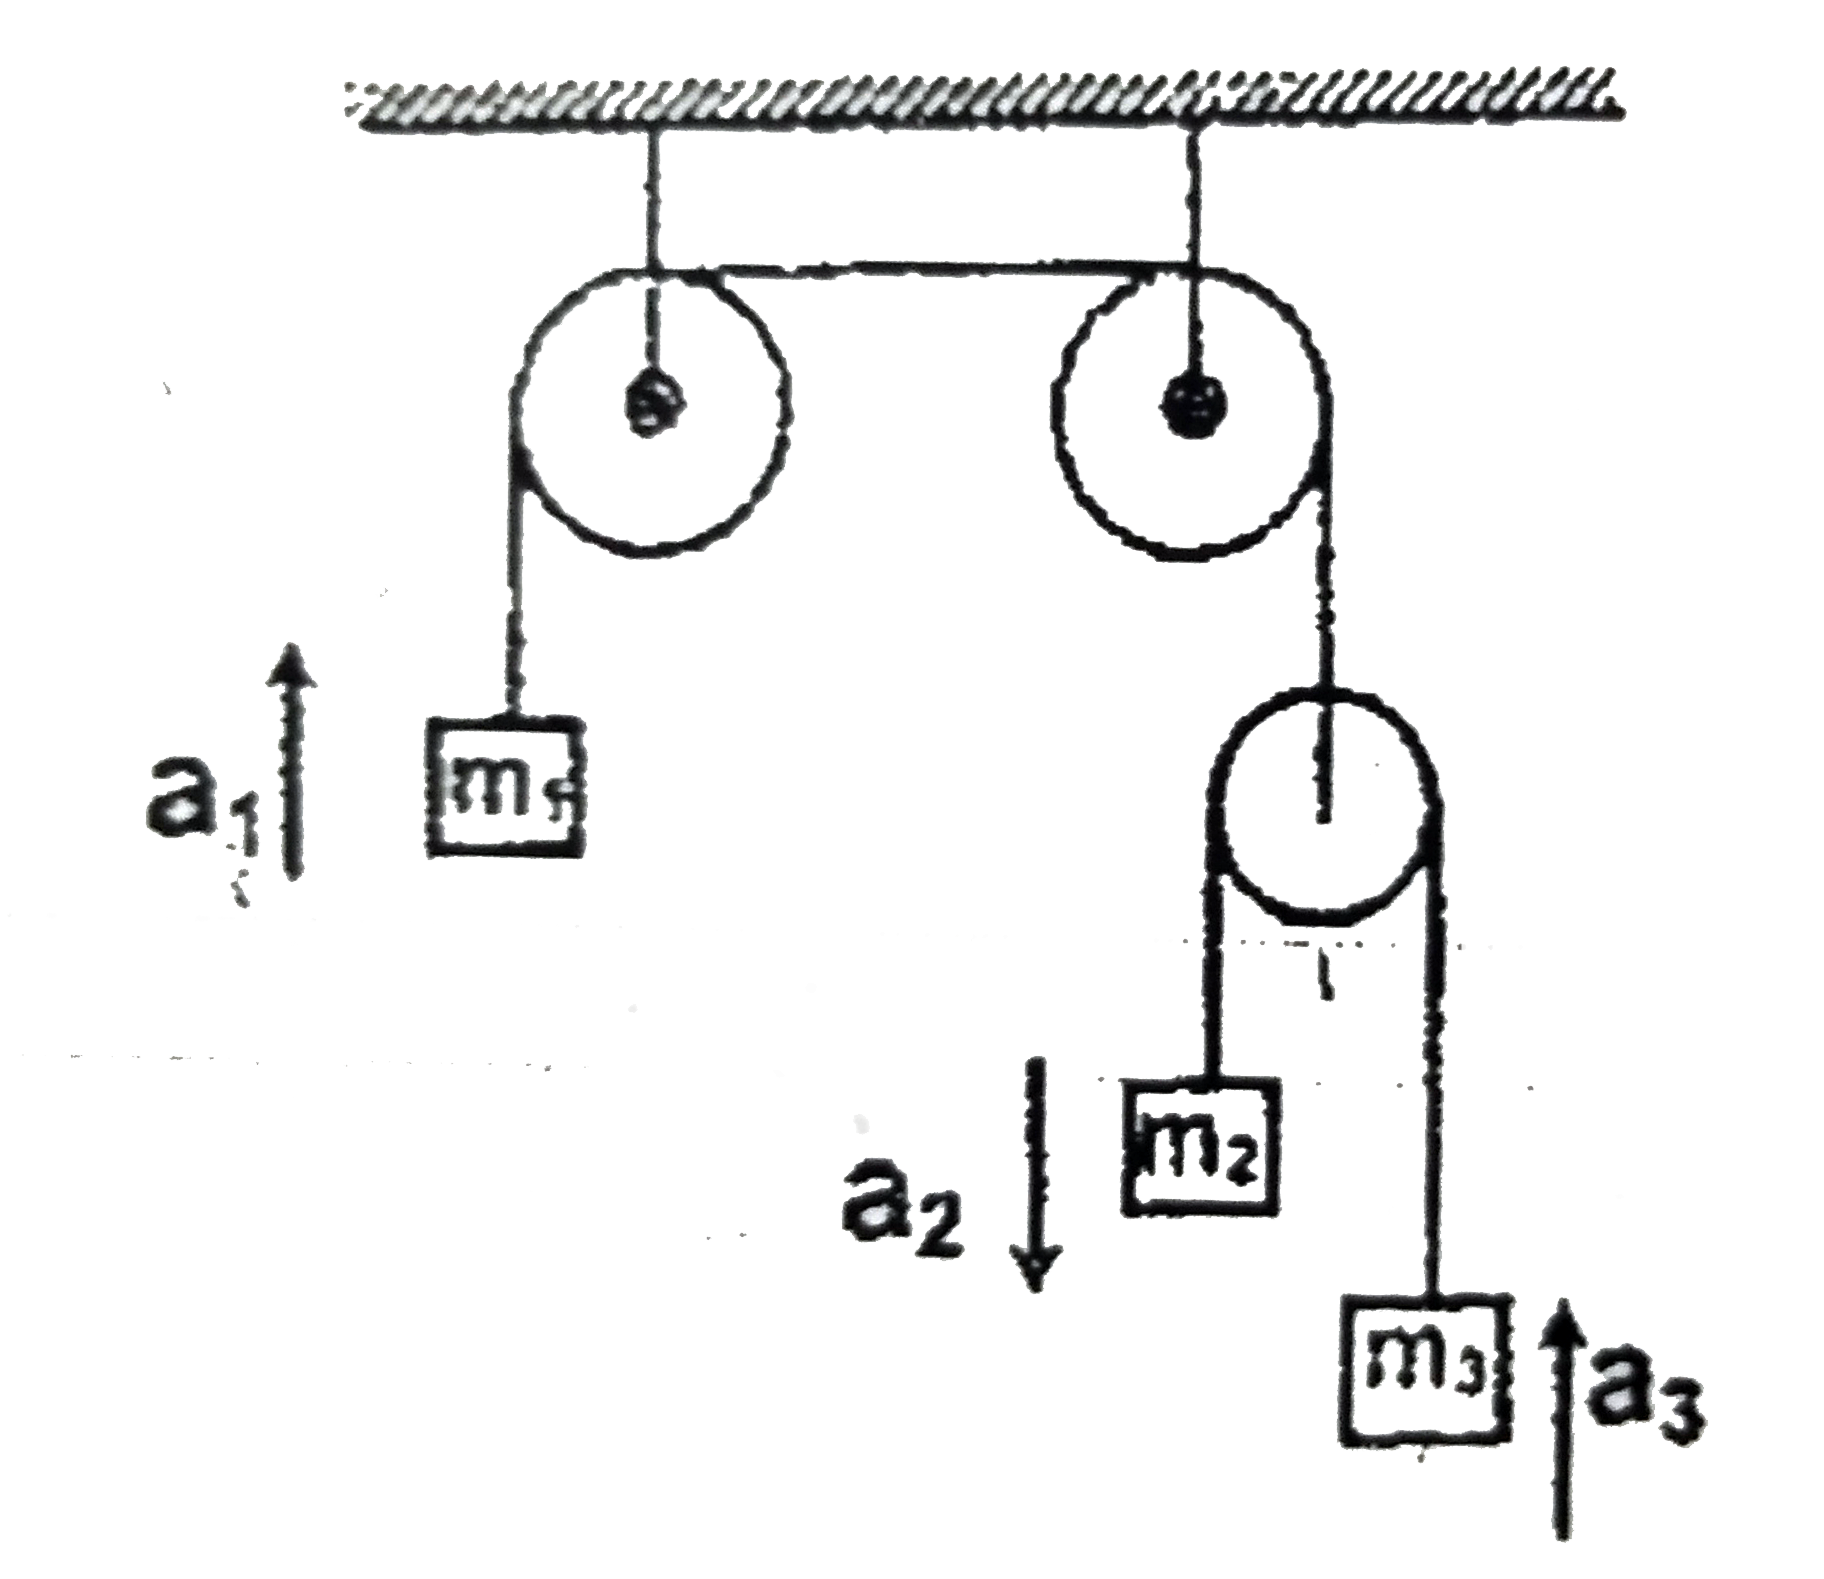 Aa3−a2+2a1=0Ba3+a2−2a1=0C2a2+a3=2n1DNone of these
In the shown diagram m1=m2=4kg and m3=2kg. Coefficient of friction between m1andm2 is 0.5. The mass m1 is given a velocity v and it just stops at the other end of the mass m1 in 1 sec. Let a1anda2anda3 be the acceleration m1,m2andm3 respectively, then :
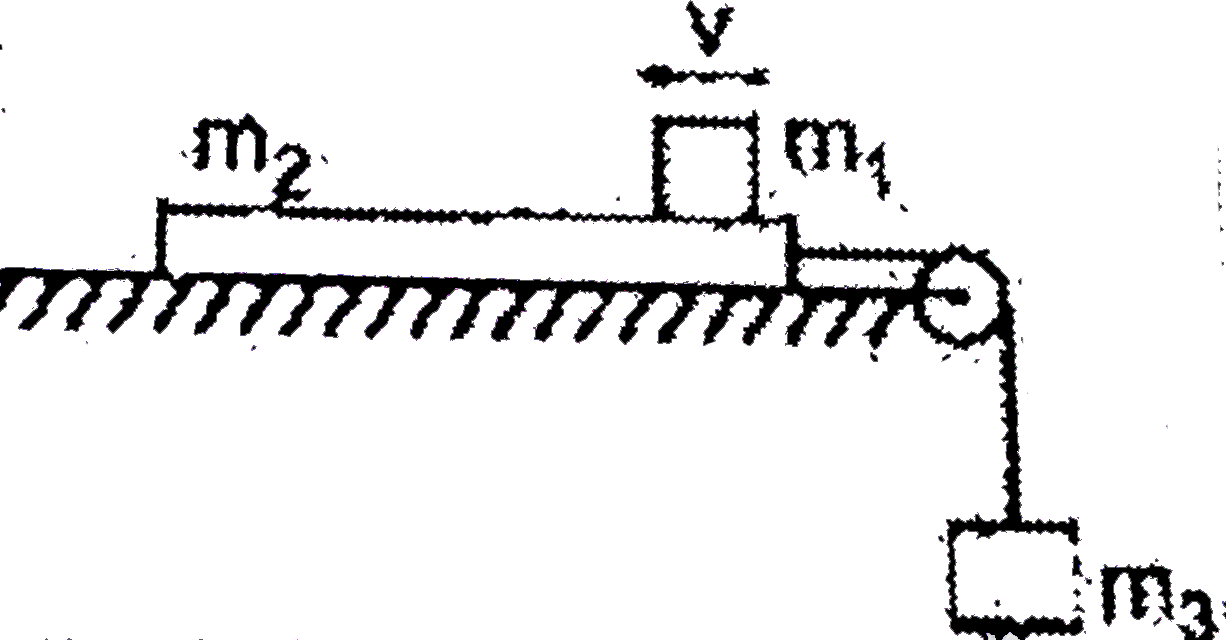 Afor t<1sec,a1=5m/s2,a2=a3=13m/s2Bfor t<1sec,a1=5m/s2,a2=a3=0Cthe value of v is 5m/sDfor t>1sec,a1=a2=a3=2m/s2
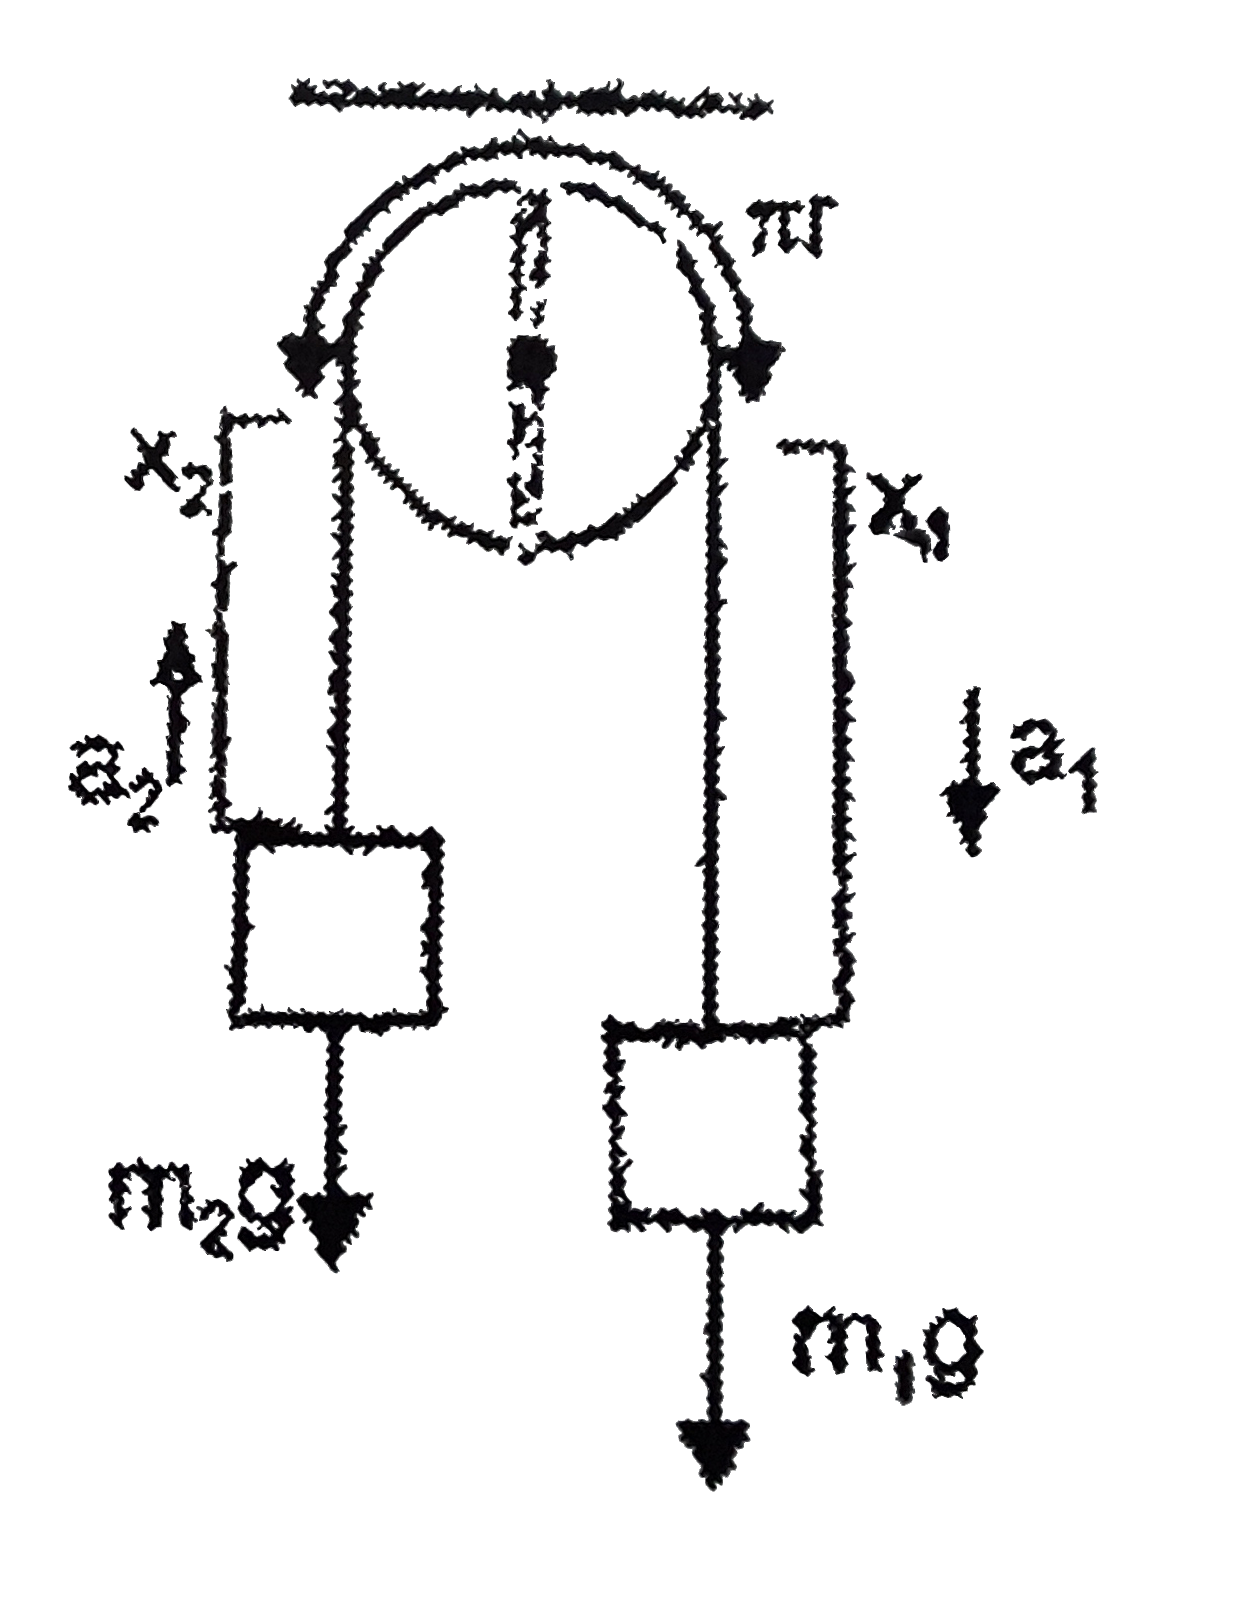
In the figure shown the masses are attached to the inextensible string. At any instant, let the positions of m1 and m2 be x1 and x2 respectively as shown in the Fig.
View SolutionThe slope of the line y=2020 is m1 and the slope of the line joining the points (−5,1) and (3,−5) is m2, and the x-intercept of line 2x−3y+5=0 is a, then the value of (m1×m2)a=
View SolutionIn the figure, m1 is at rest, find the relation among m1,m2 and m3 ? .
View SolutionFrom the point P(h, k) three normals are drawn to the parabola x2=8y and m1,m2 and m3 are the slopes of three normals
Find the algebraic sum of the slopes of these three normals.
View SolutionThree blocks are connected as shown in the figure

If m1=5kg,m2=10kgandm3=15kg, find the tension T1 given that T3=60N
View Solution

