Two charge +q1 and +q2 placed on x-axis at posiution A and B as shown in figure. Which graph best represent potential as a function of distance r from charge q1 
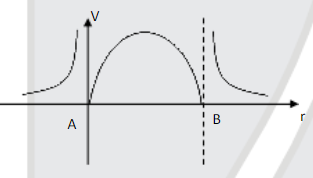
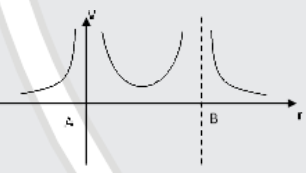
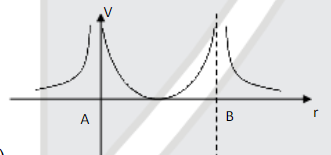
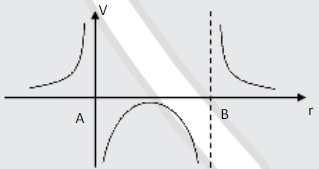
The correct Answer is:B
Step by step video, text & image solution for Two charge +q_1 and +q_2 placed on x-axis at posiution A and B as shown in figure. Which graph best represent potential as a function of distance r from charge q_1 by Physics experts to help you in doubts & scoring excellent marks in Class 12 exams.
Updated on:21/07/2023Topper's Solved these Questions
Similar Questions
Four point charges Q.q Q and q are placed at the corners of a square side 'a' as shown in the figures.
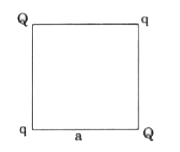
Find the Potential energy of this system.
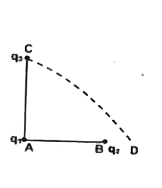
View SolutionTwo charges q1 and q2 are placed 30 cm apart, as shown in the figure. A third charge q, is moved along the arc of a circle of radius 40 cm from C to D. The change in the potential energy of system is kq34πε0, then the value of k is
View Solution
Knowledge Check
Two point charges q1andq2 are placed in an external uniform electric field as shown in figure. The potential at the location of q1andq2 are V1andV2, i.e., V1andV2 are potentials at location of q1andq2 due to external unspecified charges only. Then electric potential energy for this configuration of two charged particle is
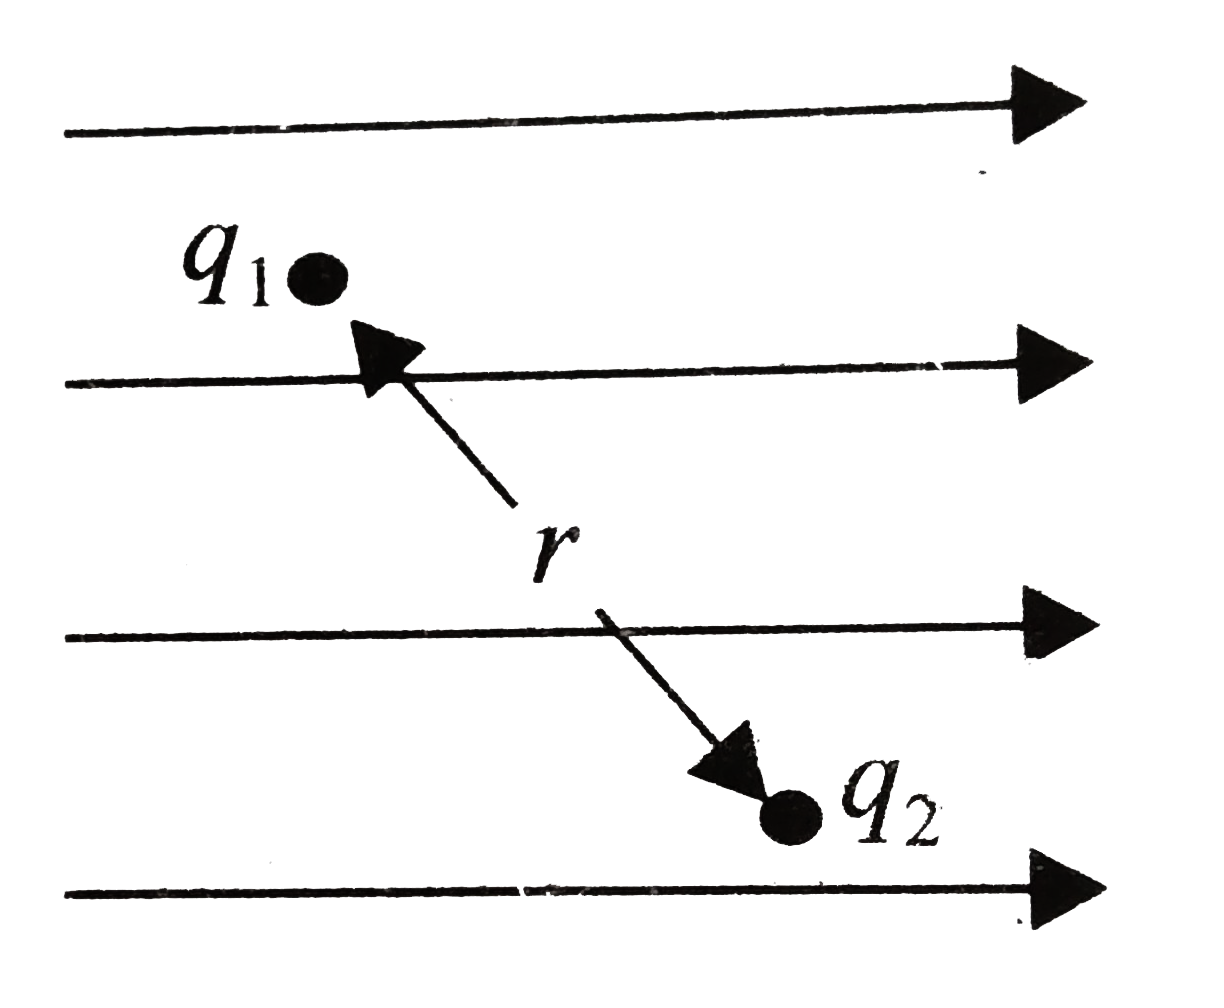 Aq1V1+q2V22Bq1V1+q2V2Cq1V1+q2V2+q1q24πε0rDq1q24πε0r
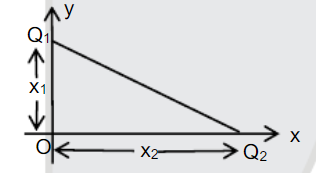
Two charge Q1 and Q2 are placed in xy plane at a distance x1 and x2 from origin a shown in figure. if electric field at O is same for both charge then find ratio Q1 and Q2.Ax1x2Bx2x1Cx21x22Dx31x32Two concentric spherical shells of radii R and 2R have charges Q and 2Q as shown in figure

If we draw a graph between potential V and distance r from the centre, the graph will be likeA B
B C
C D
D
Along the x-axis, three charges q2,−q and q2 are placed at x=0,x=a and x=2a respectively. The resultant electric potential at a point P located at a distance r from the charge −q, (r>>a) is : ( ε0 is the permittivity of free space)
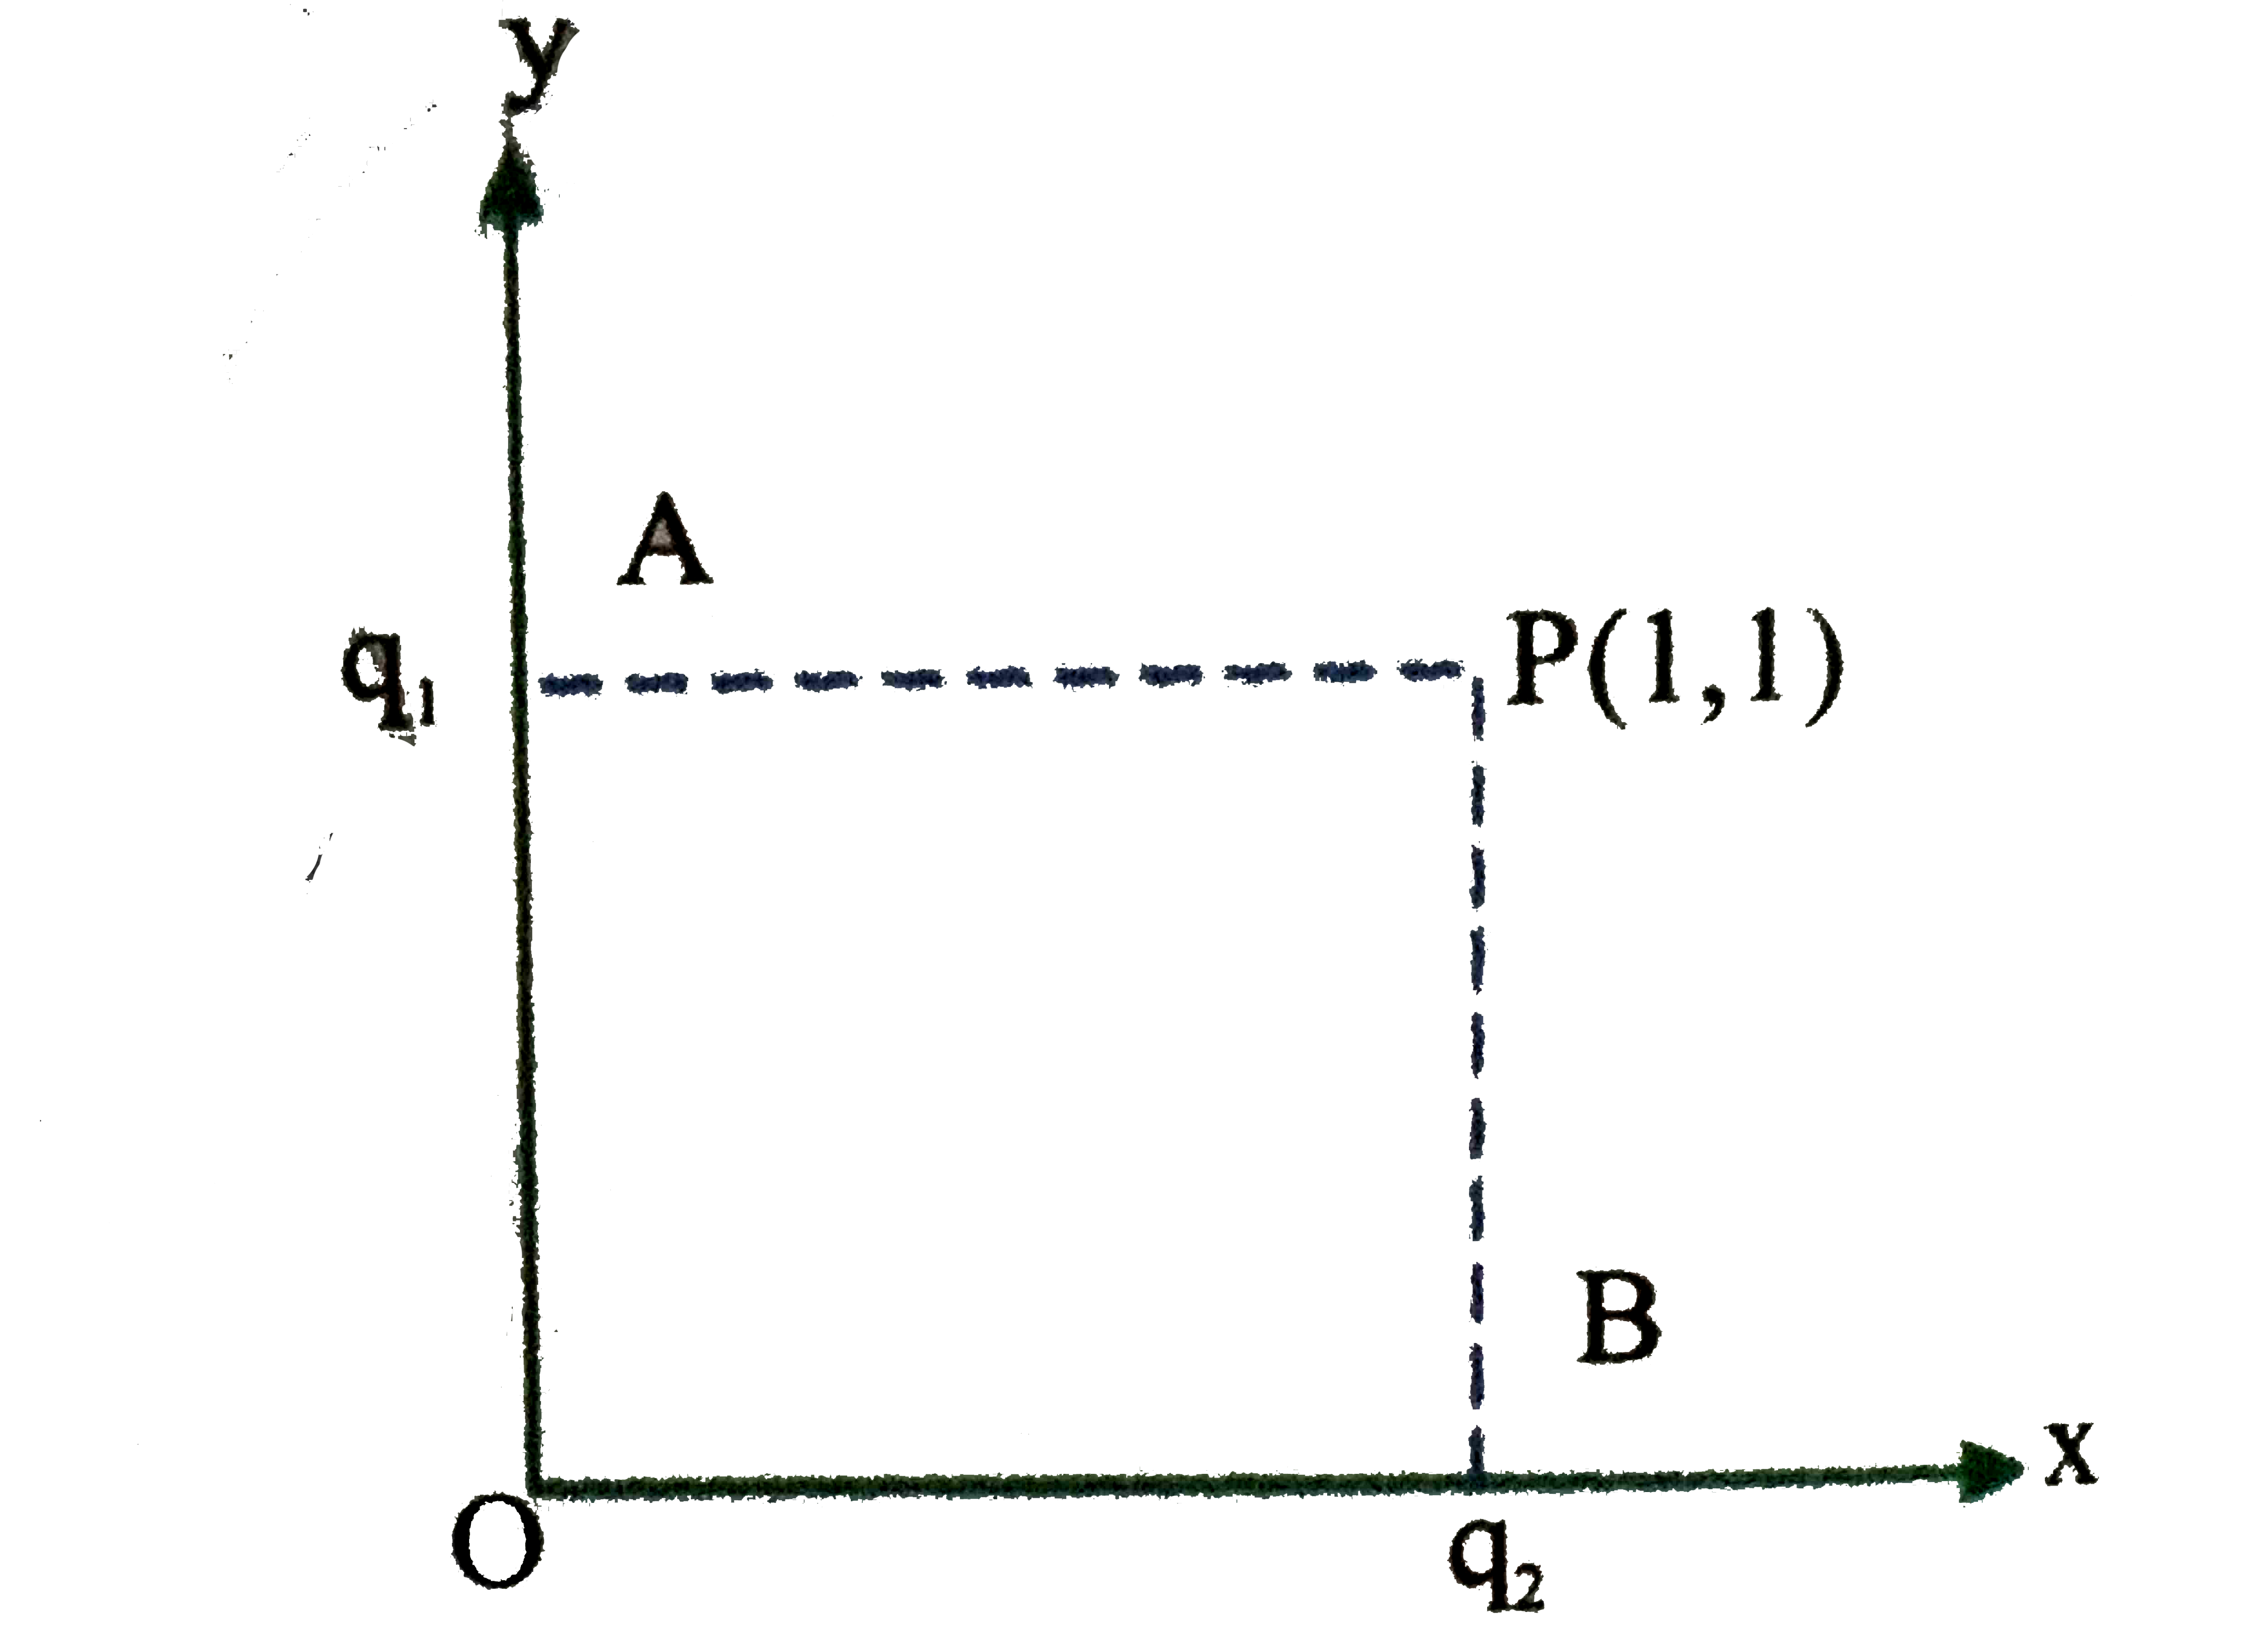
View SolutionTwo points charge q1 and q2(=q1/2) are placed at points A(0,1) and B(1,0) as shown in the figure.The electric field vector at point P(1,1) makes an angle q with the x-axis ,then the angle q is
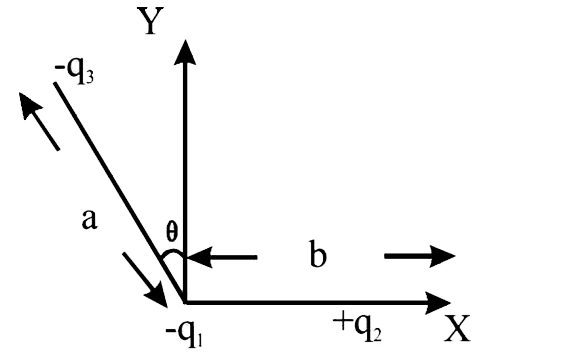
View SolutionThree charges −q1, +q2 and −q3 are placed as shown in the figure. The x-component of the force on −q1 is proportional to
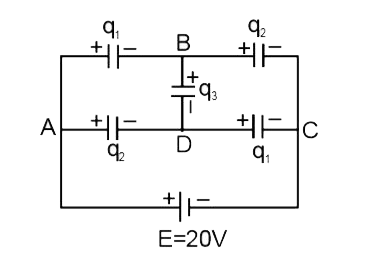
View SolutionThe value of charge q1,q2andq3 as shown in the figure are
View SolutionTwo concentric spherical shells of radii R and 2R have charges Q and 2Q as shown in figure

If we daw a graph between electric field E and distance r from the centre, it will be like
View Solution
