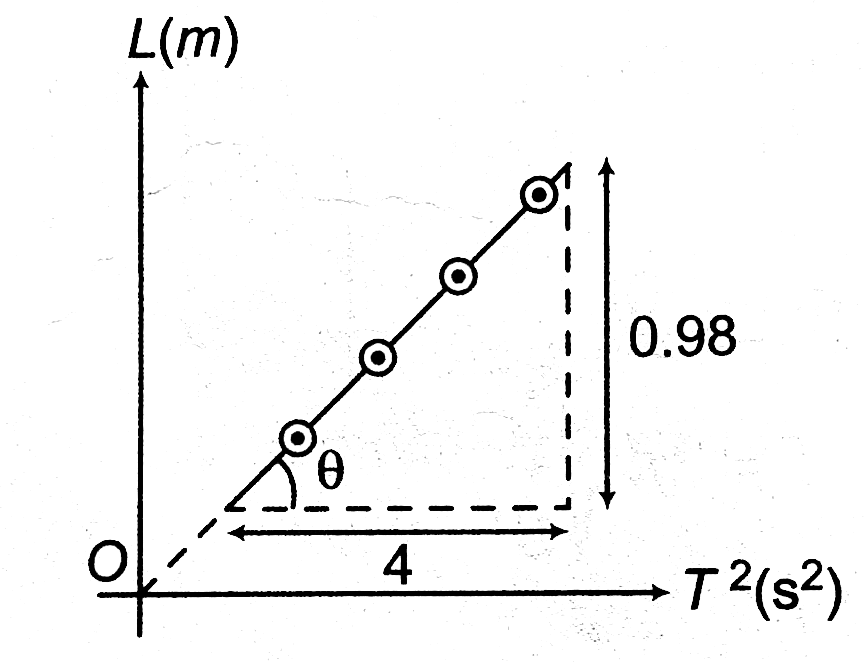
For different values of L, we get different values of T2. The graph between L versus T2 ia as shown in figure. Find the value of 'g' from the given graph.(Take (π)2=10).
 .
.
Video Solution
Text Solution
L=(g4π2)T2 so slope of curve between Lv/sT2=g4π2
slope =0.492=g4π2⇒g=9.8m/sce2 .
|
Topper's Solved these Questions
- EXPERIMENTAL PHYSICSBook:RESONANCEChapter:EXPERIMENTAL PHYSICSExercise:Exercise
Explore 12 Videos
- EXPERIMENTAL PHYSICSBook:RESONANCEChapter:EXPERIMENTAL PHYSICSExercise:Exercise -1 PART
Explore 1 Video
- ELECTROSTATICSBook:RESONANCEChapter:ELECTROSTATICSExercise:HLP
Explore 39 Videos
- GEOMATRICAL OPTICS Book:RESONANCEChapter:GEOMATRICAL OPTICS Exercise:Advance level Problems
Explore 35 Videos
Similar Questions
Knowledge Check
The graph between L and T2 is
A B
B C
C D
D
The graph between L and T2 is
A B
B C
C D
D
The graph between L and T is correctly shown by
A B
B C
C D
D
P-T graphs of an ideal gas are as shown in figures-2.42 below. Choose the wrong statement from the options given:
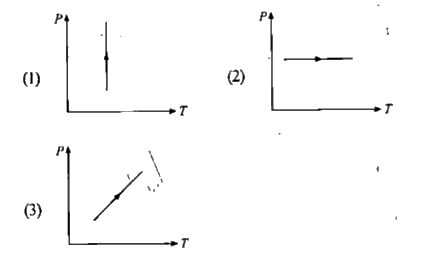
View SolutionThe graph between L and Tis correctly shown by (Fig. 7.2)
View Solution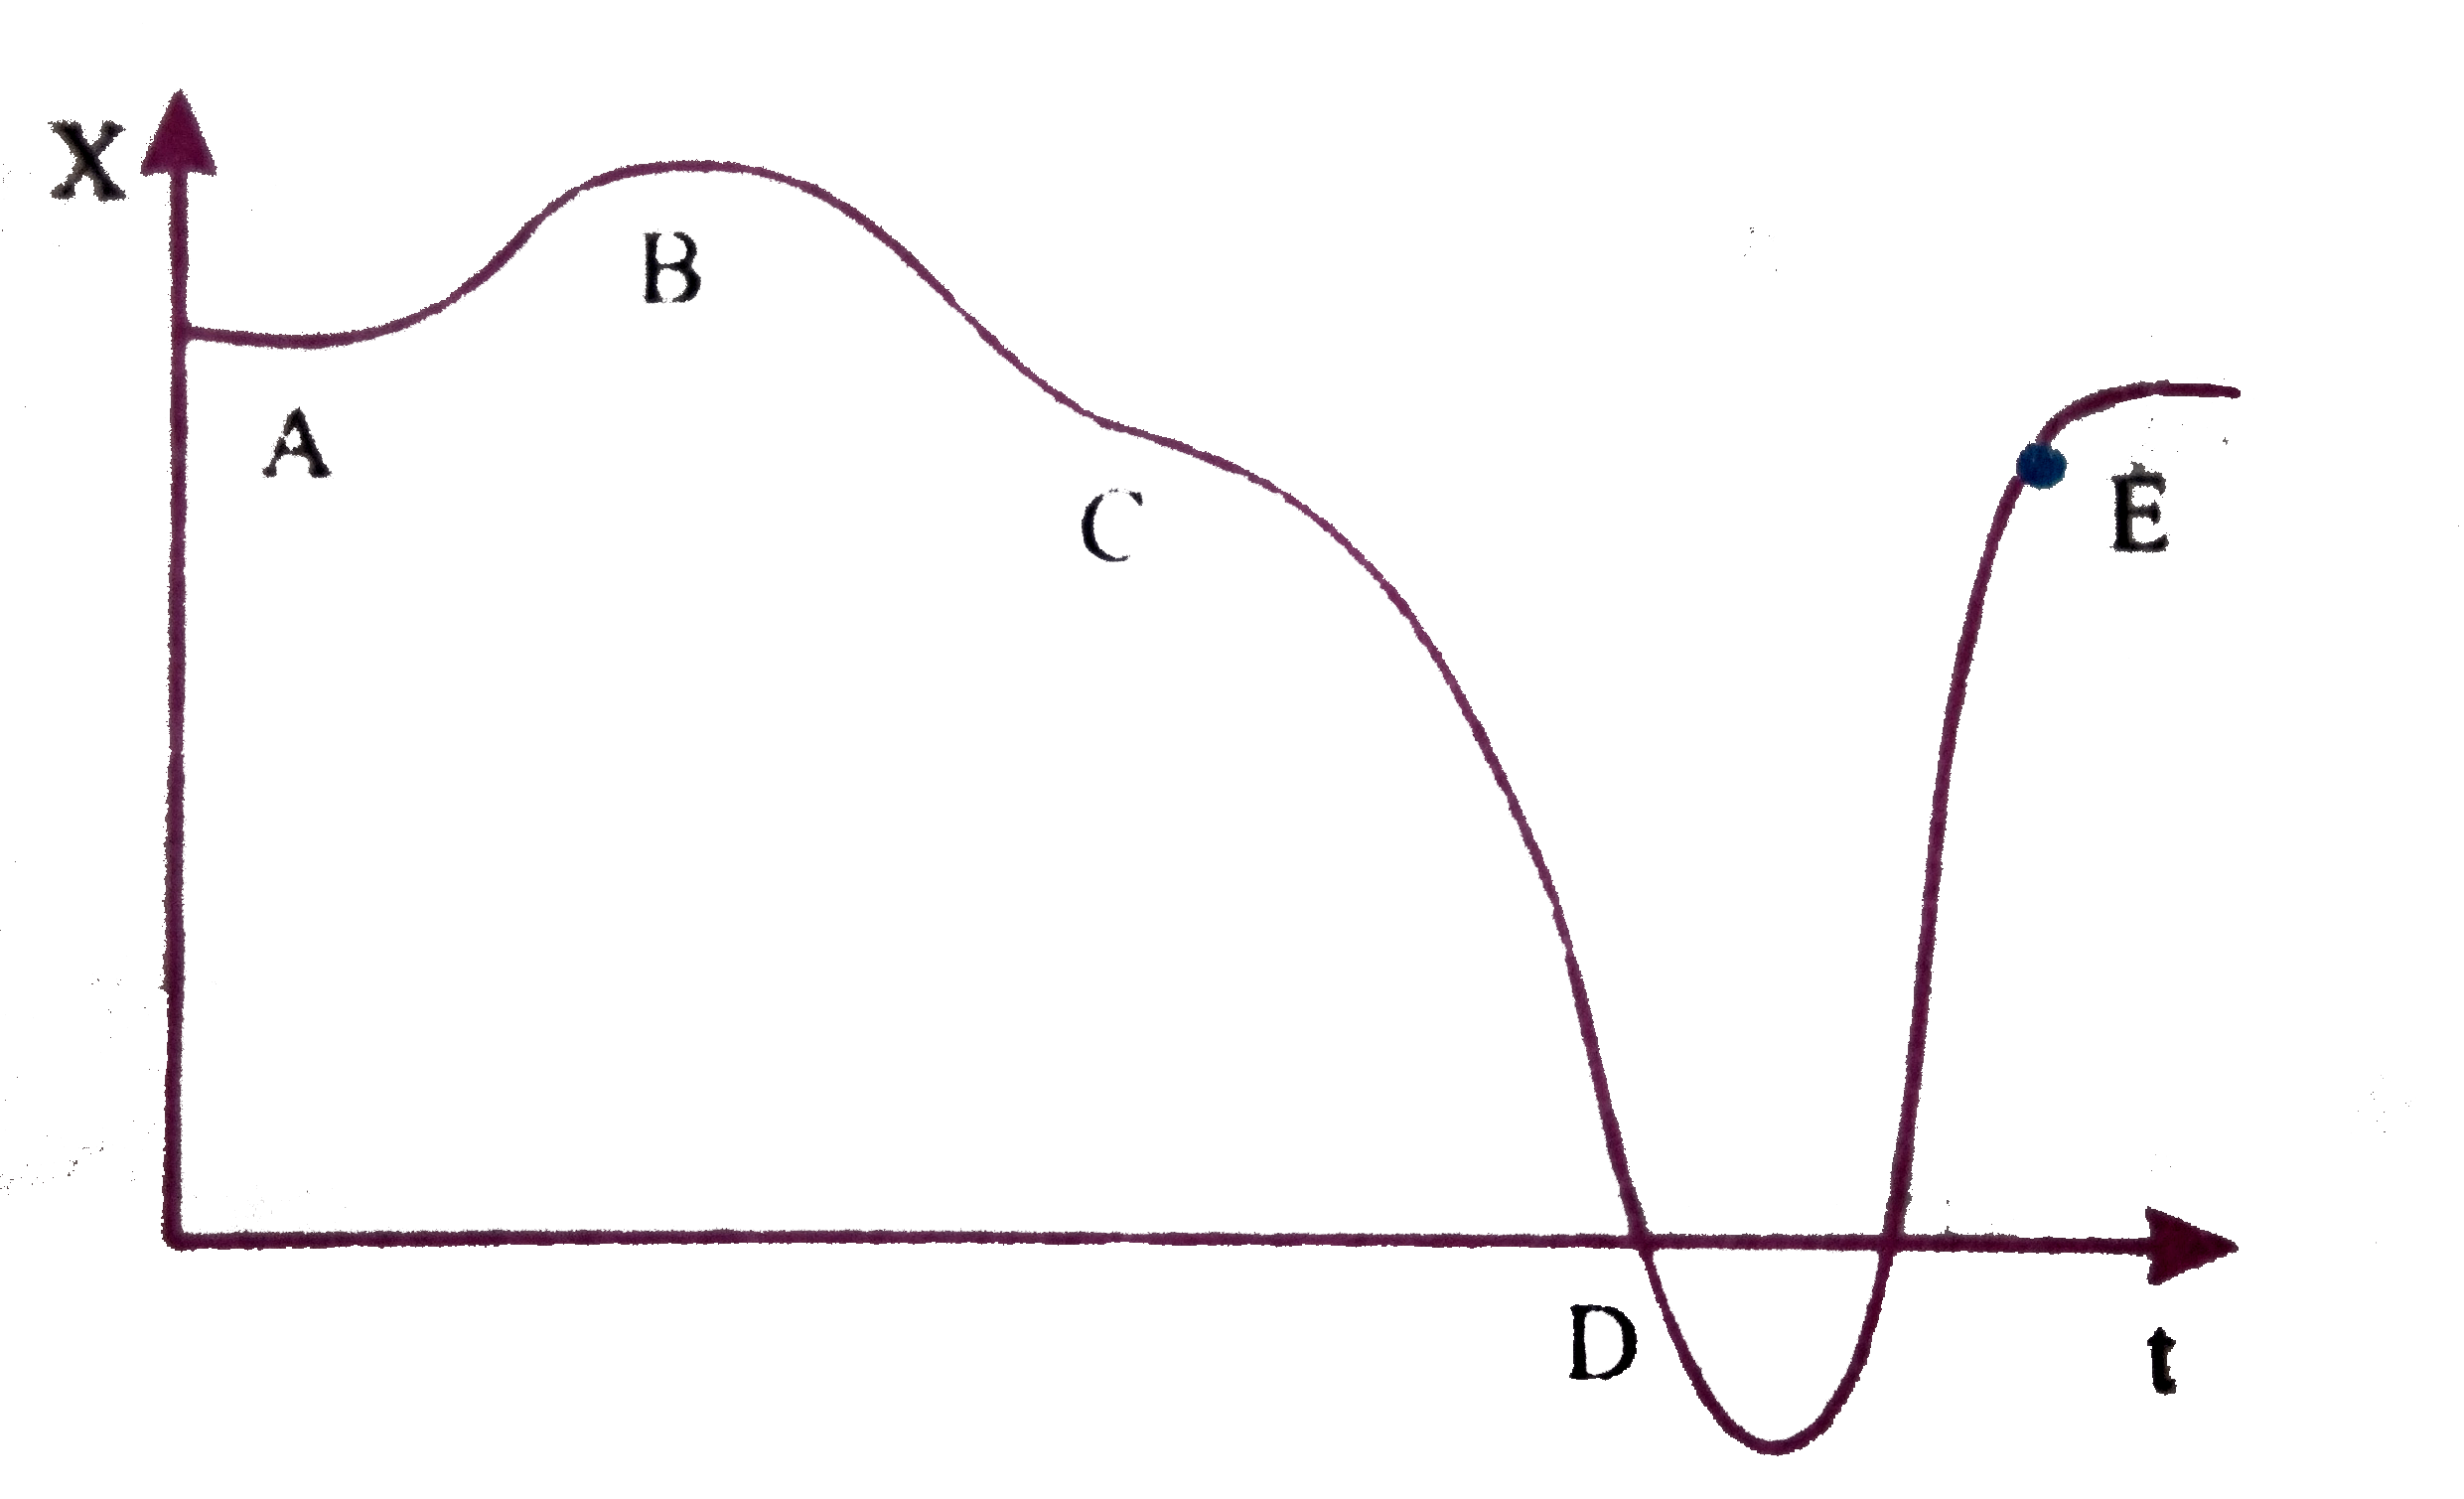
A graph of x versus t is shown in figure. Choose correct alternative from below.
View SolutionWhile determining the value of g using simple pendulum, we plot a graph between l and T2 which is
View SolutionFor an orbital the graph between ψ(r) and r (distance from nucles) is :
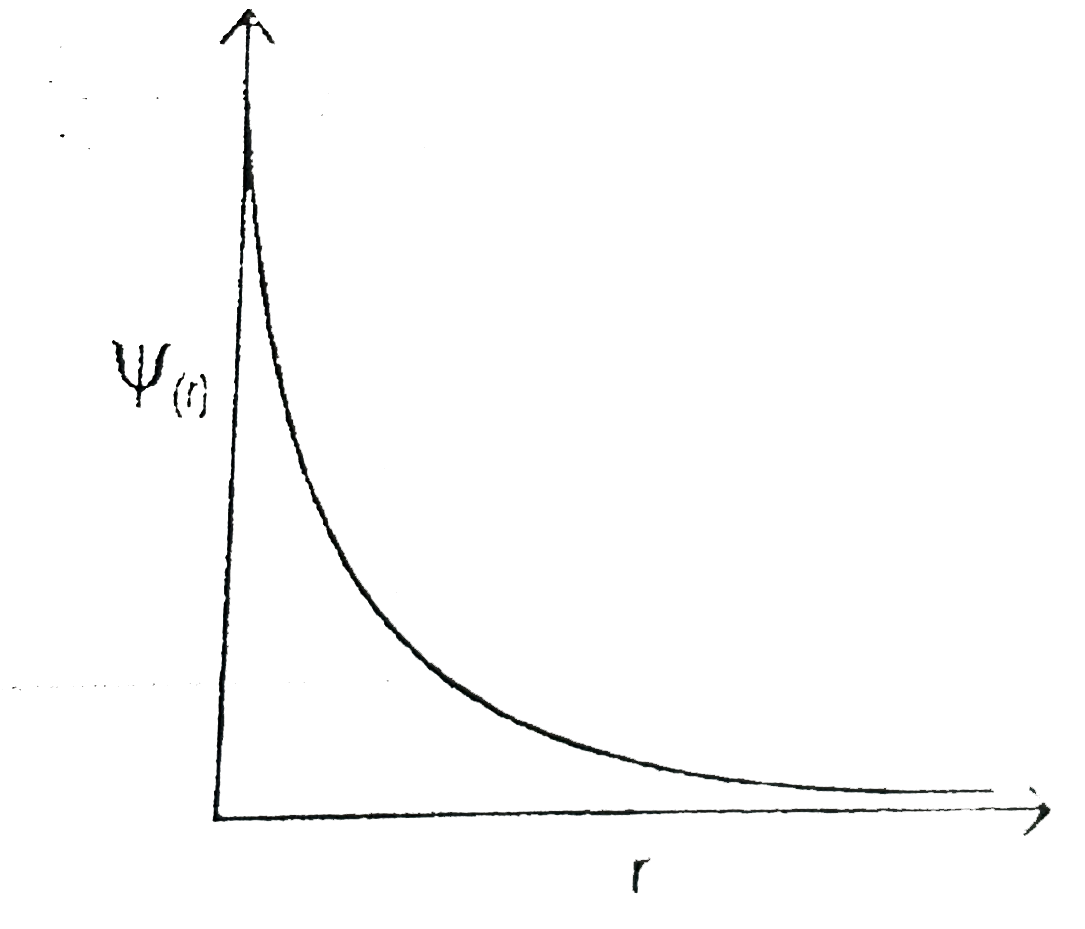
Find the value of n+l of the orbital.
View Solution
