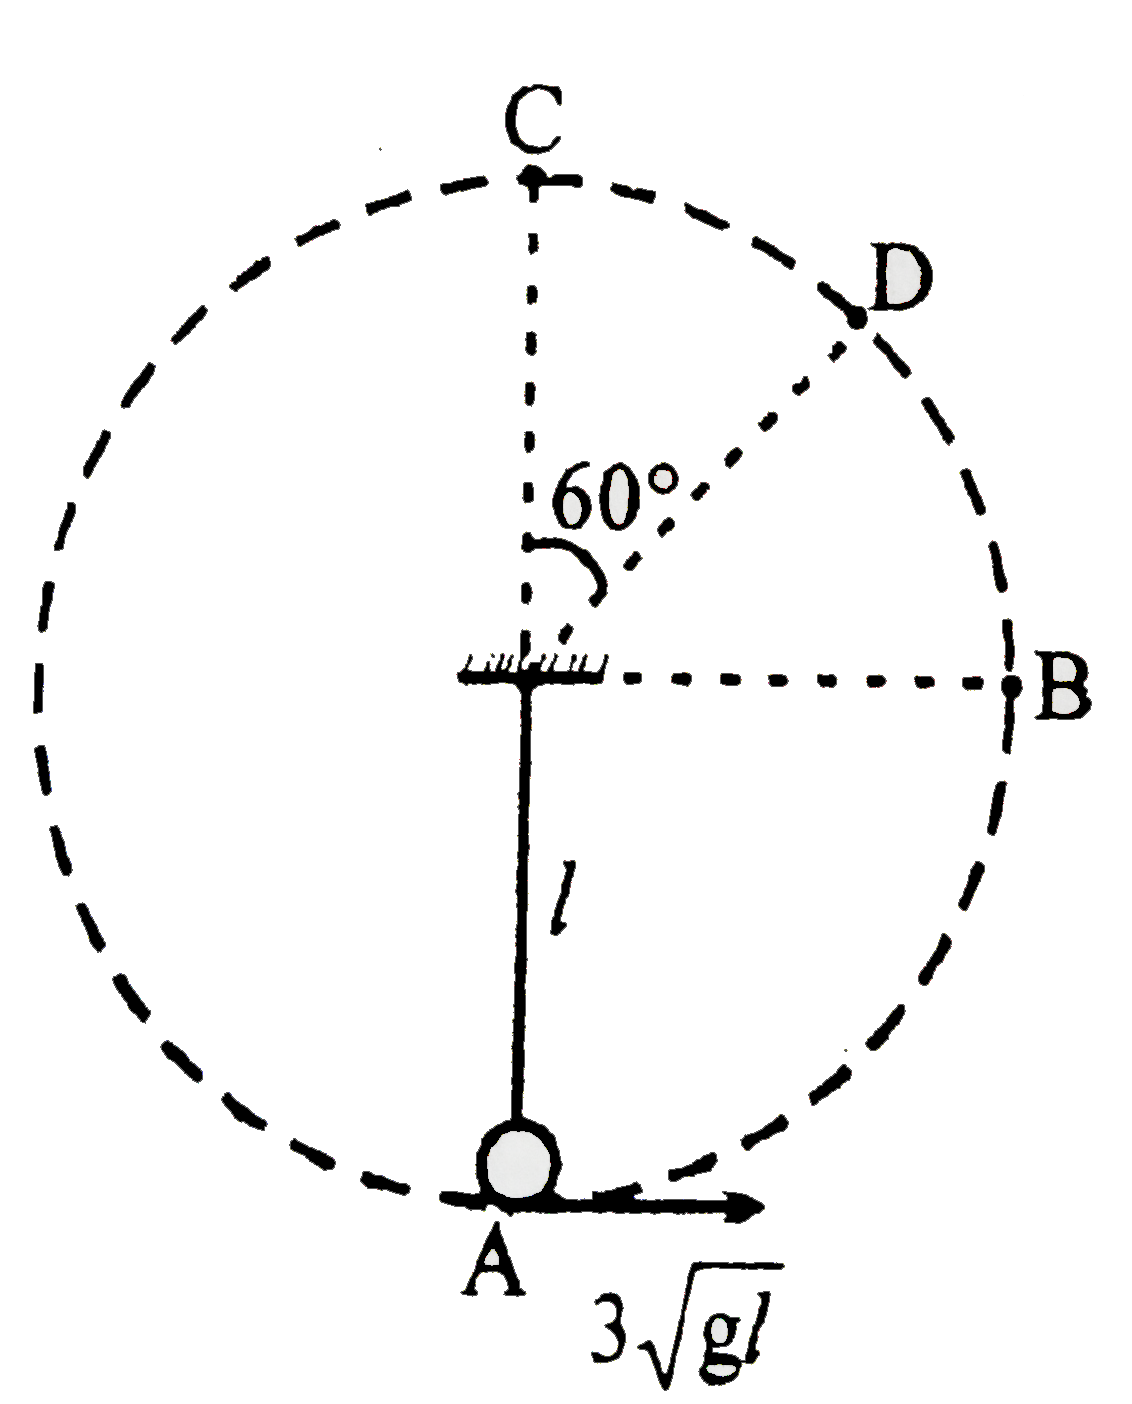
Velocity time graph of a particle in straight liine motion is in shape of a semicircle of radius R as shown in figure Its averge acceleration from t = 0 to t = R is :
0m/s2
1m/s2
Rm/s2
2Rm/s2
The correct Answer is:B
aavg=Δ→vΔt=0−0Δt=0
Topper's Solved these Questions
- TEST PAPERSBook:BANSALChapter:TEST PAPERSExercise:PHYSICS PART (A)
Explore 32 Videos
- TEST PAPERSBook:BANSALChapter:TEST PAPERSExercise:PHYSICS PART (B)
Explore 3 Videos
- TEST PAPERSBook:BANSALChapter:TEST PAPERSExercise:PHYSICS PART- C
Explore 4 Videos
- SEMICONDUCTORSBook:BANSALChapter:SEMICONDUCTORSExercise:CBSE Question
Explore 32 Videos
Similar Questions
2.The velocity-time (v-t) graph for a particle in straight line motion is given below the corresponding acceleration time graph will be?
View SolutionVelocity - time (V–t) graph of a particle moving in a straight line is as shown in the figure. The sign of acceleration in regions OP, PQ, QR and RS respectively are
View Solution
Knowledge Check
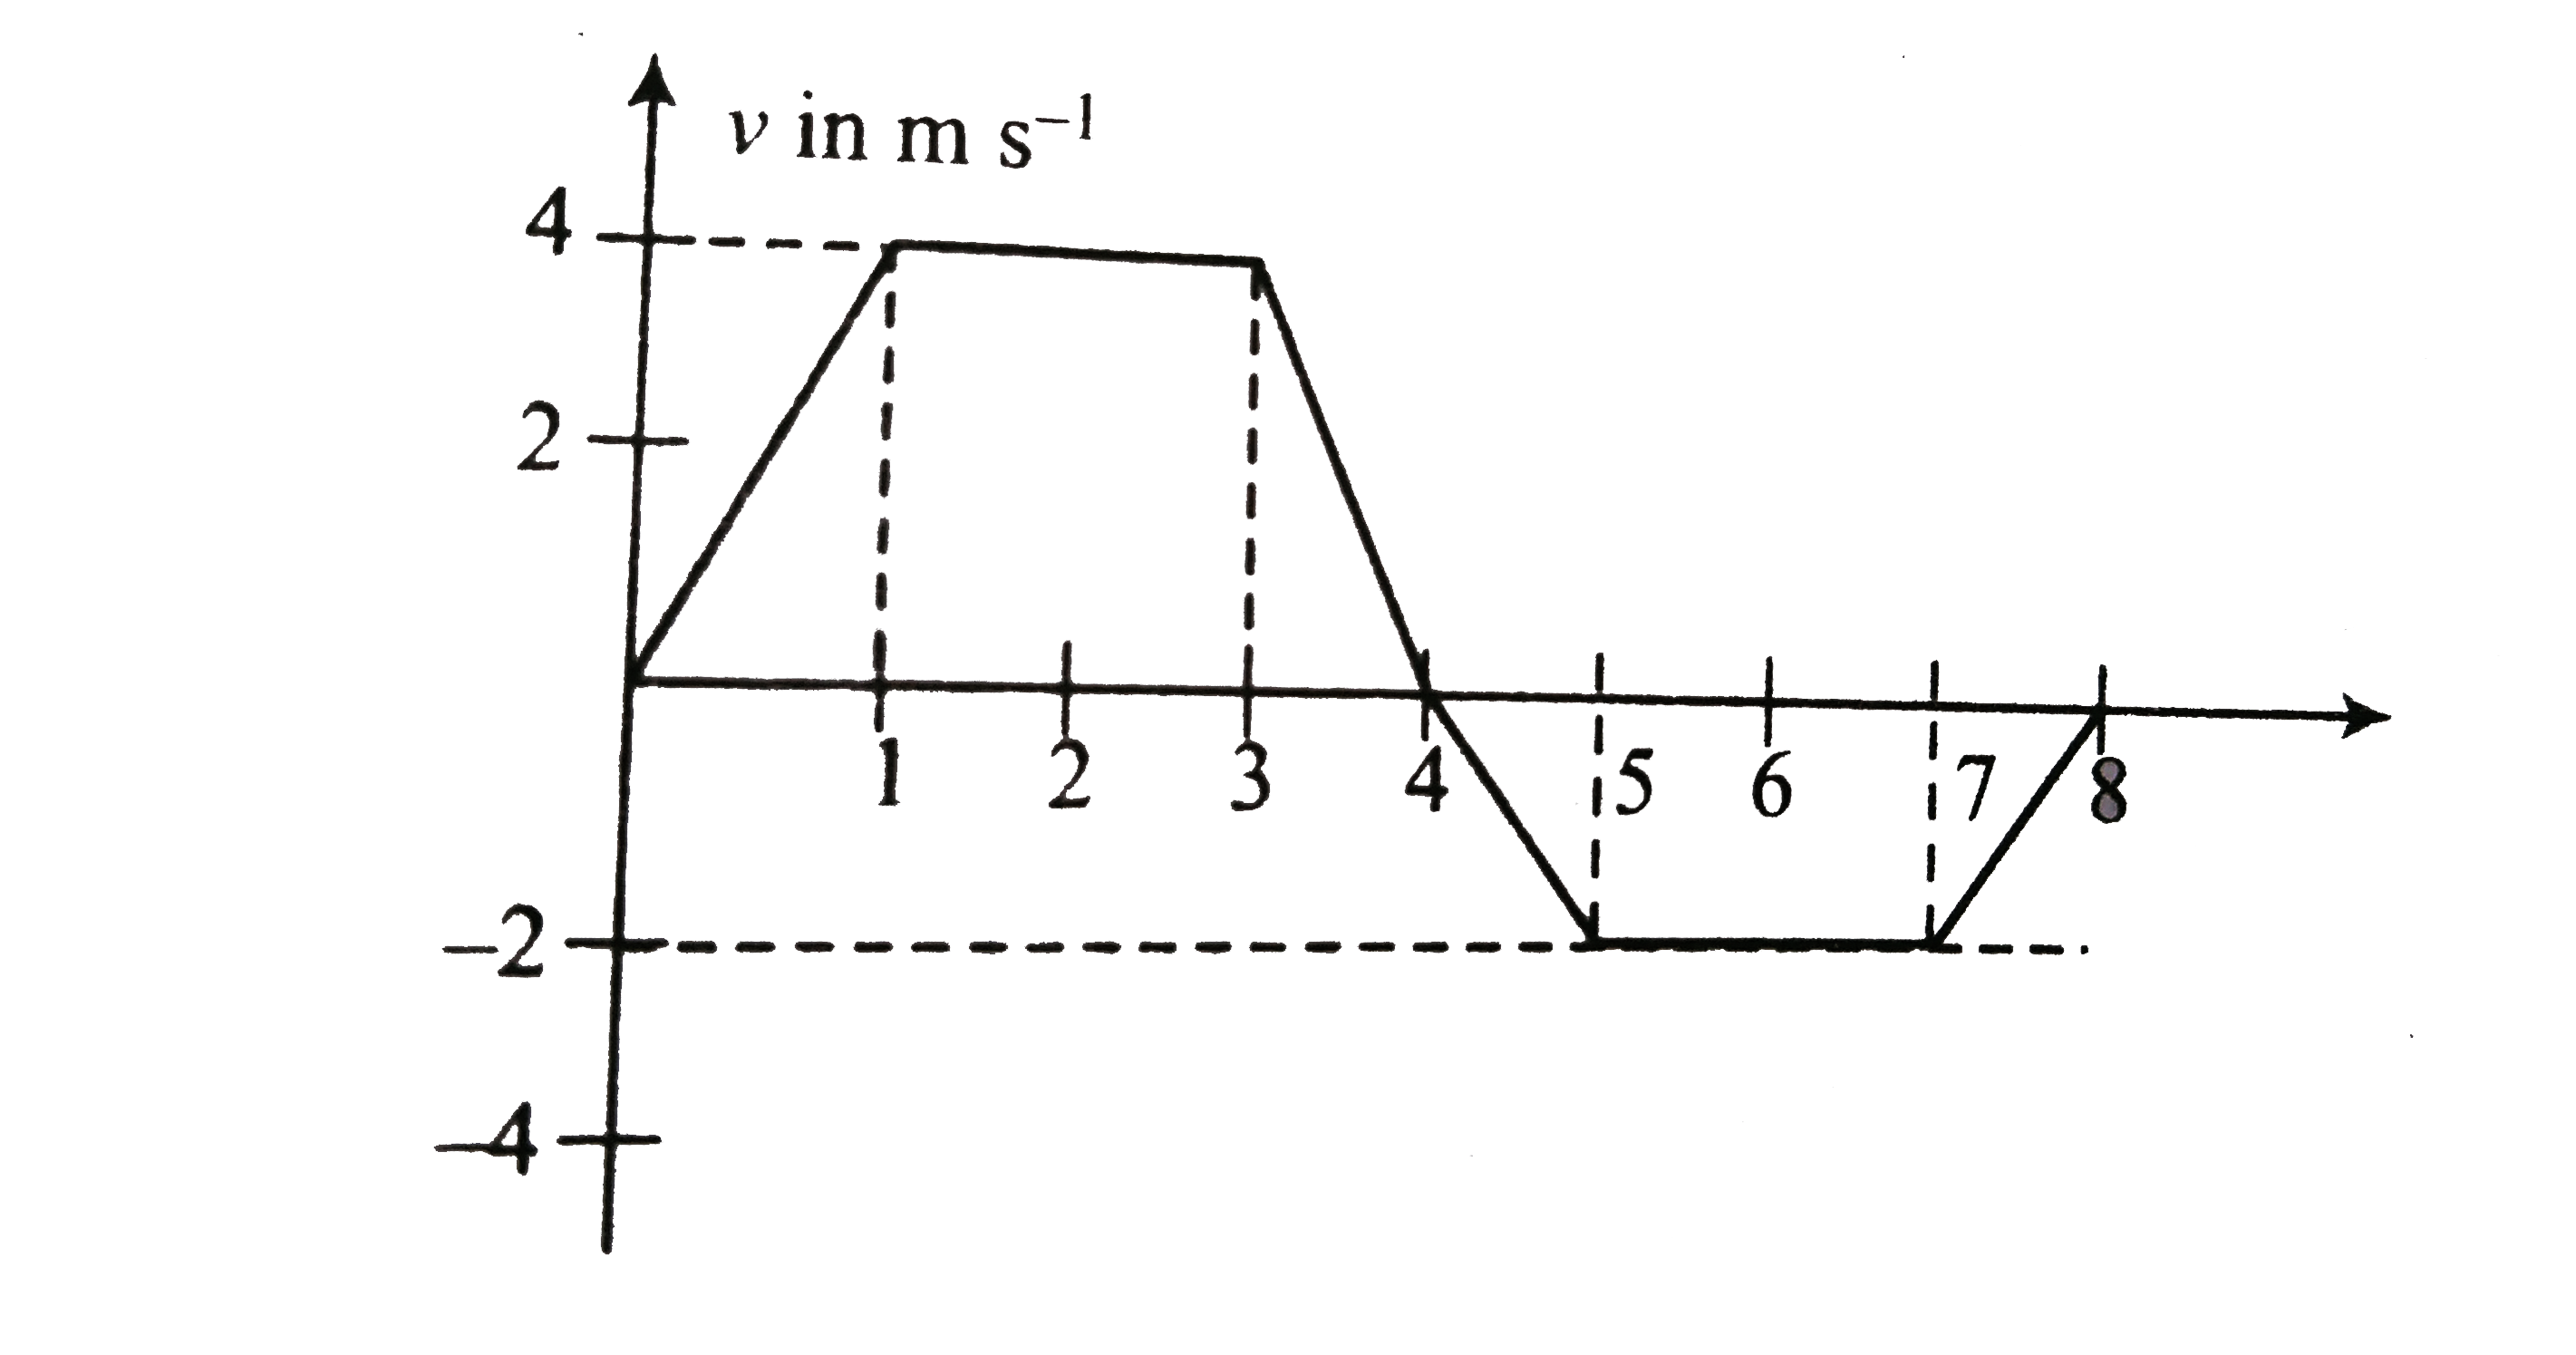
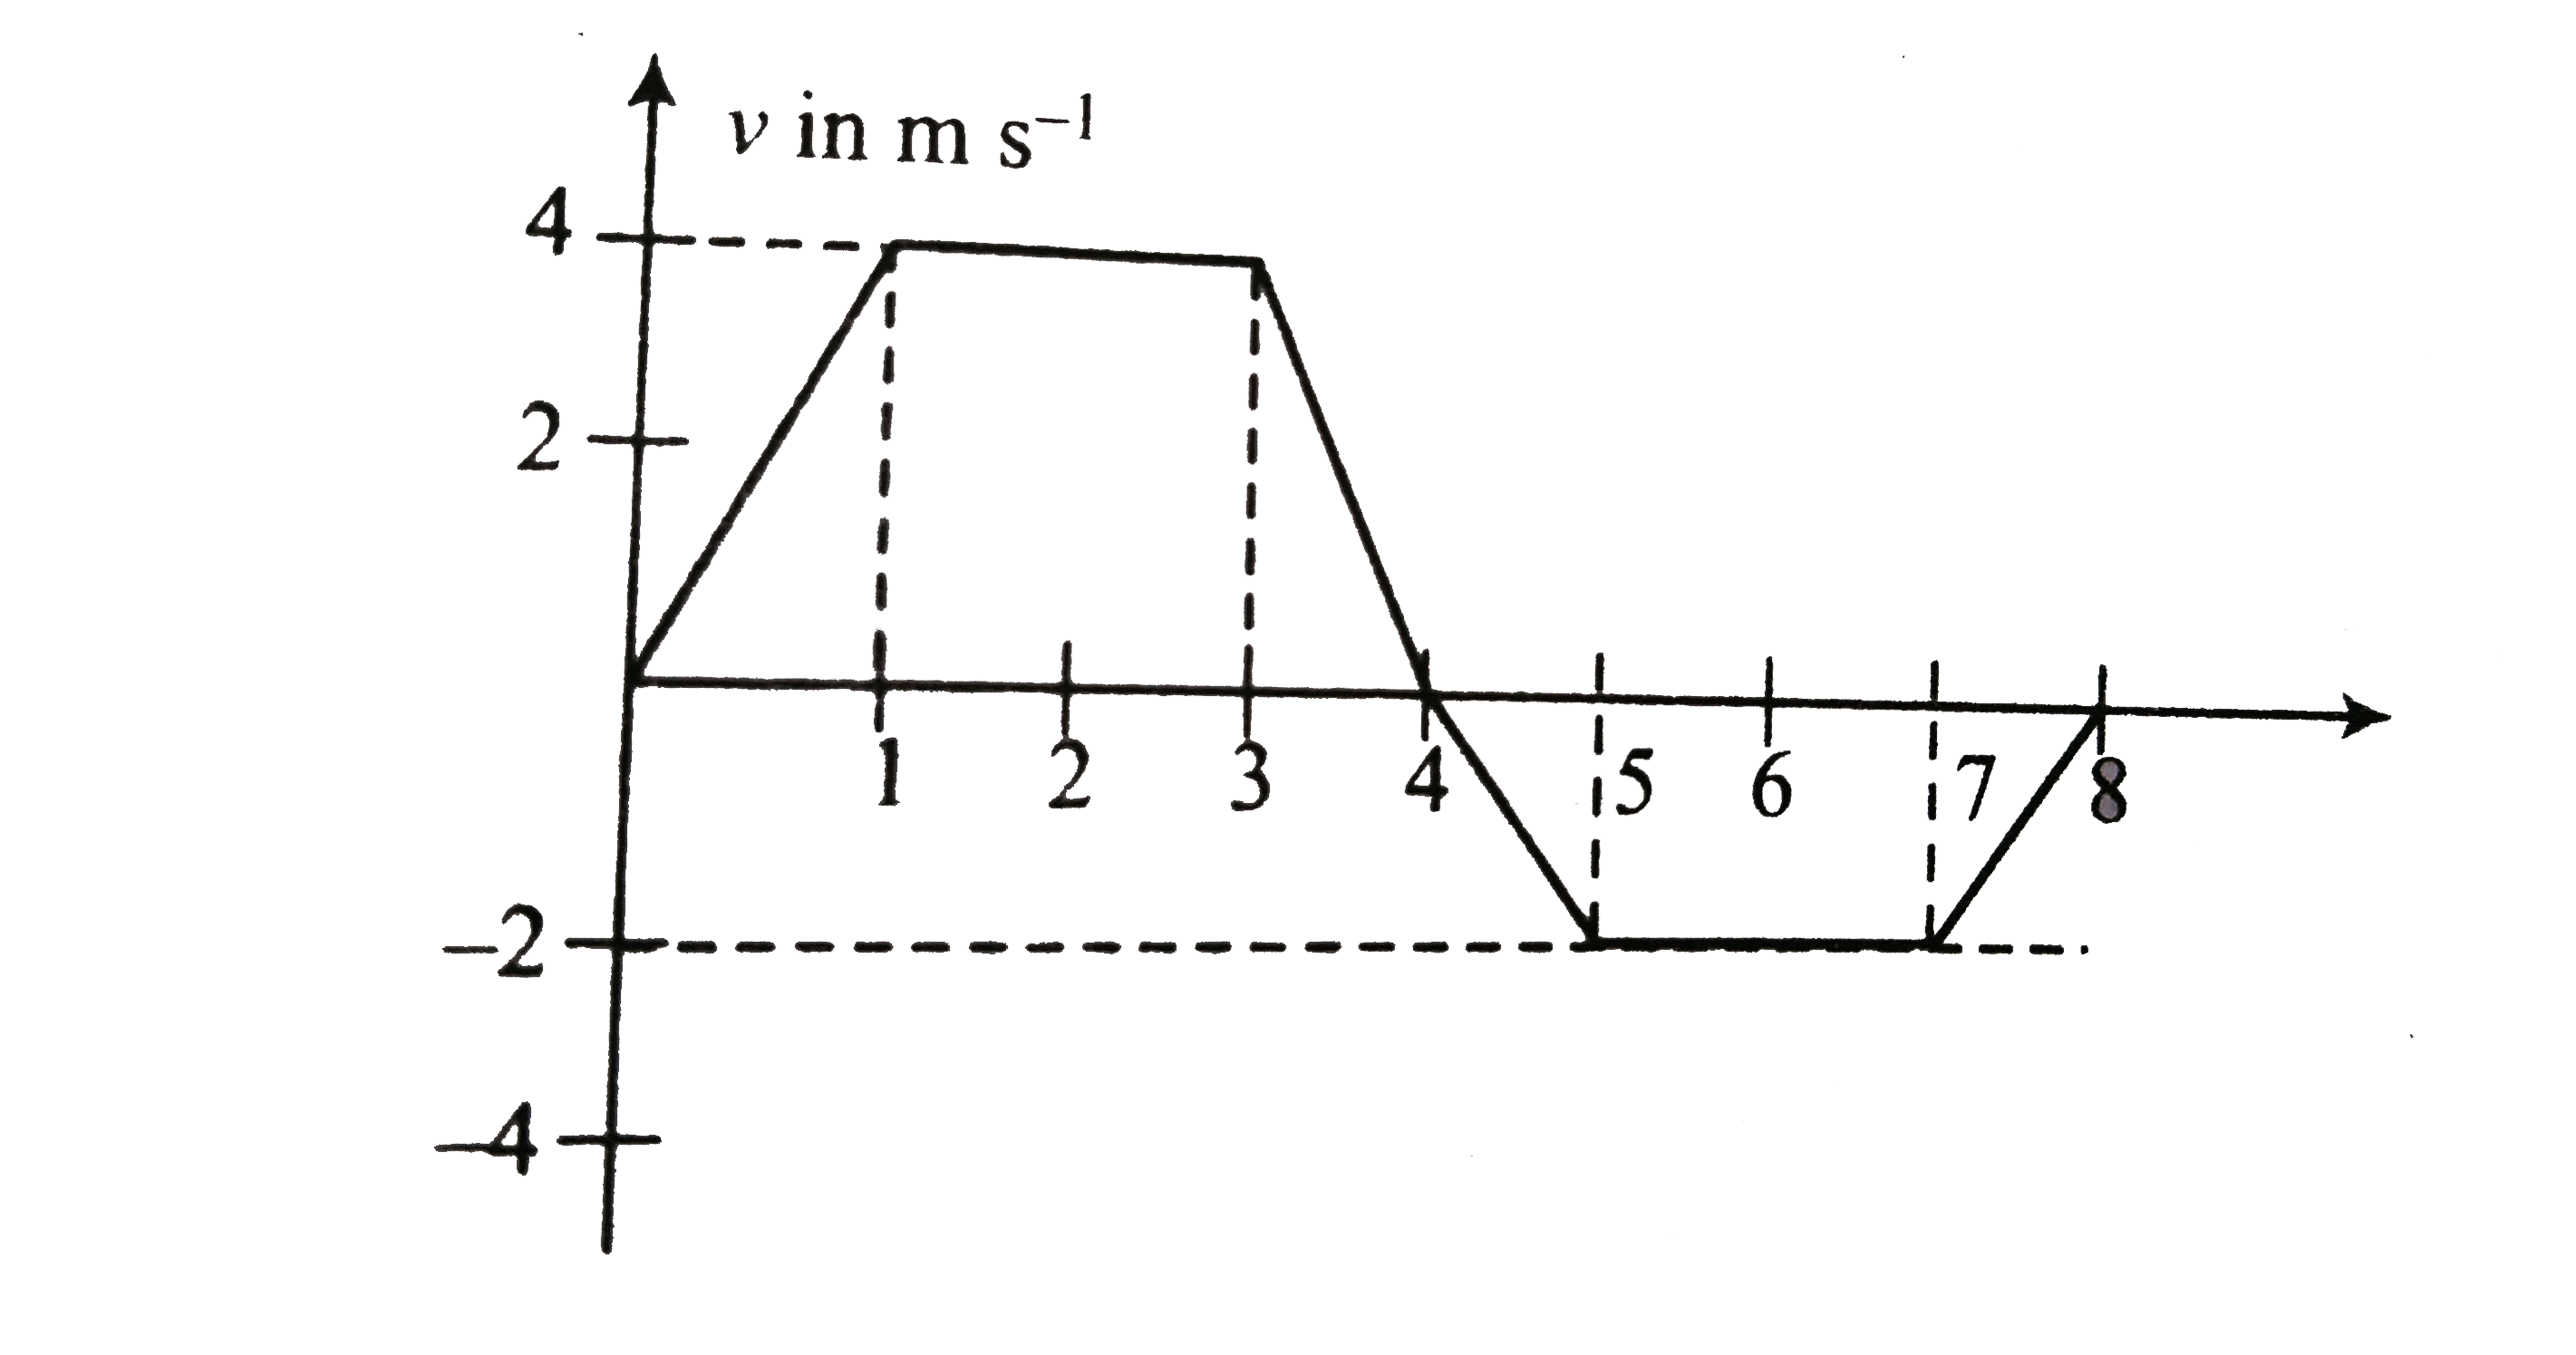
The velocity-time graph of a particle in straight line motion is veloity-time graph of a particle in straight line motion is shown in. The particle starts its motion from origin.
 .
.
Find the average acceleration from 2s to 6s.A−2ms−2B−3/2ms−2C2ms−2D3/2ms−2The velocity-time graph of a particle in straight line motion is veloity-time graph of a particle in straight line motion is shown in. The particle starts its motion from origin.
 .
.
The distance of the particle from the origin after 8s is .A18mB16mC8mD6mVeolocity-time graph of a particle undergoing rectilinear motioin is plotted upto t=t4 as shown in the figure. Average acceleration of the particle is zero in the time internal between
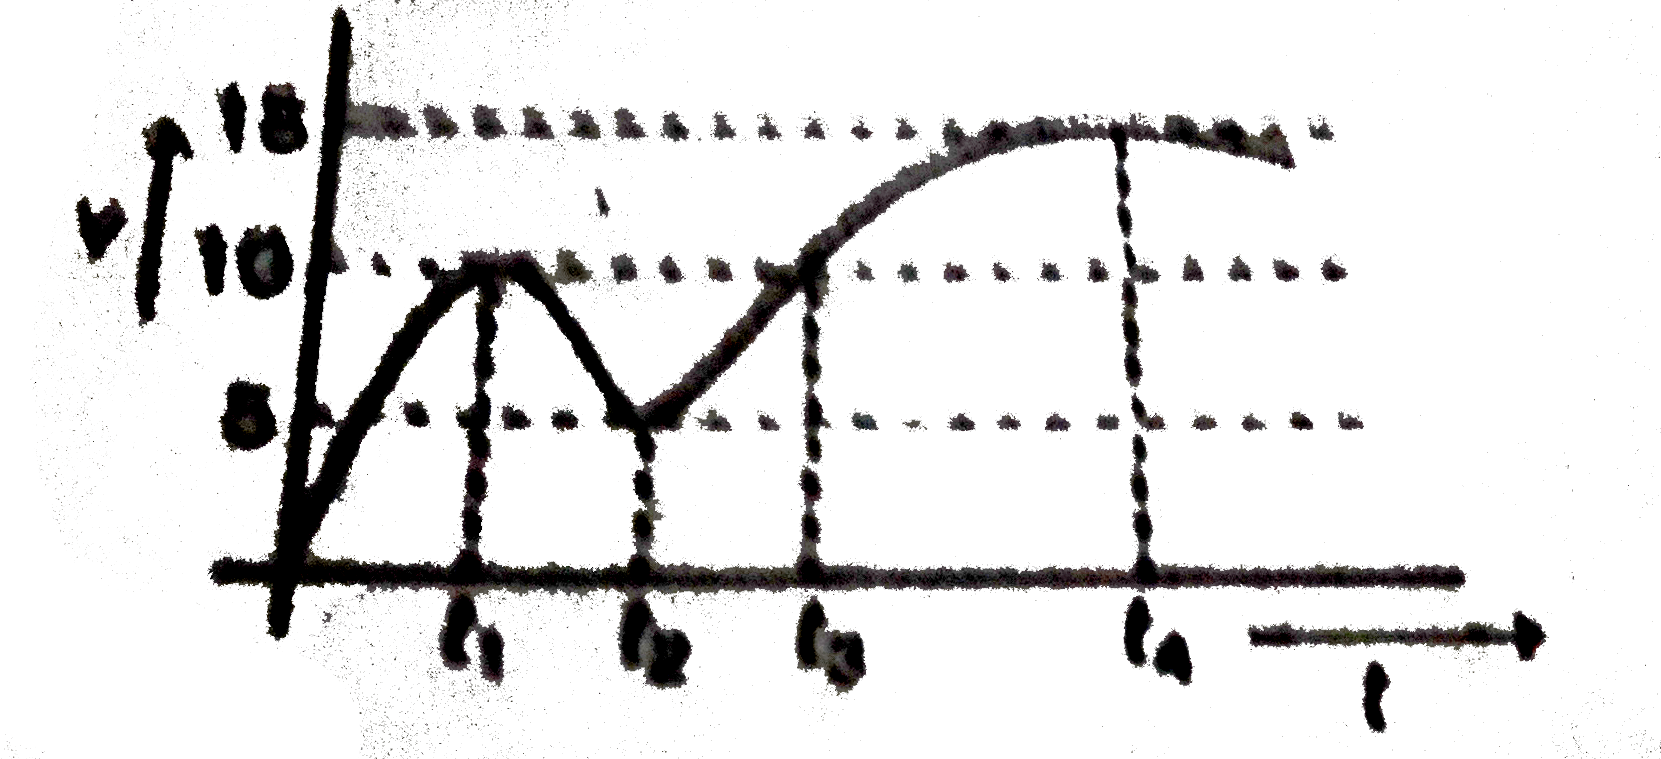 A0 and t1Bt1 and t2Ct1 and t3Dt2 and t4
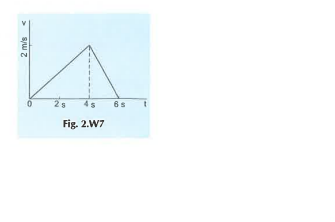
The velocity-time graph of a particle moving along a straight line is shown in Figure 2.W7.Is the motion uniform?
View SolutionVelocity-time graph of a particle moving in a straight line is shown in figure. In the time interval from t=0 to t=14s, find
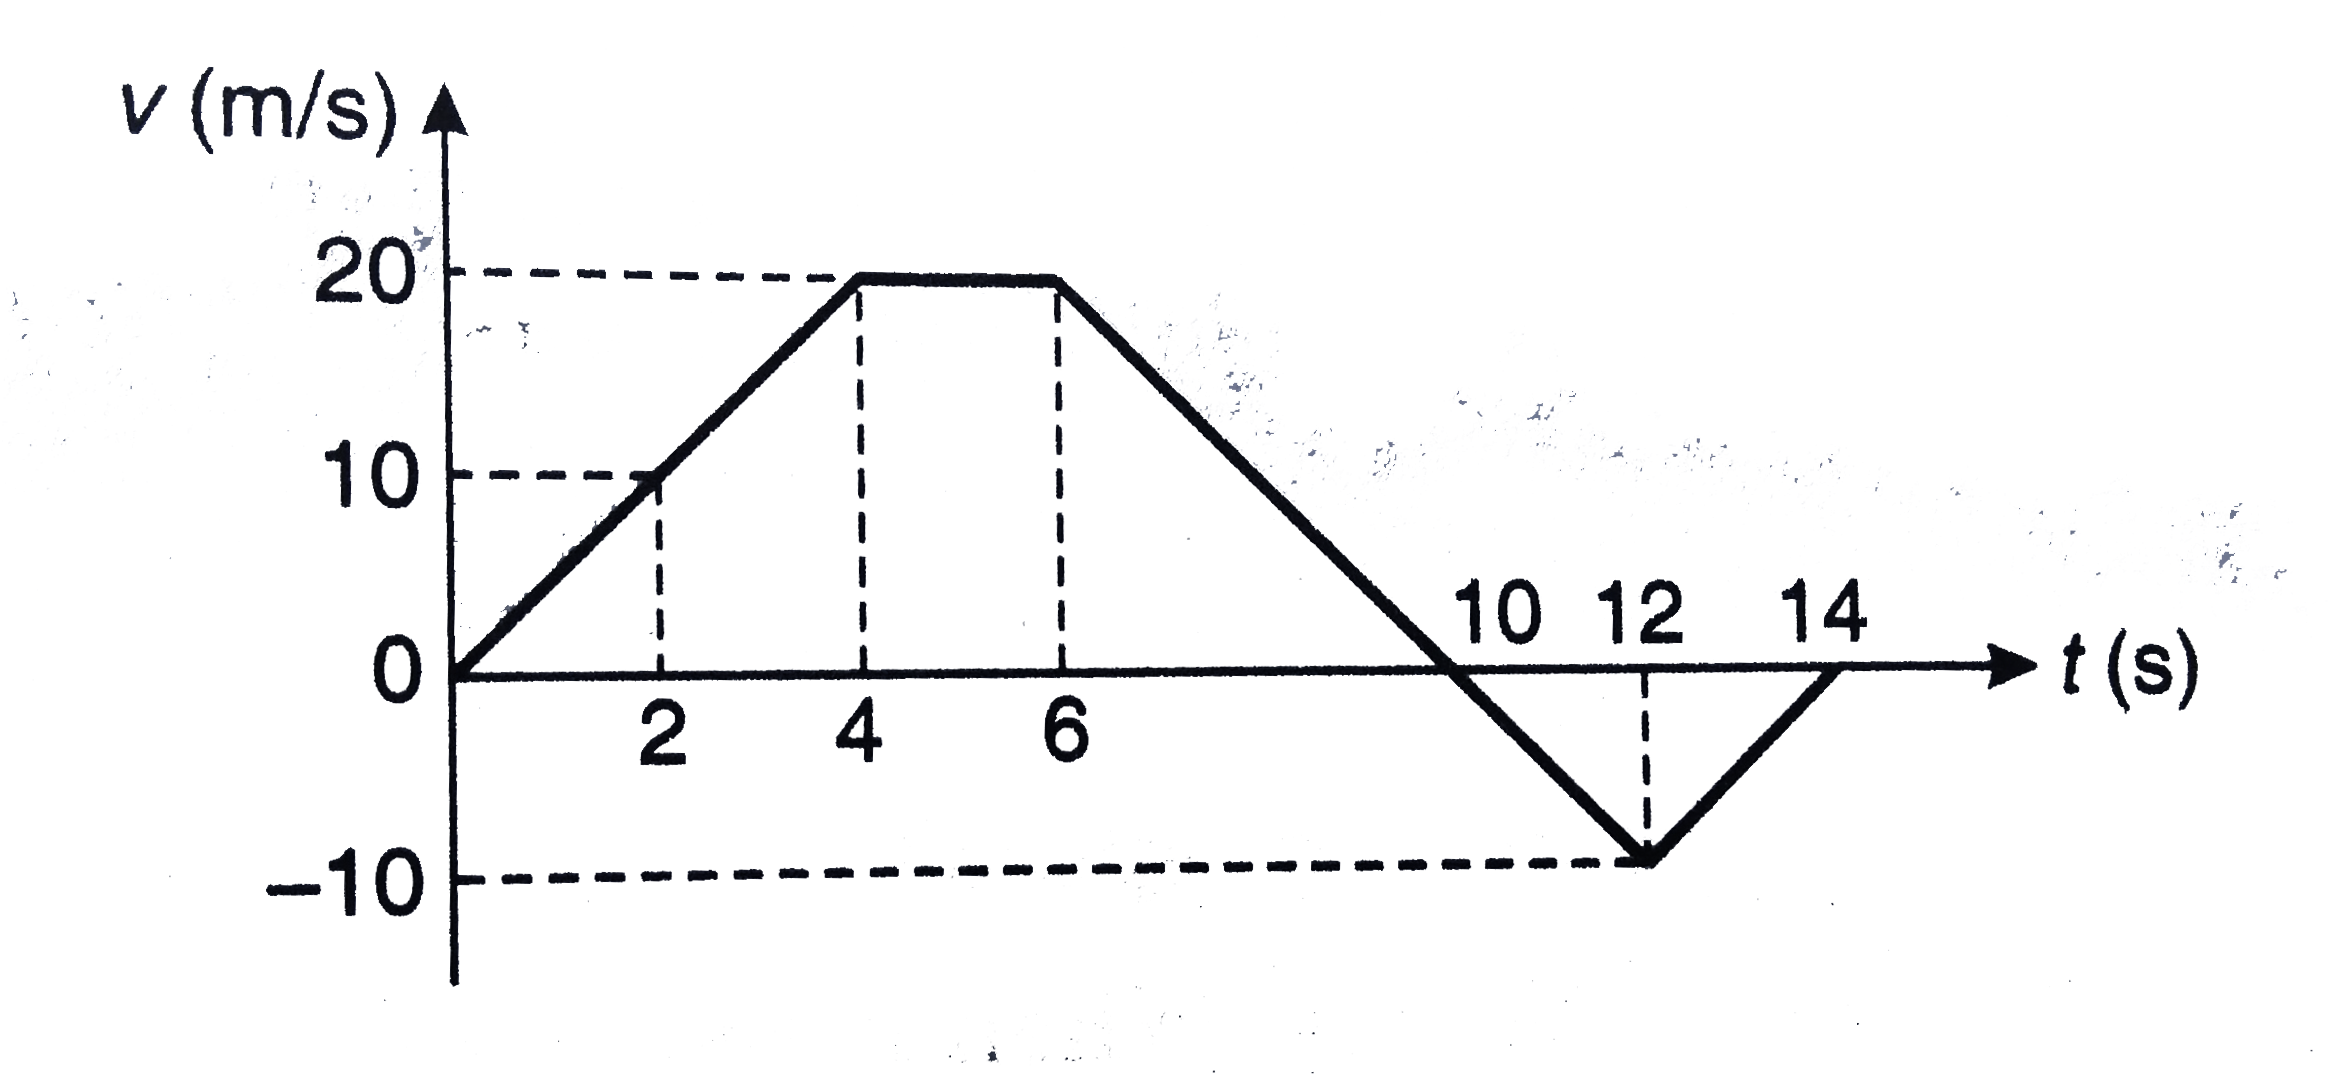
(a) average velocity and
(b) average speed of the particle.
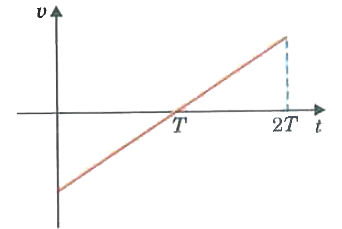
View SolutionVelocity-time graph for a particle is shown in following figure for time interval 0 to 2T.
View SolutionThe velocity-time graph of a particle moving along a straight line is shown is . The rate of acceleration and deceleration is constant and it is equal to 5ms−2. If the a average velocity during the motion is 20ms−1, Then
 .
.
The value of t is.
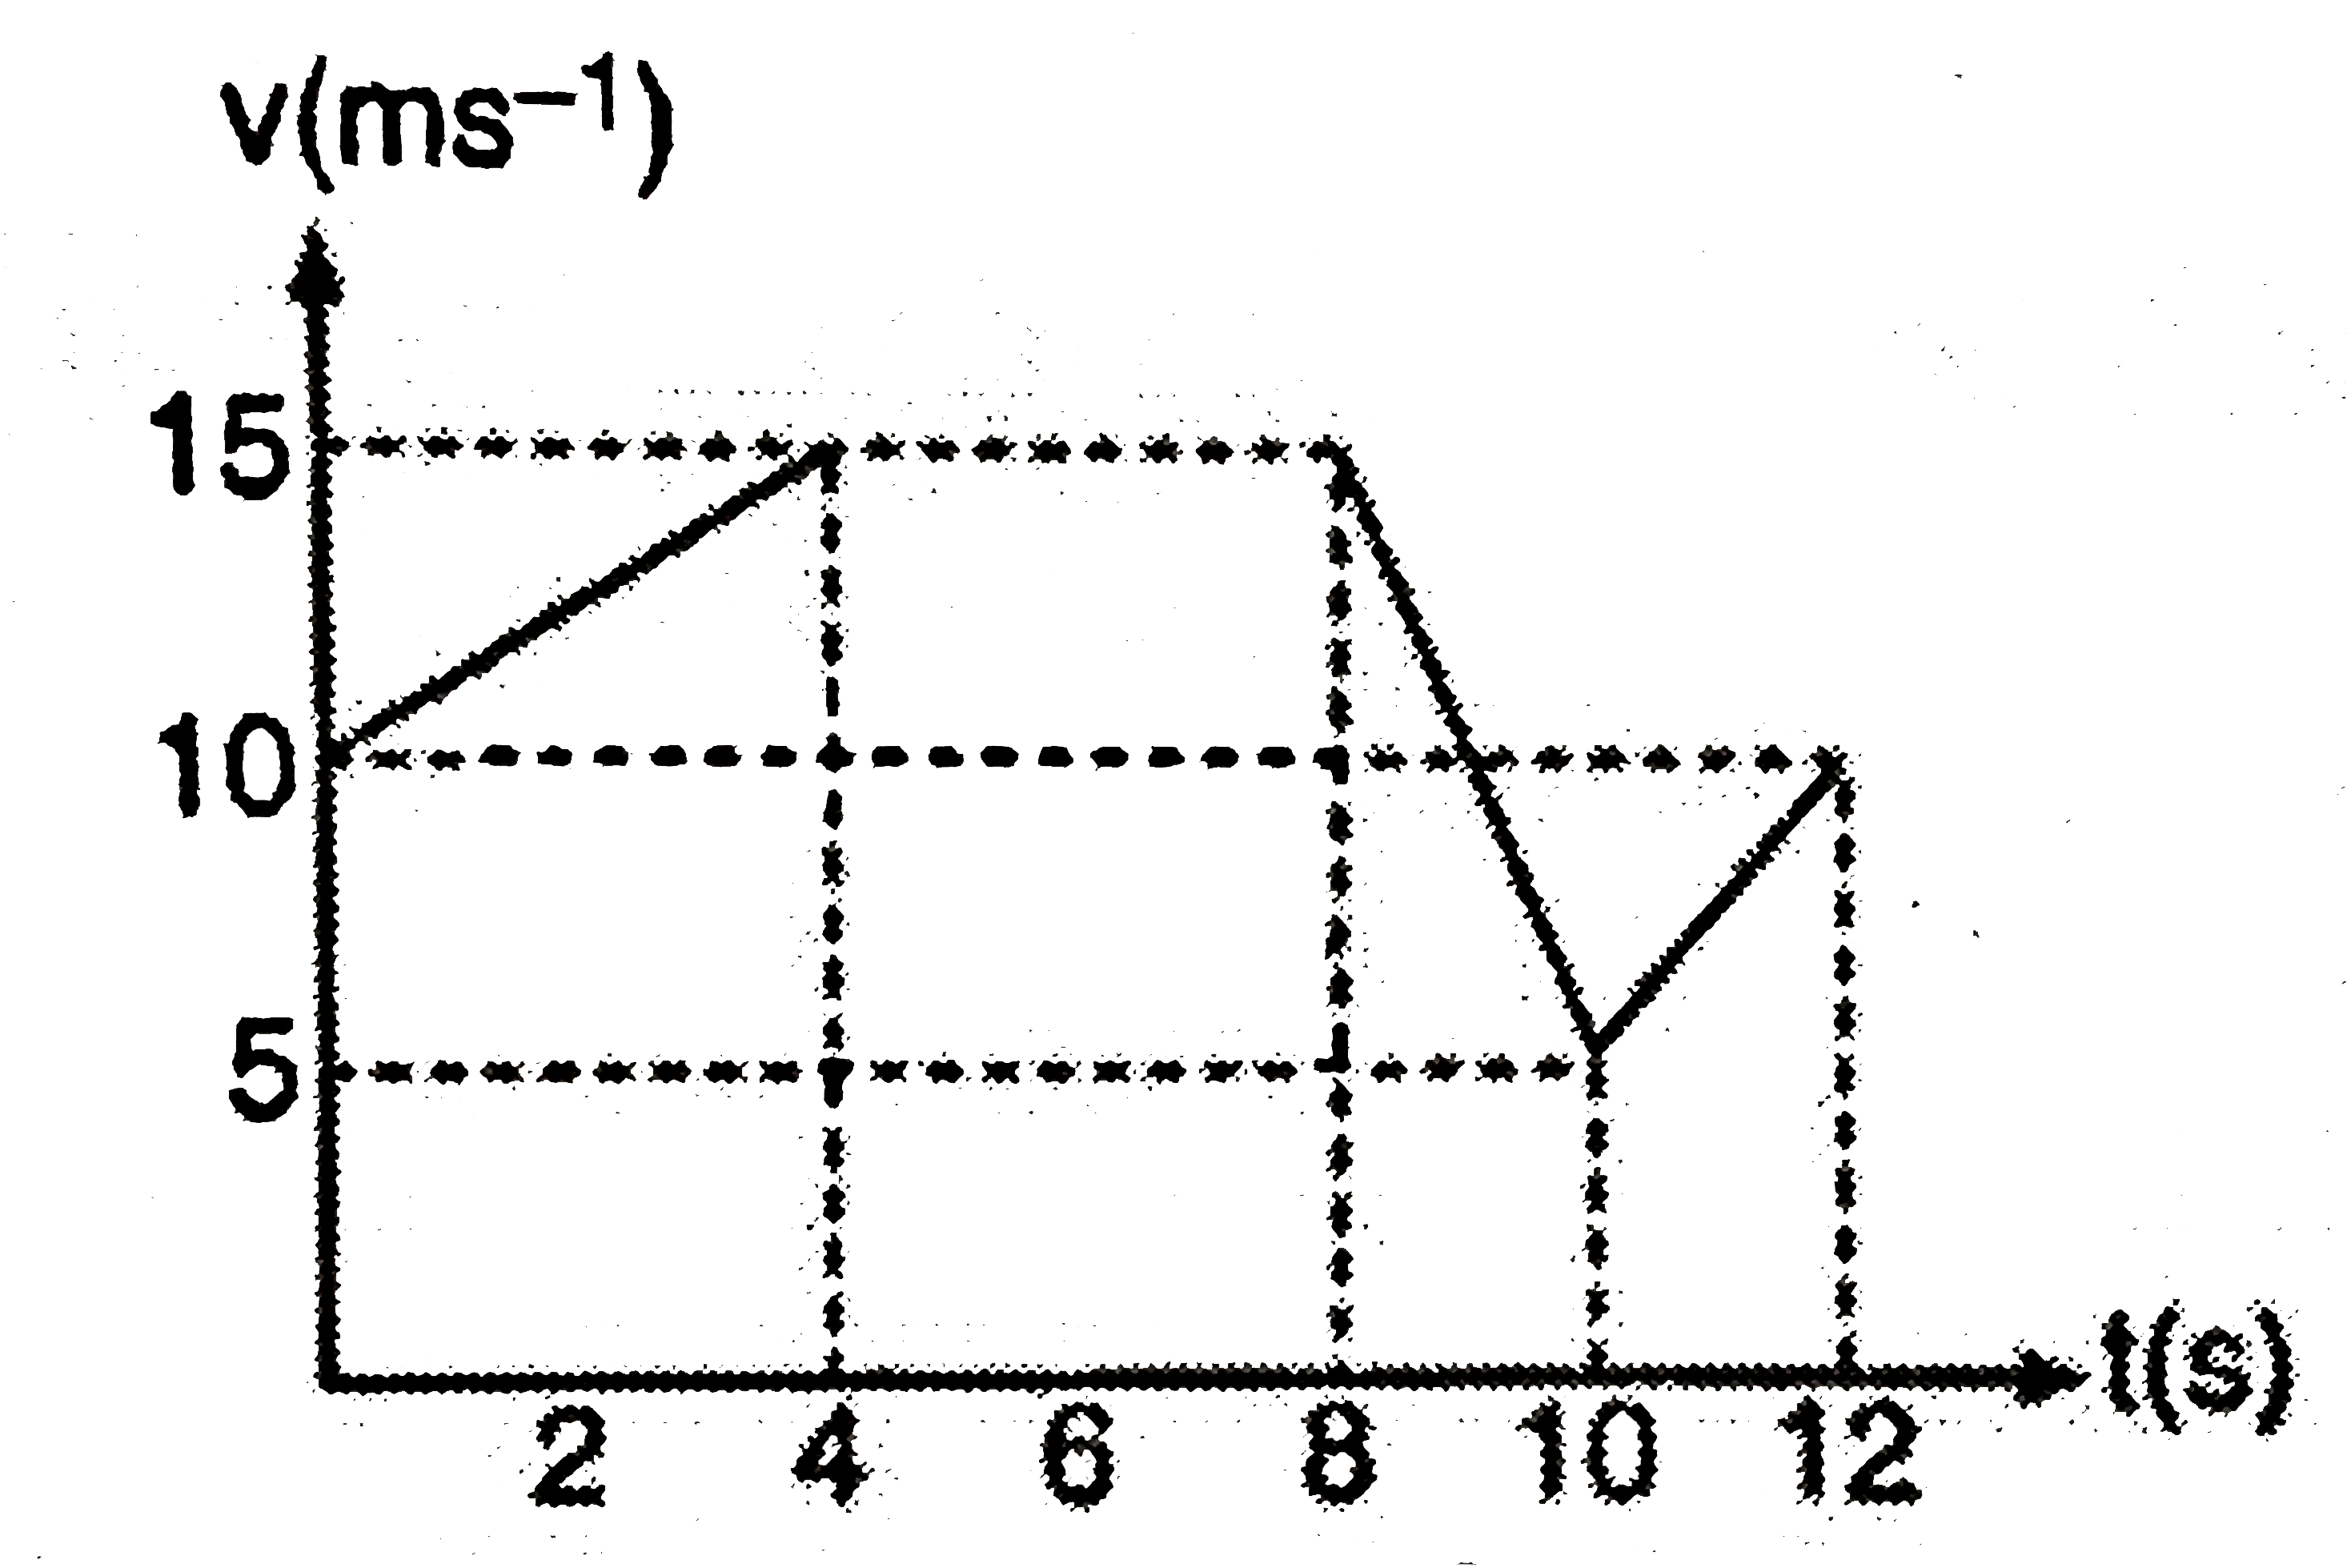
View SolutionThe velocity -time (v−t) graph of a particle moving in a straight line is shown in figure. The acceleration of the particle at t=9 is:
View Solution