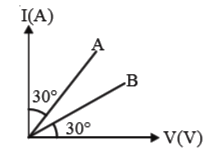
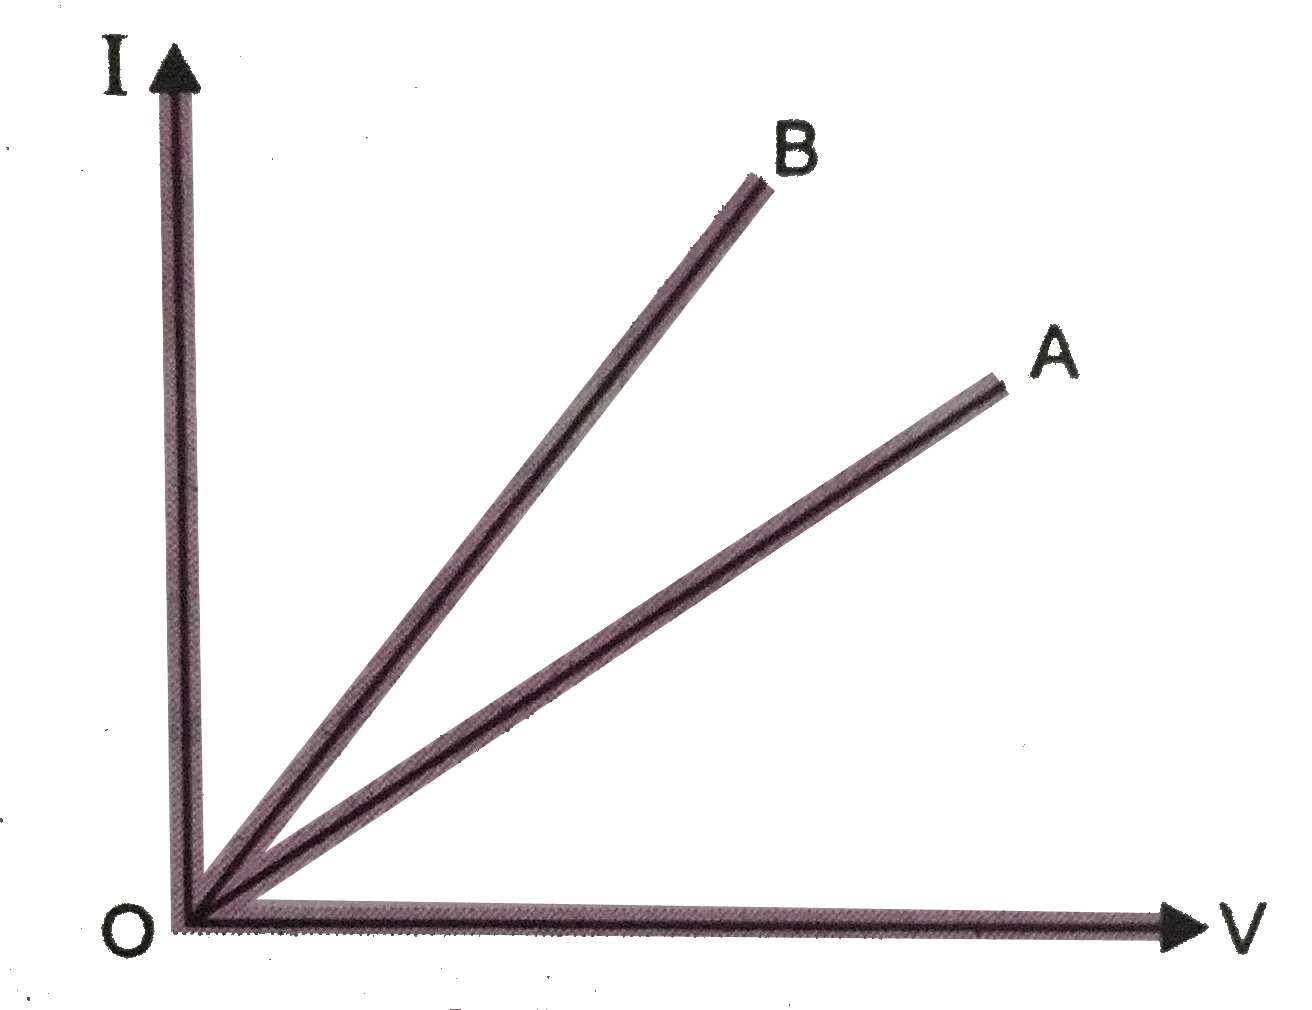
Figure shows graph between I and V for two conductors A and B. Their respective resistances are in the ratio.
1:1
1:3
3:1
1:2
The correct Answer is:B
Step by step video, text & image solution for Figure shows graph between I and V for two conductors A and B. Their respective resistances are in the ratio. by Physics experts to help you in doubts & scoring excellent marks in Class 12 exams.
Similar Questions
Two conductors, one having resistance R and another 3R are connected in turn across a d.c. source. If the rate of heat produced in the two conductors is Q1 and Q2 respectively, then find their ratio.
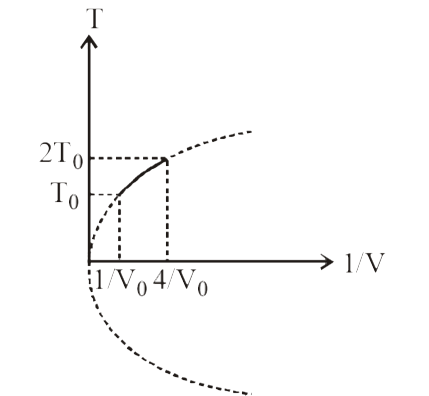
View SolutionFigure shows a parabolic graph between T and 1/V for a mixture of a gases undergoing an adiabatic process. What is the ratio of Vnms of molecules and speed of sound in mixture?
 View Solution
Knowledge Check
- Question 1 - Select One
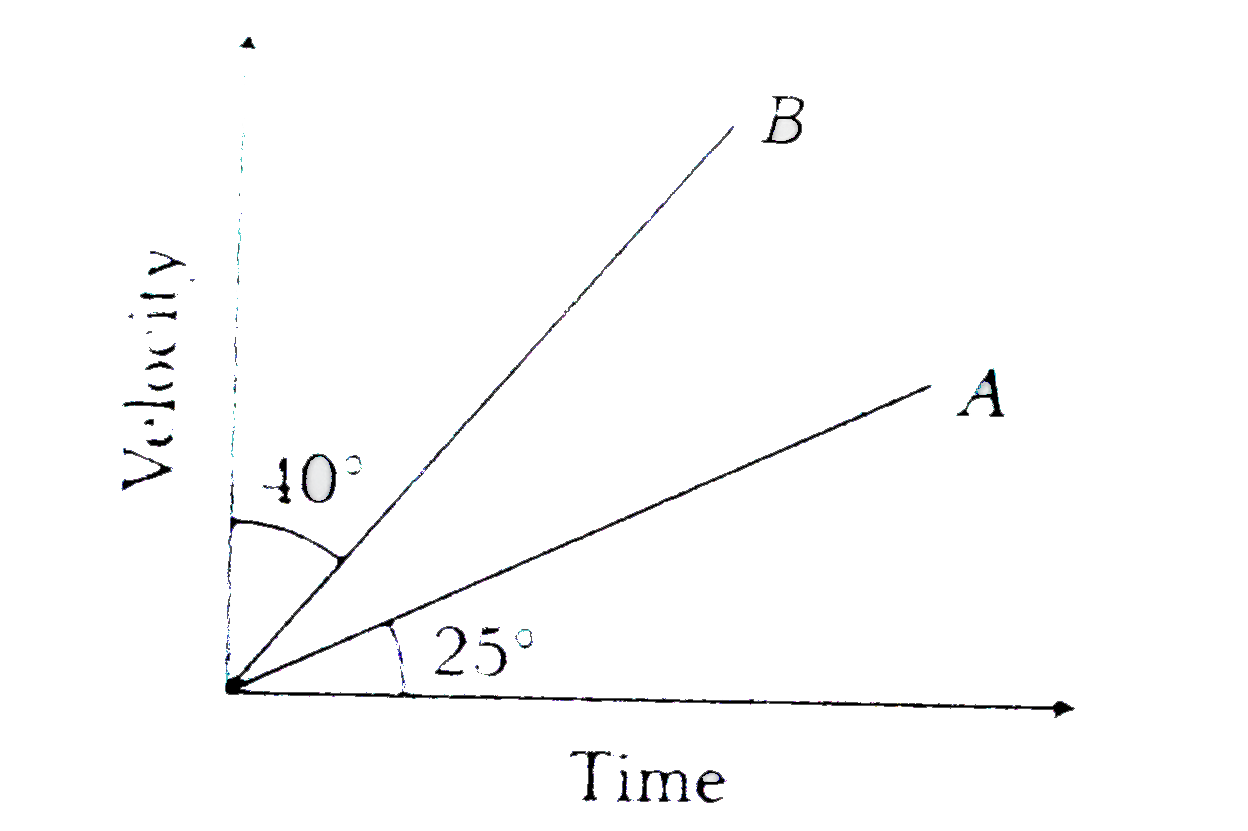
The velocity - time graph for two bodies A and B are shown in figure. Then, the acceleration of A and B are in the ratio
 Asin25∘ to sin50∘Btan25∘ to tan40∘Ccos25∘ to cos50∘Dtan25∘ to tan50∘
 - Question 2 - Select One
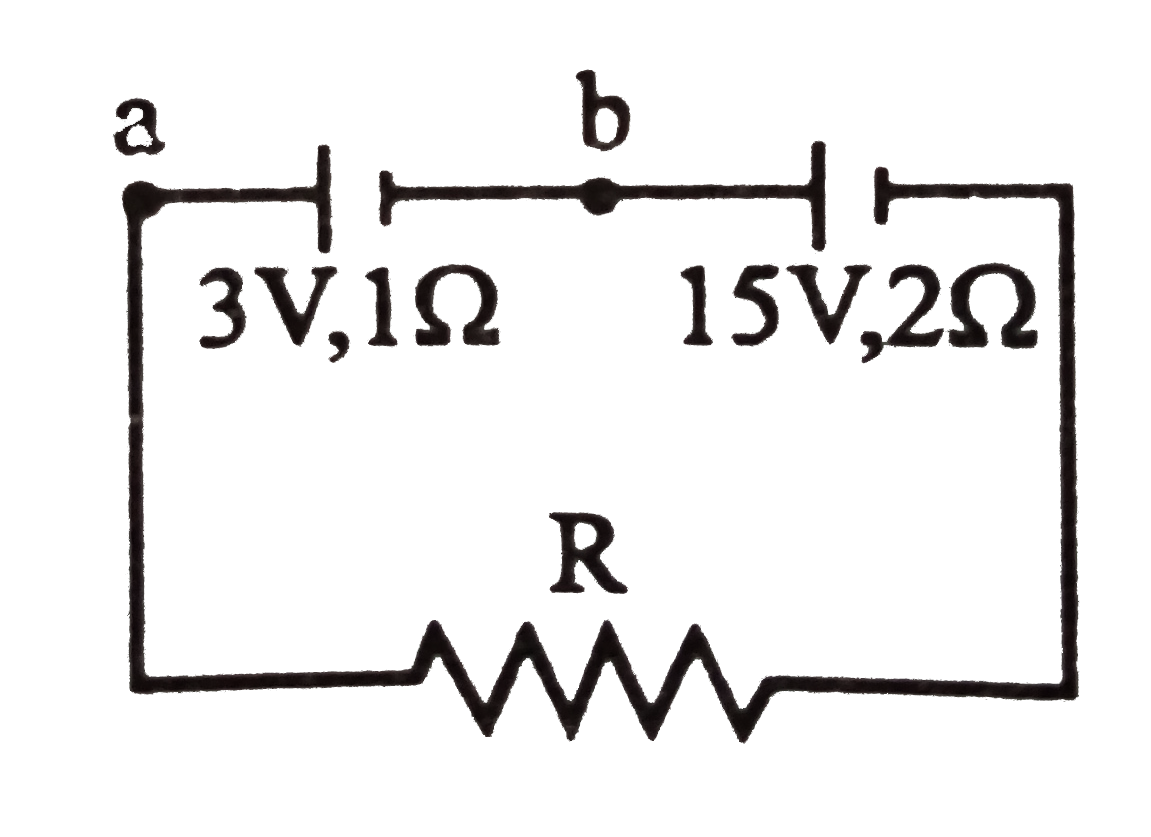
The resistance of all the wires between any two adjacent dots is R. Then equivalent resistance between A and B as shown in figure
 A5B7C3D1
 - Question 3 - Select One
The resistance of all the wires between any two adjacent dots is R. Then, equivalent resistance between Aand B as shown in figure is
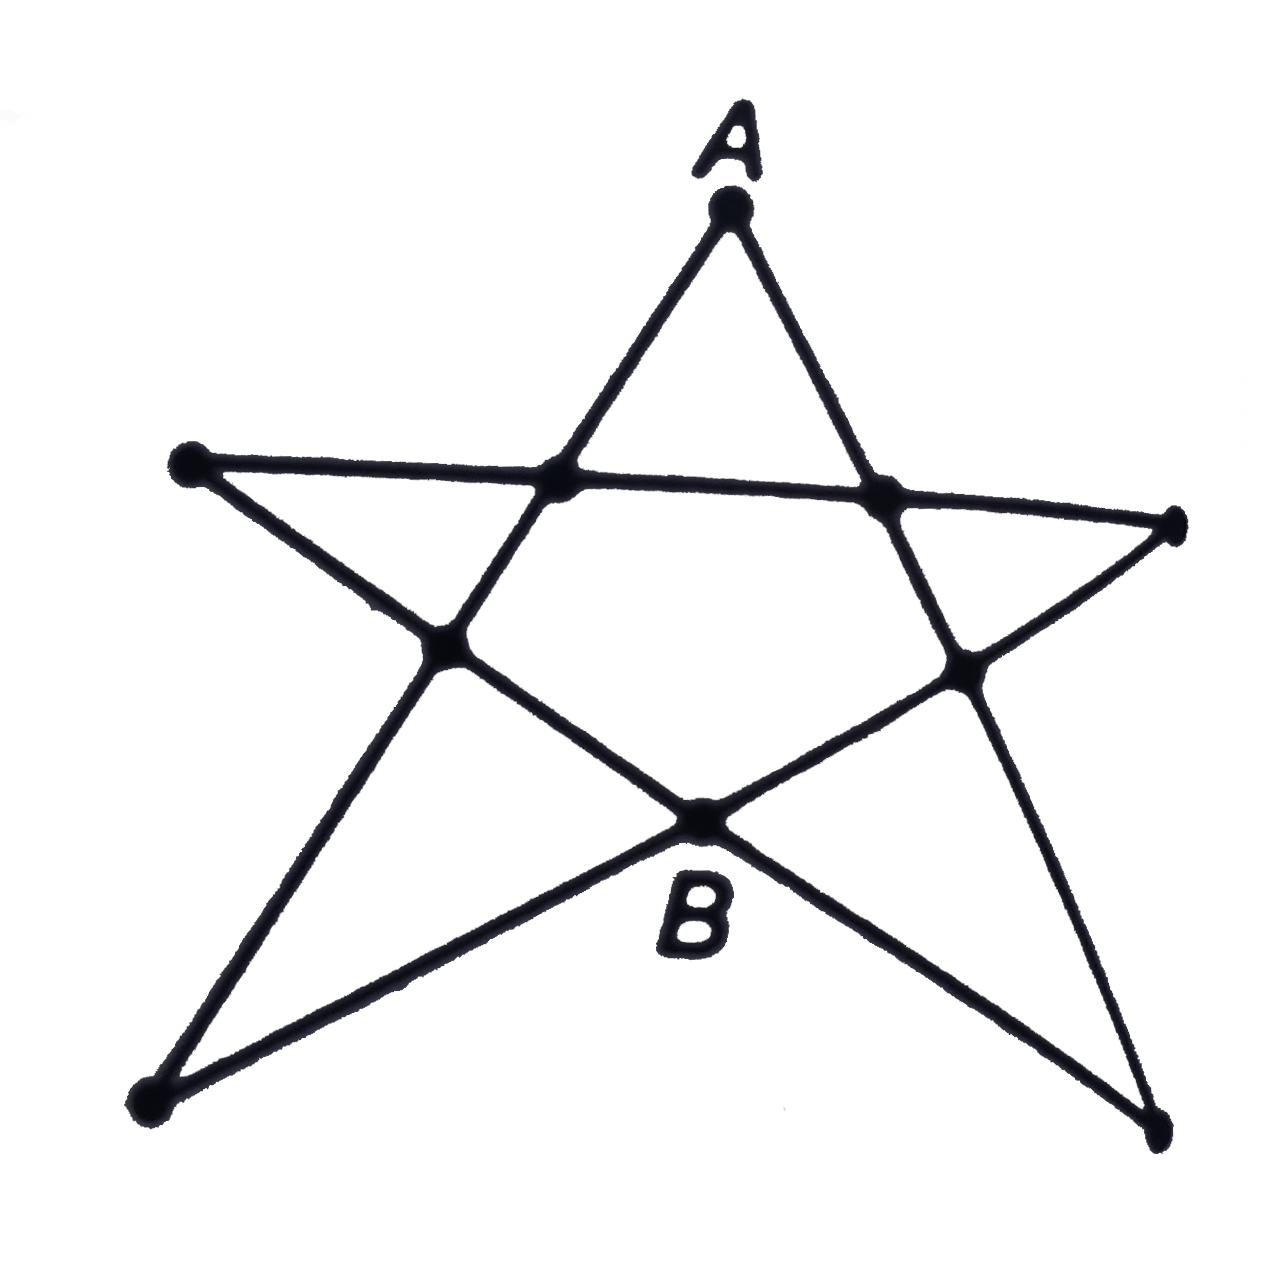 A(7/3)RB(7/6)RC(14/8)RDnone of these
Graphs between electric current and potential difference across two conductors AandB are as shown in (Fig. 3.49). Which of the two conductors has more resistance ?
 .View Solution
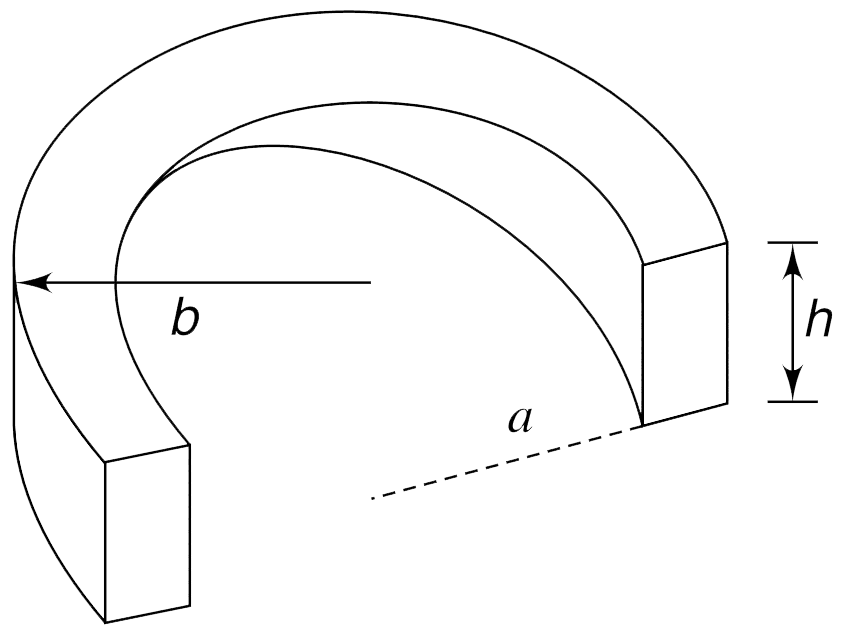
A conductor having resistivity ρ is bent in the shape of a half cylinder as shown in the figure. The inner and outer radii of the cylinder are aandb respectively and the height of the cylinder is h. A potential difference is applied across the two rectangular faces of the conductor. Calculate the resistance offered by the conductor.
 View Solution
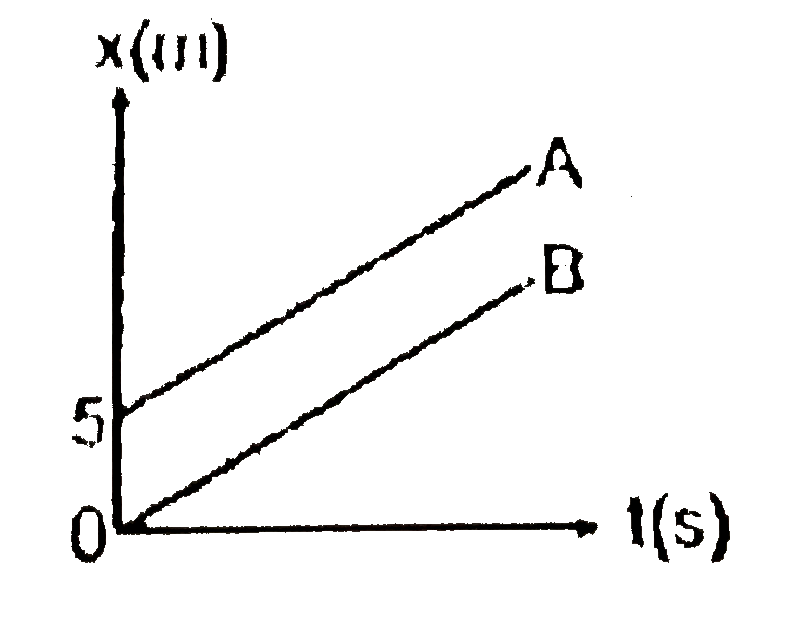
Figure shows position-time graph of two cars A and B.
 View Solution
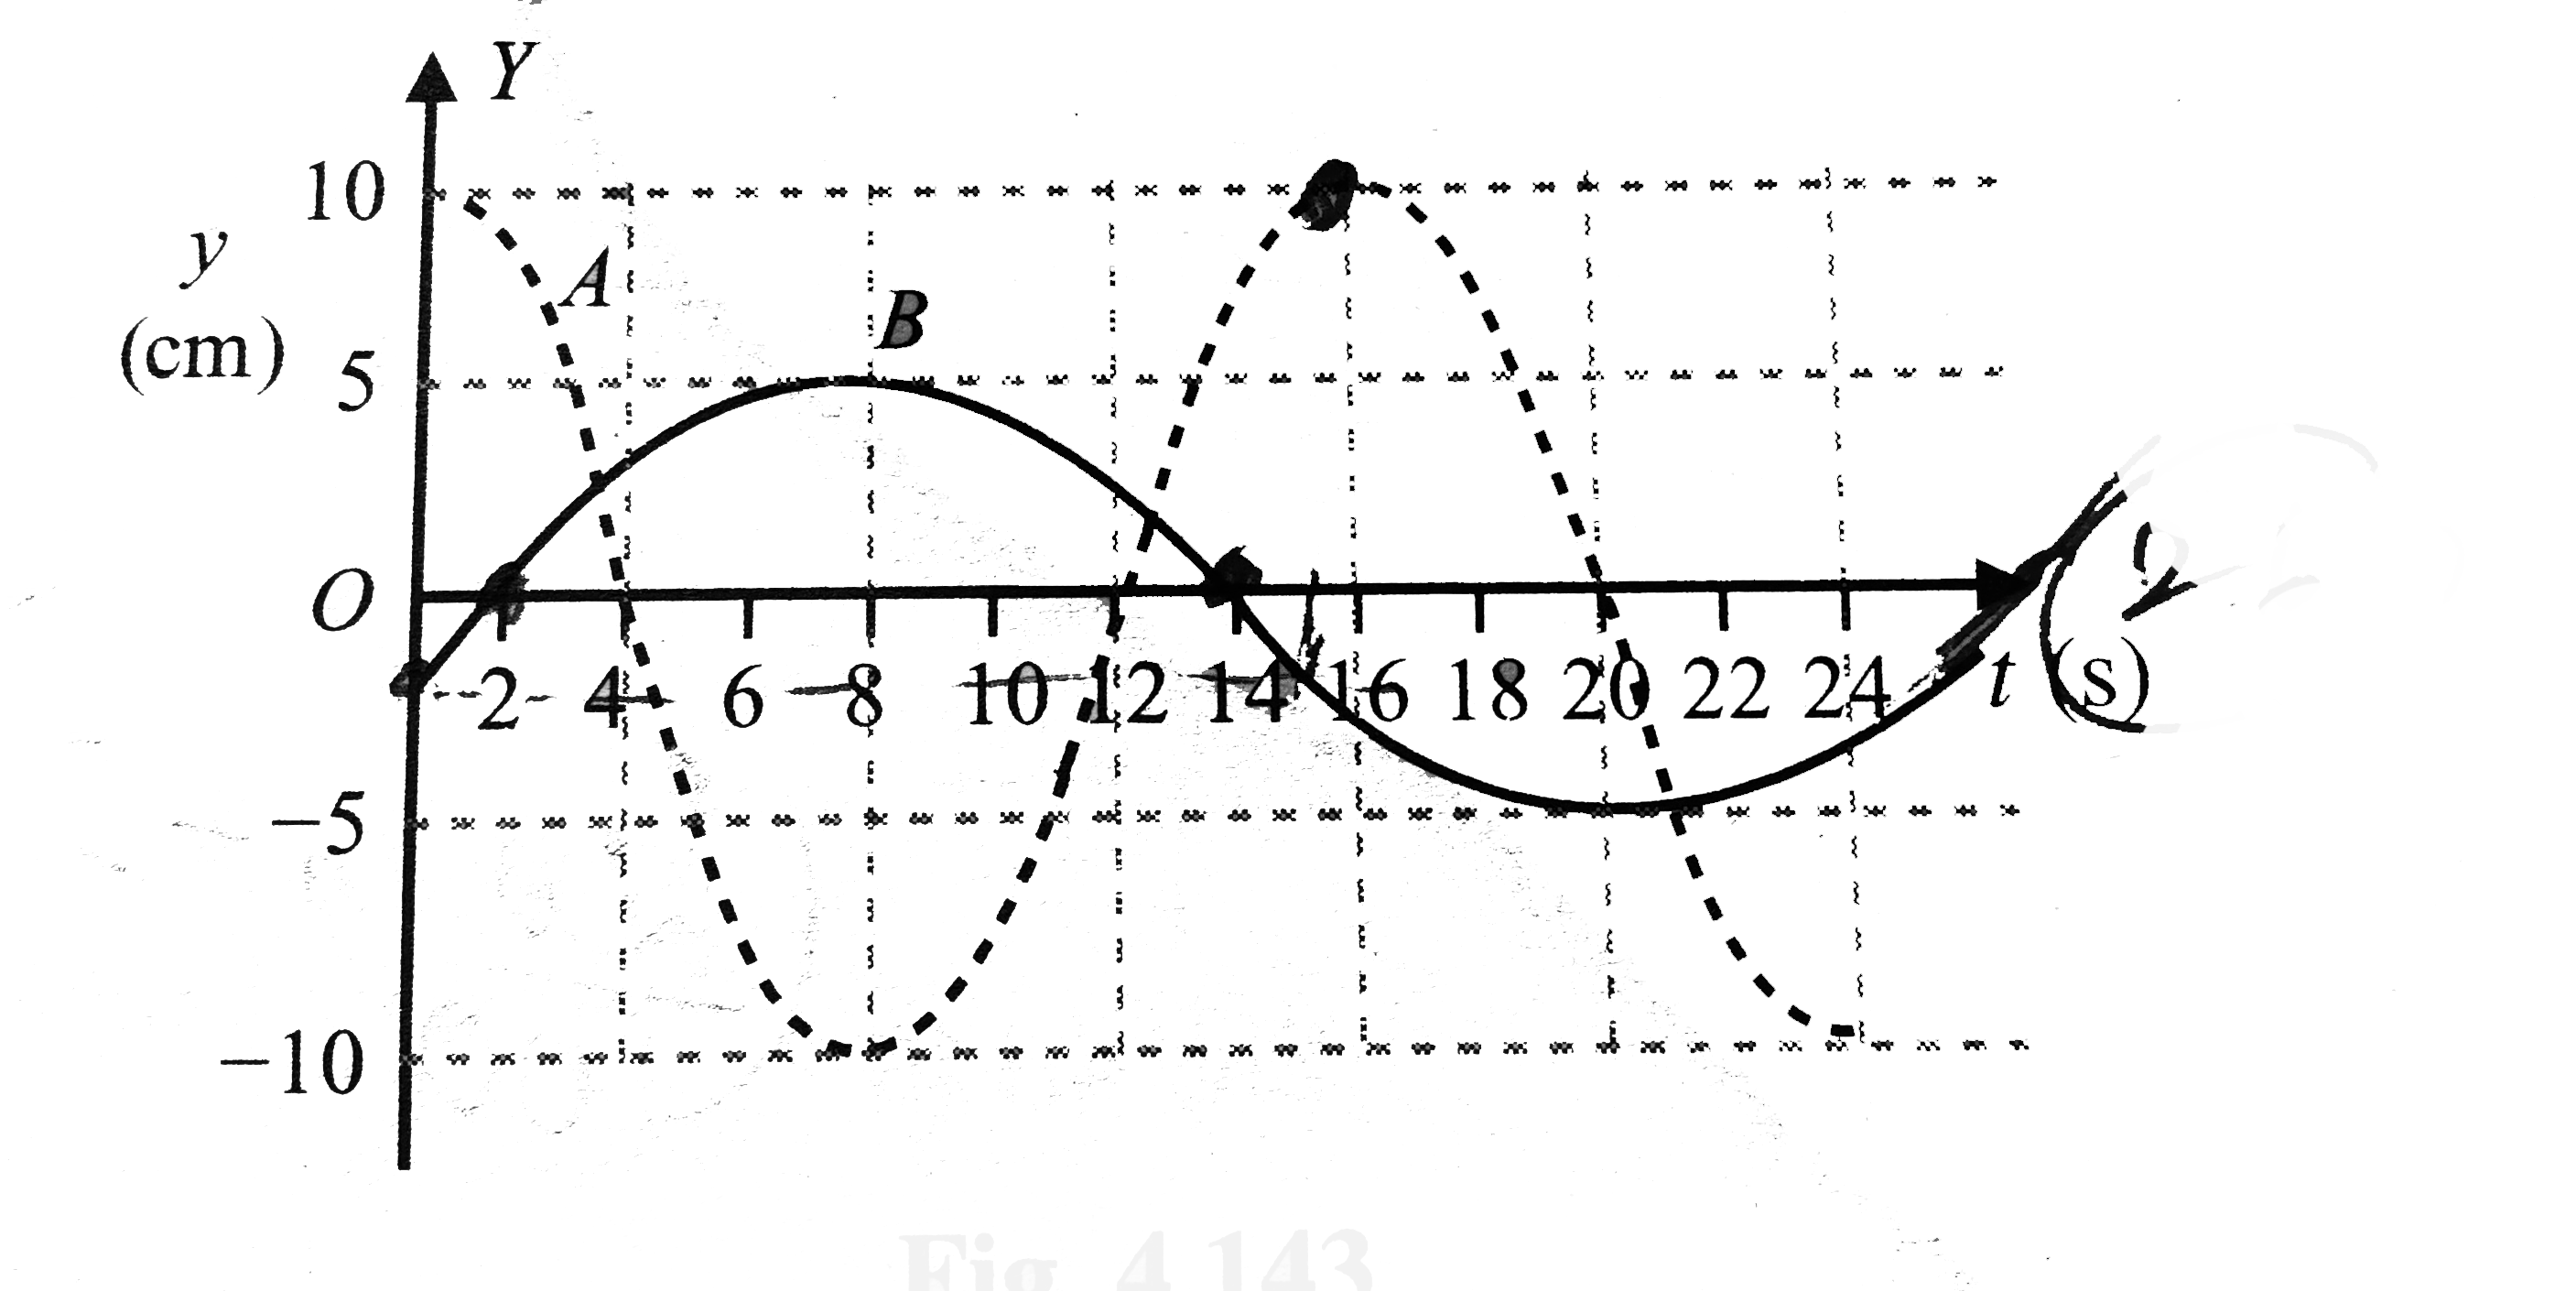
The following figure shows the displacement versus time graph for two particles A and B executing simple harmonic motions. The ratio of their maximum velocities isView SolutionFigure shows the stress-strain graphs for materials .A and B. From the graph it follows that
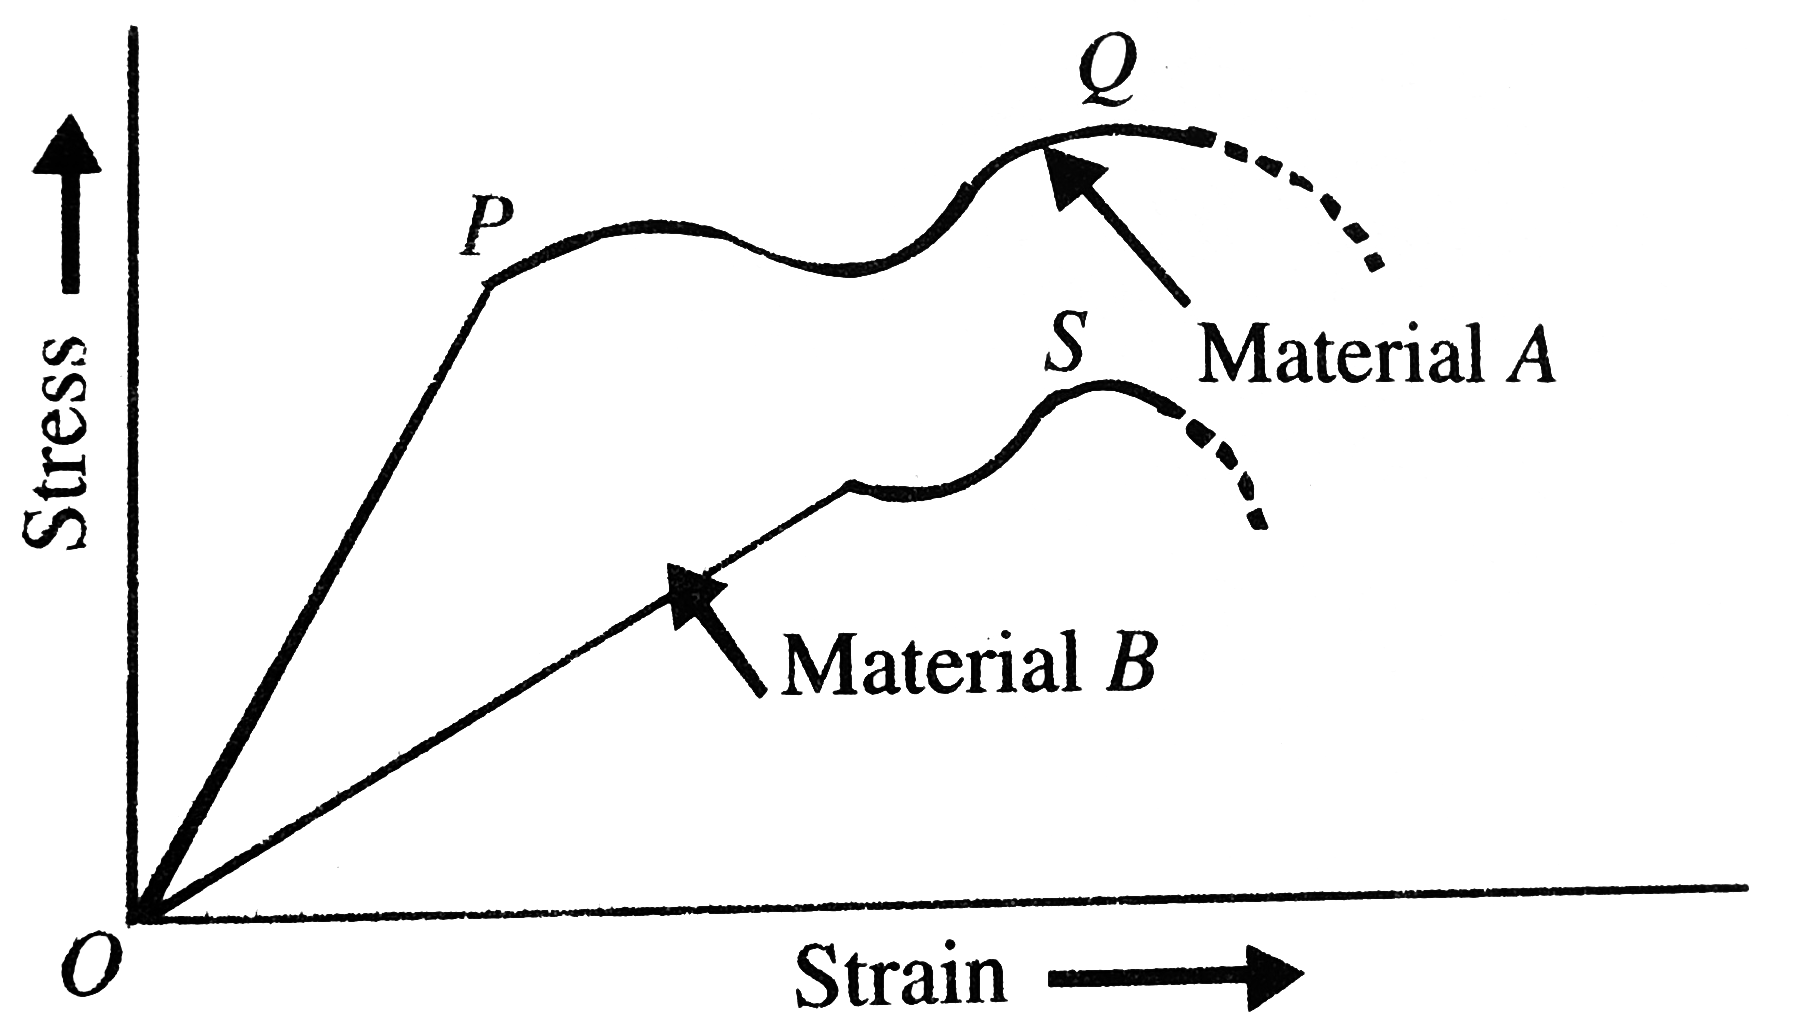 View Solution
