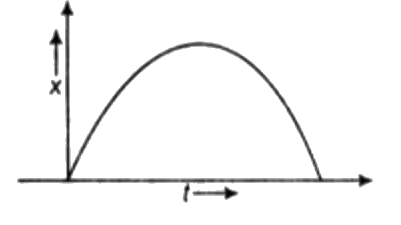
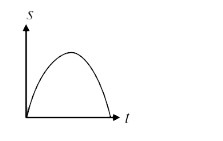
The graph of displacement v/s time is given below. Its corresponding velocity-time graph will be : 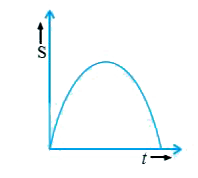
A
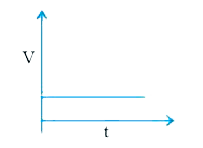
B
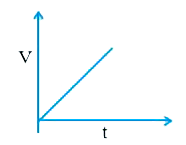
C
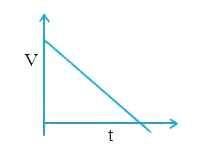
D
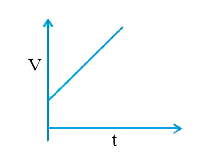
Video Solution
Text Solution
Slope of displacement time graph gives velocity. Initially the slope is positive after some time zero and then it will become negative. So the velocity is positive initially then becomes zero and then becomes negative afterwards
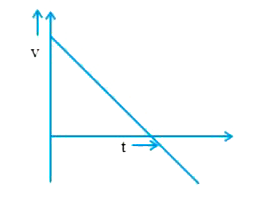
|
Similar Questions
Knowledge Check
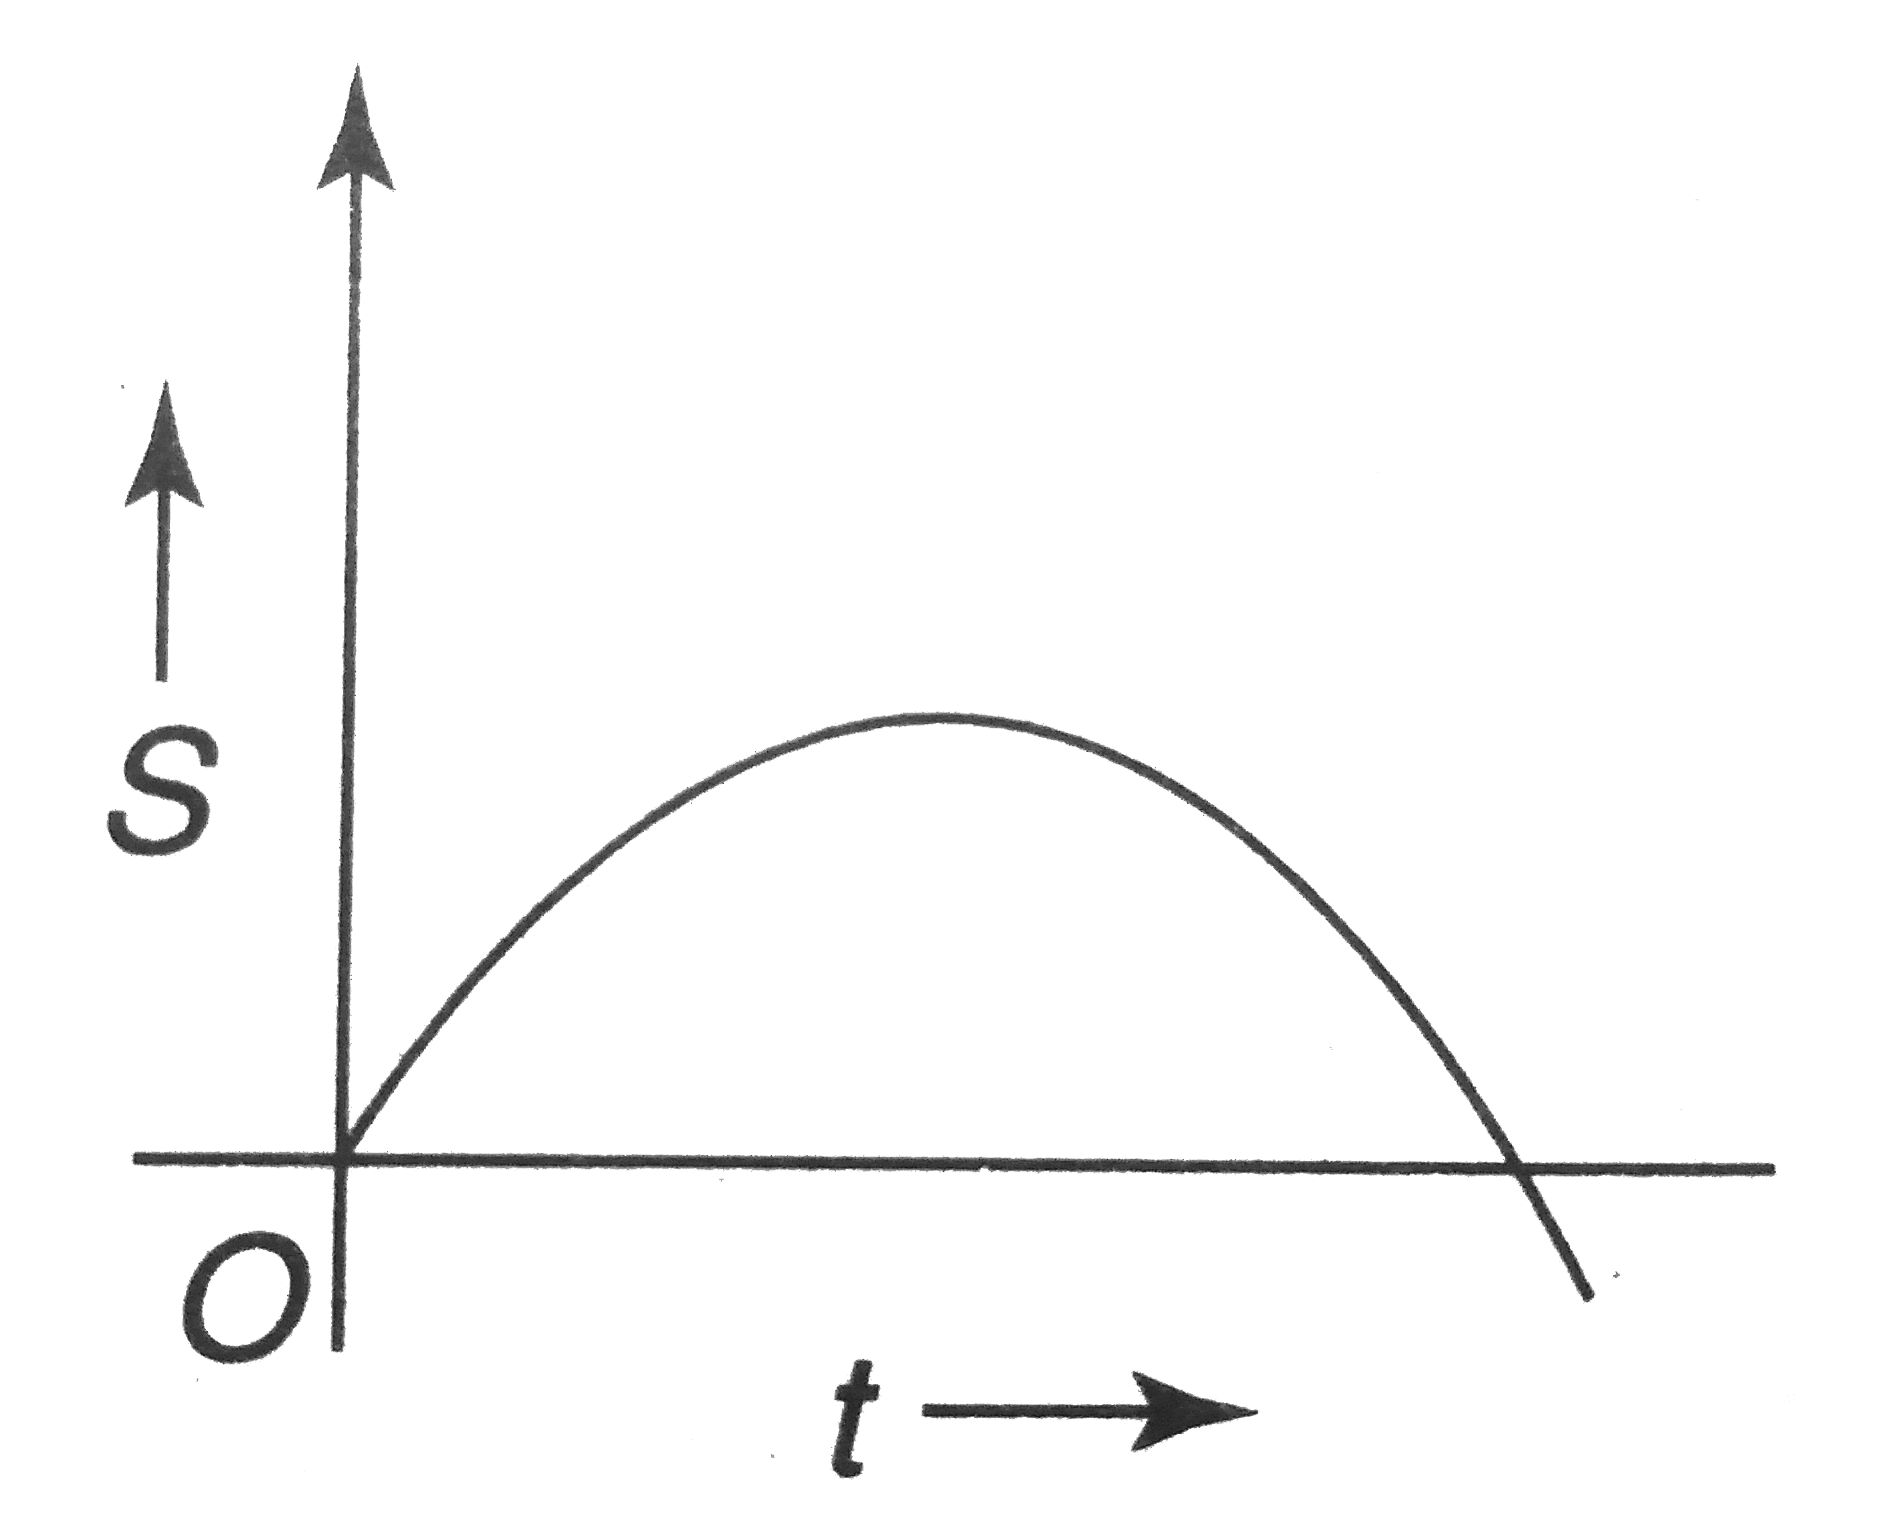
The graph of displacement versus time is shown. Its corresponding velocity-time graph will be.
 A
A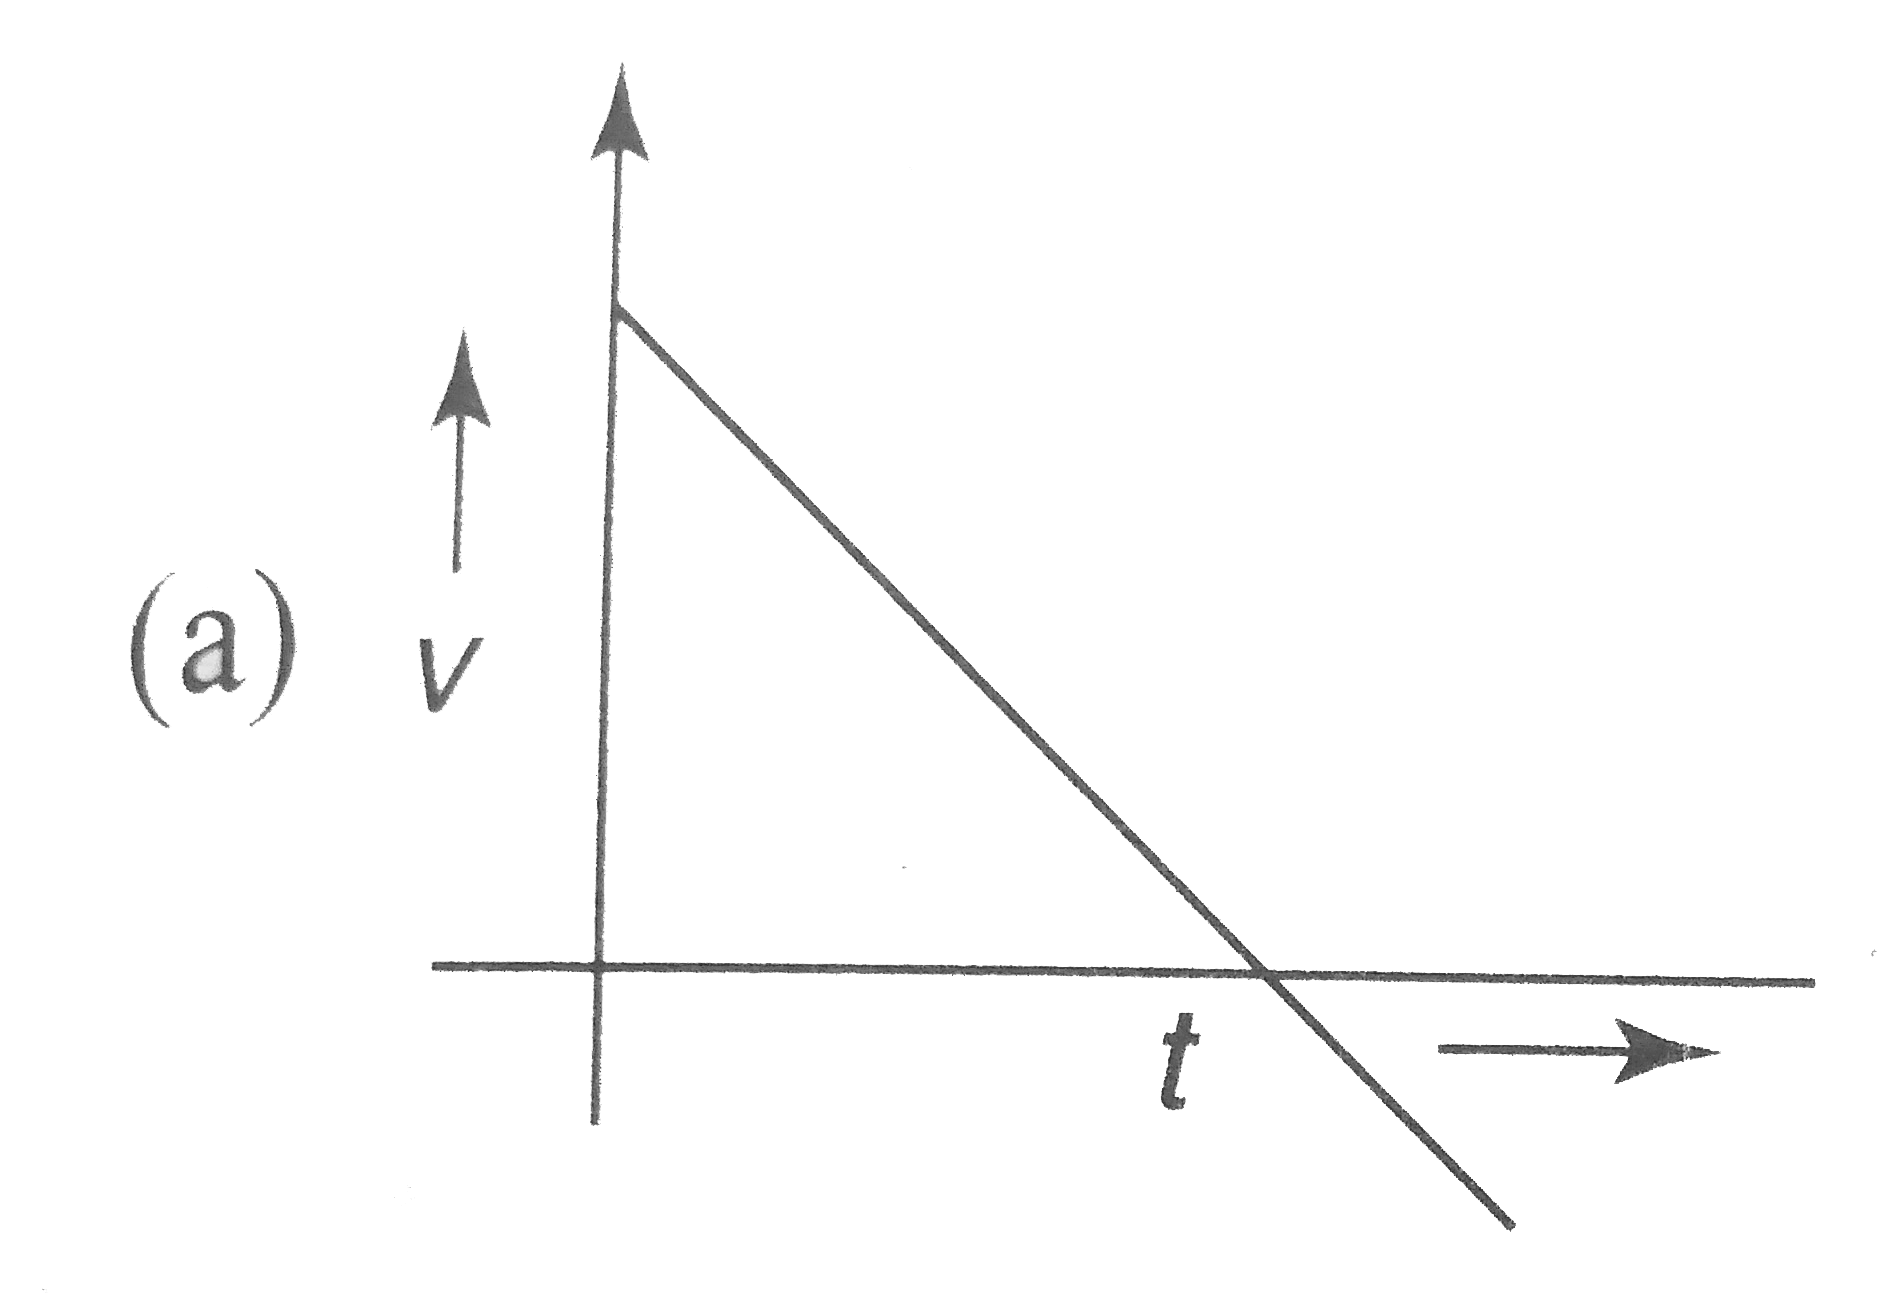 .B
.B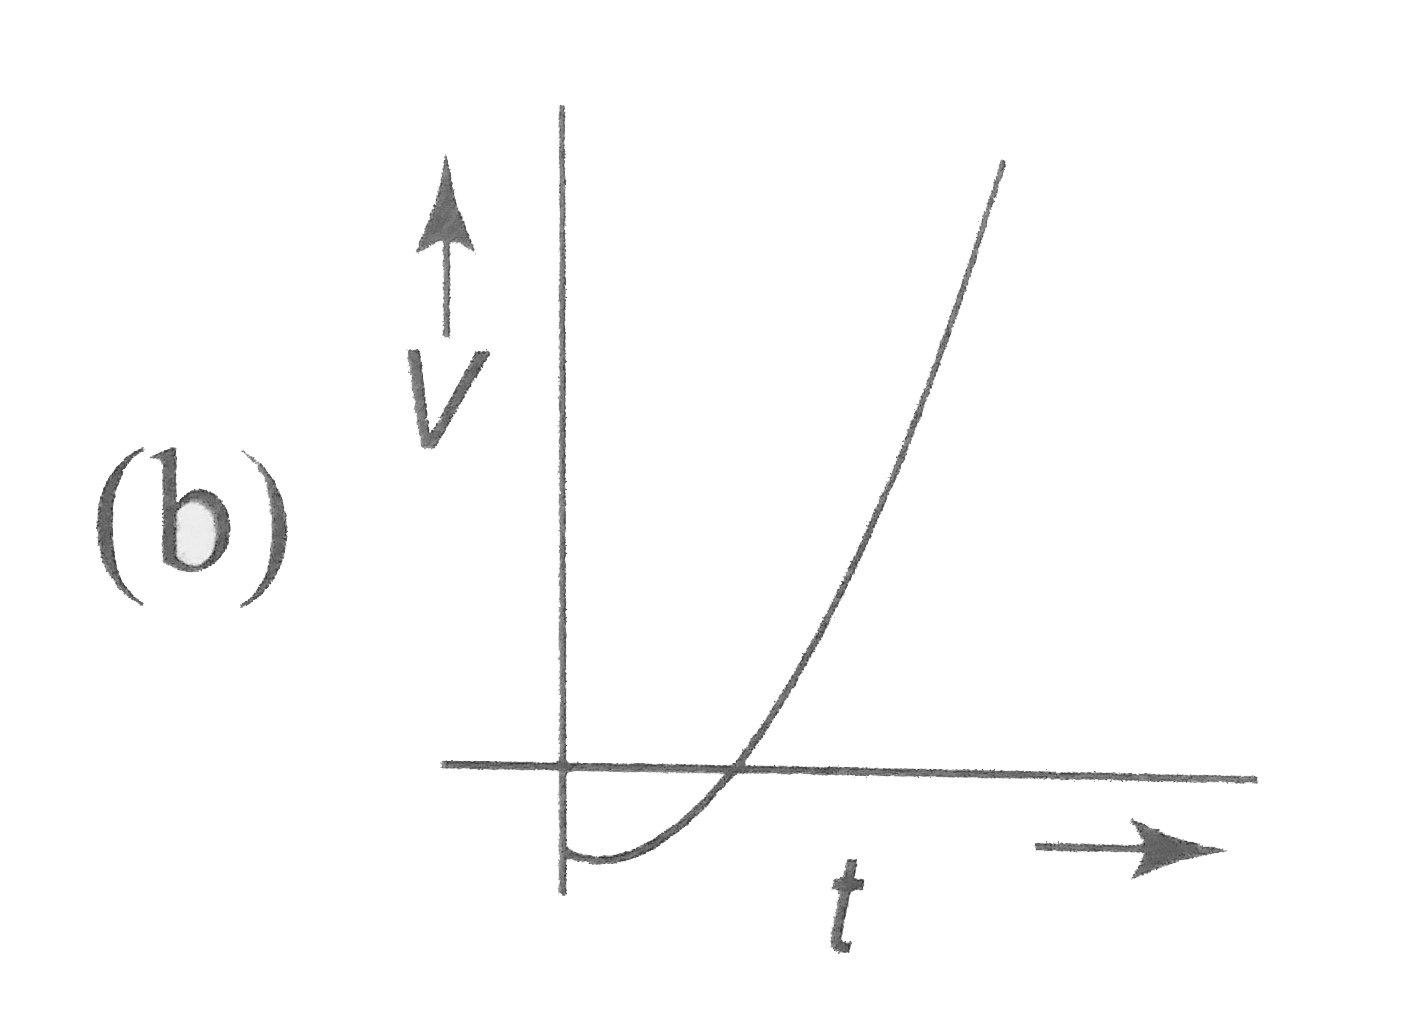 .C
.C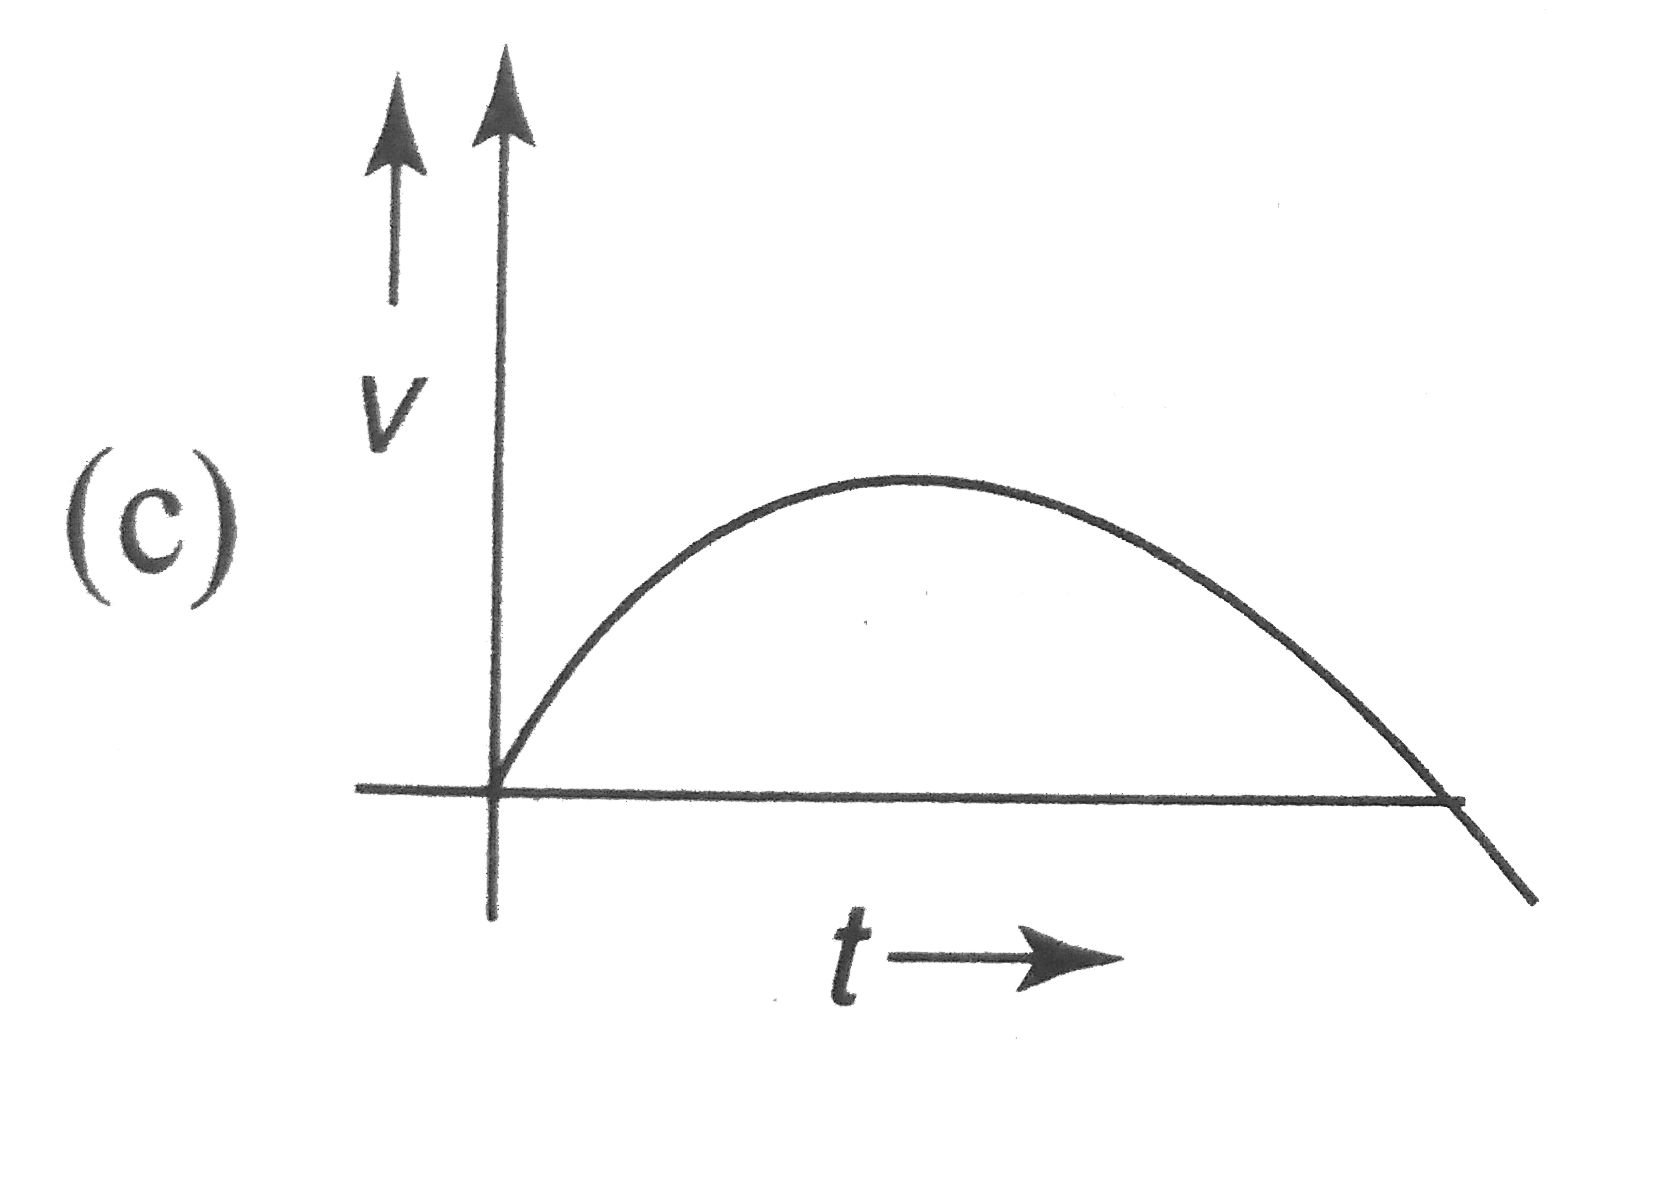 D
D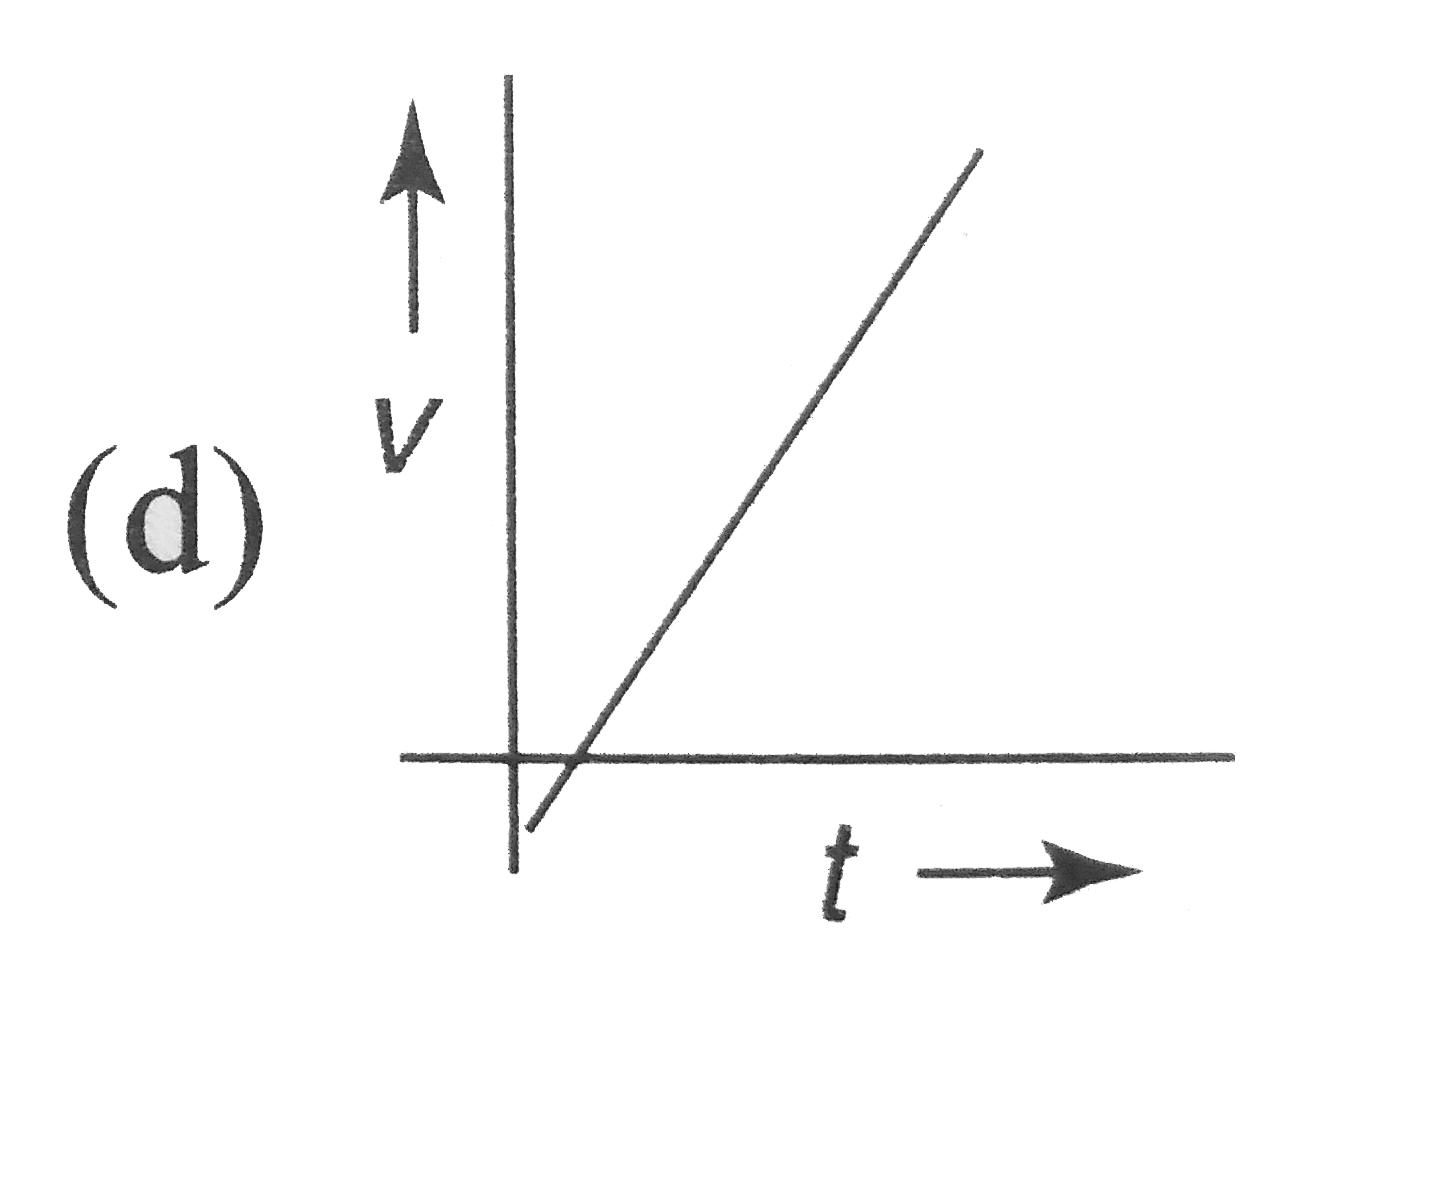 .
.The graph of displacement vs time for a particle moving along a straight line is as shown. The best option for the corresponding velocity - time graph will be:
 A
A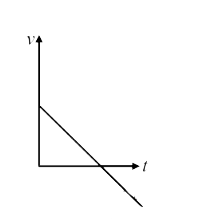 B
B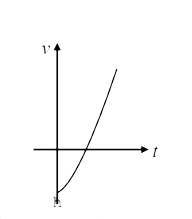 C
C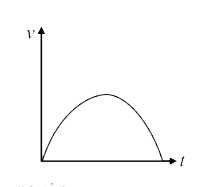 D
D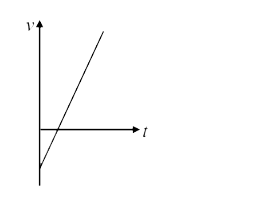
Acceleration time graph of a body is shown below the corresponding velocity time graph of the same body is
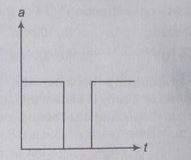 A
A B
B C
C D
D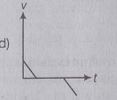
Draw displacement time and acceleration -time graph for the given velocity-time graph
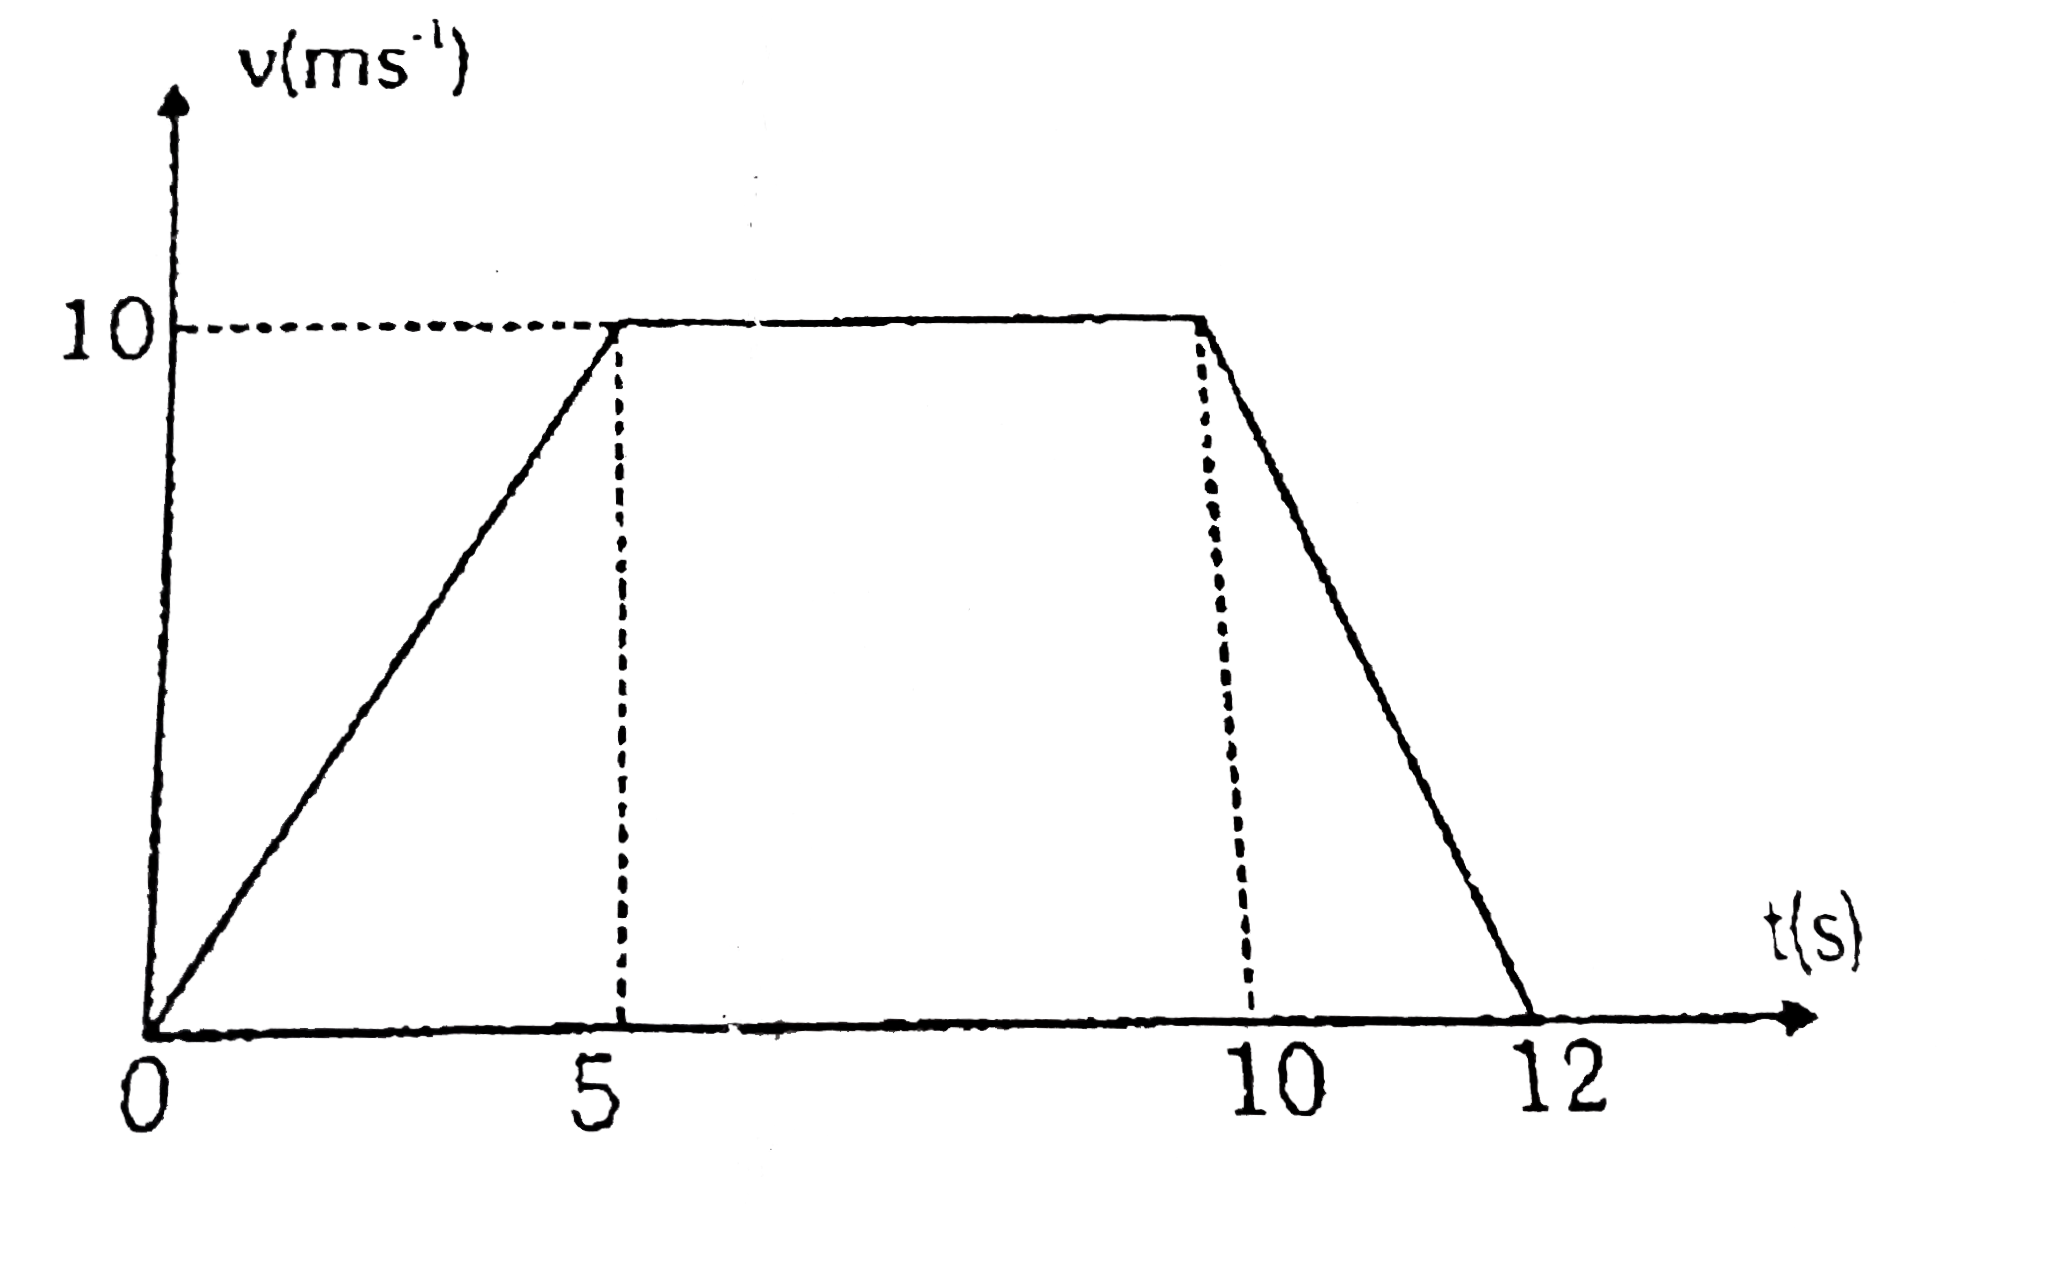
View SolutionAcceleration time graph of a body is shown below the corresponding velocity time graph of the same body is

View SolutionAssertion : Displacement-time graph is a parabola corresponding to straight line velocity-time graph.
Reason : lf v=u+at then s=ut+12at2
View SolutionAcceleration-time graph of a body is shown. The corresponding velocity-time graph of the same body is.
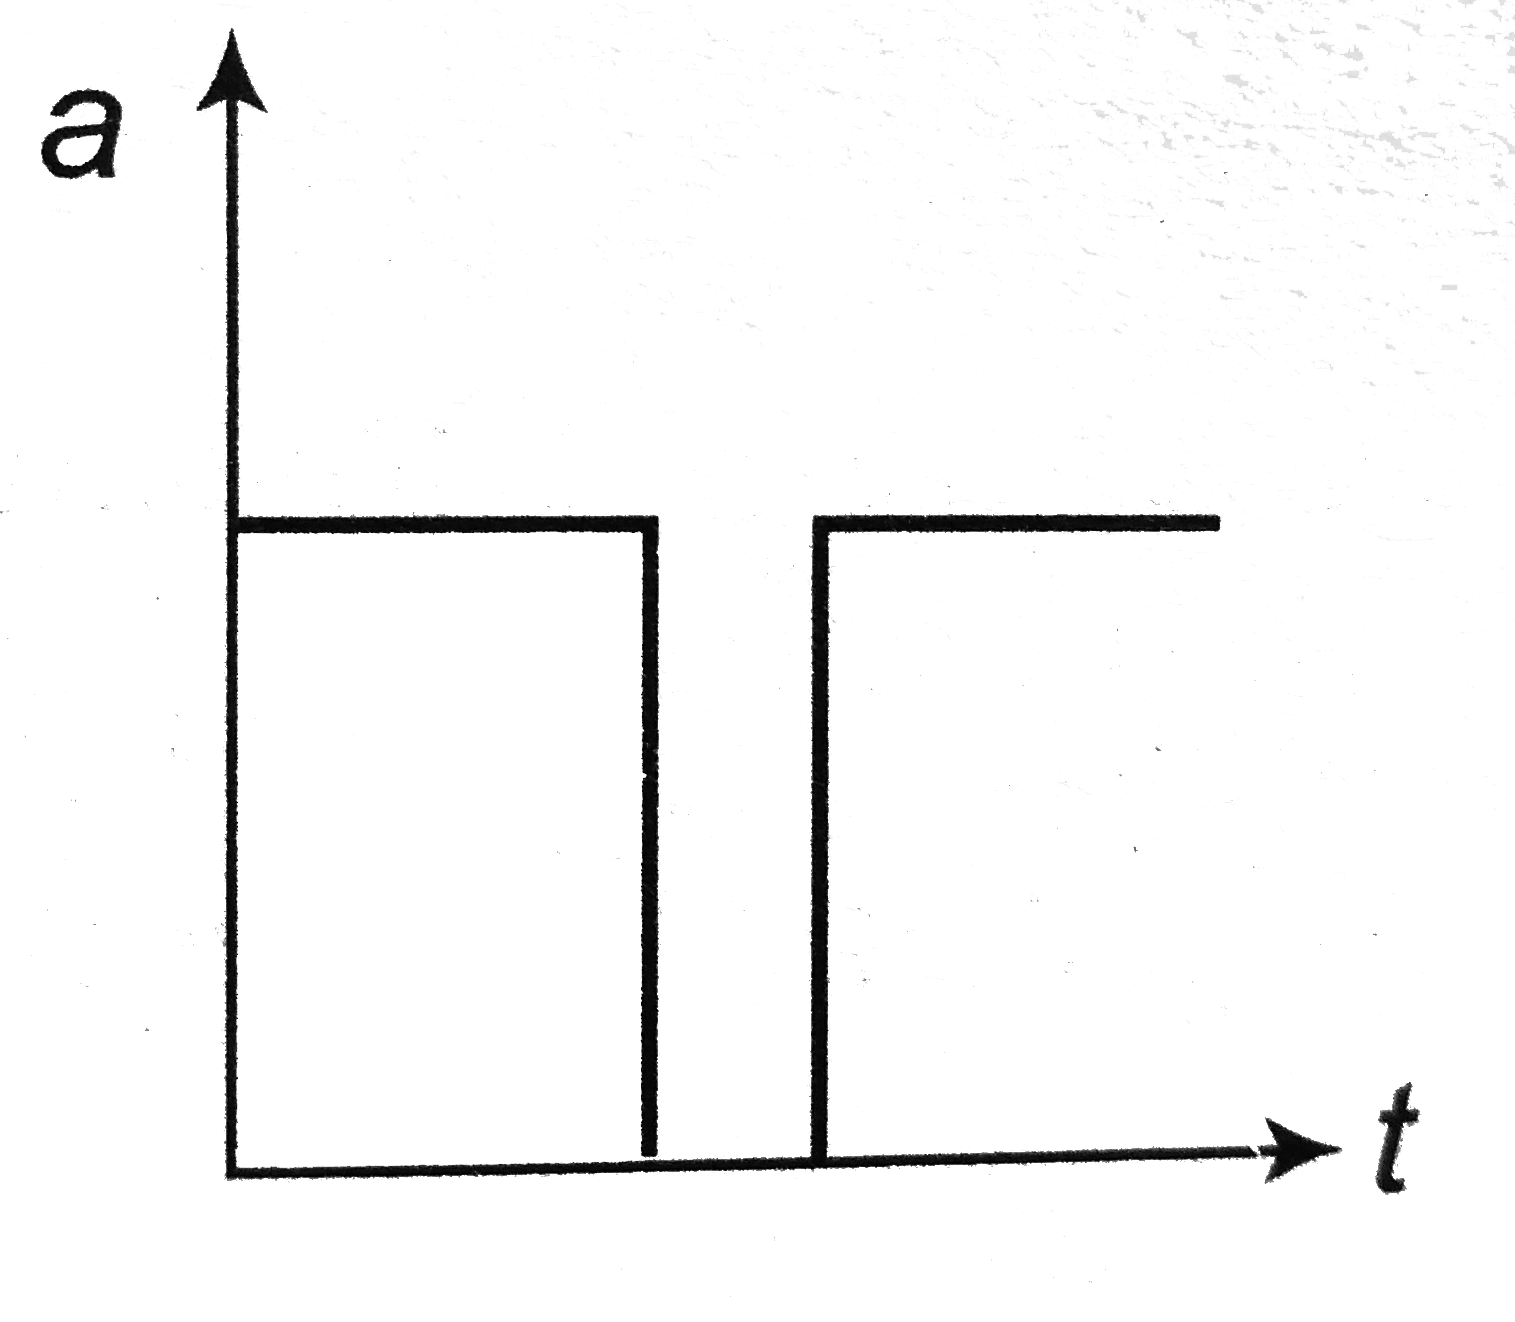
View SolutionFigure shows the acceleration-time graphs of a particle. Which of the following represents the corresponding velocity -time graph?
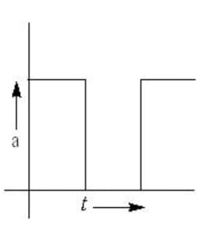
View Solution

