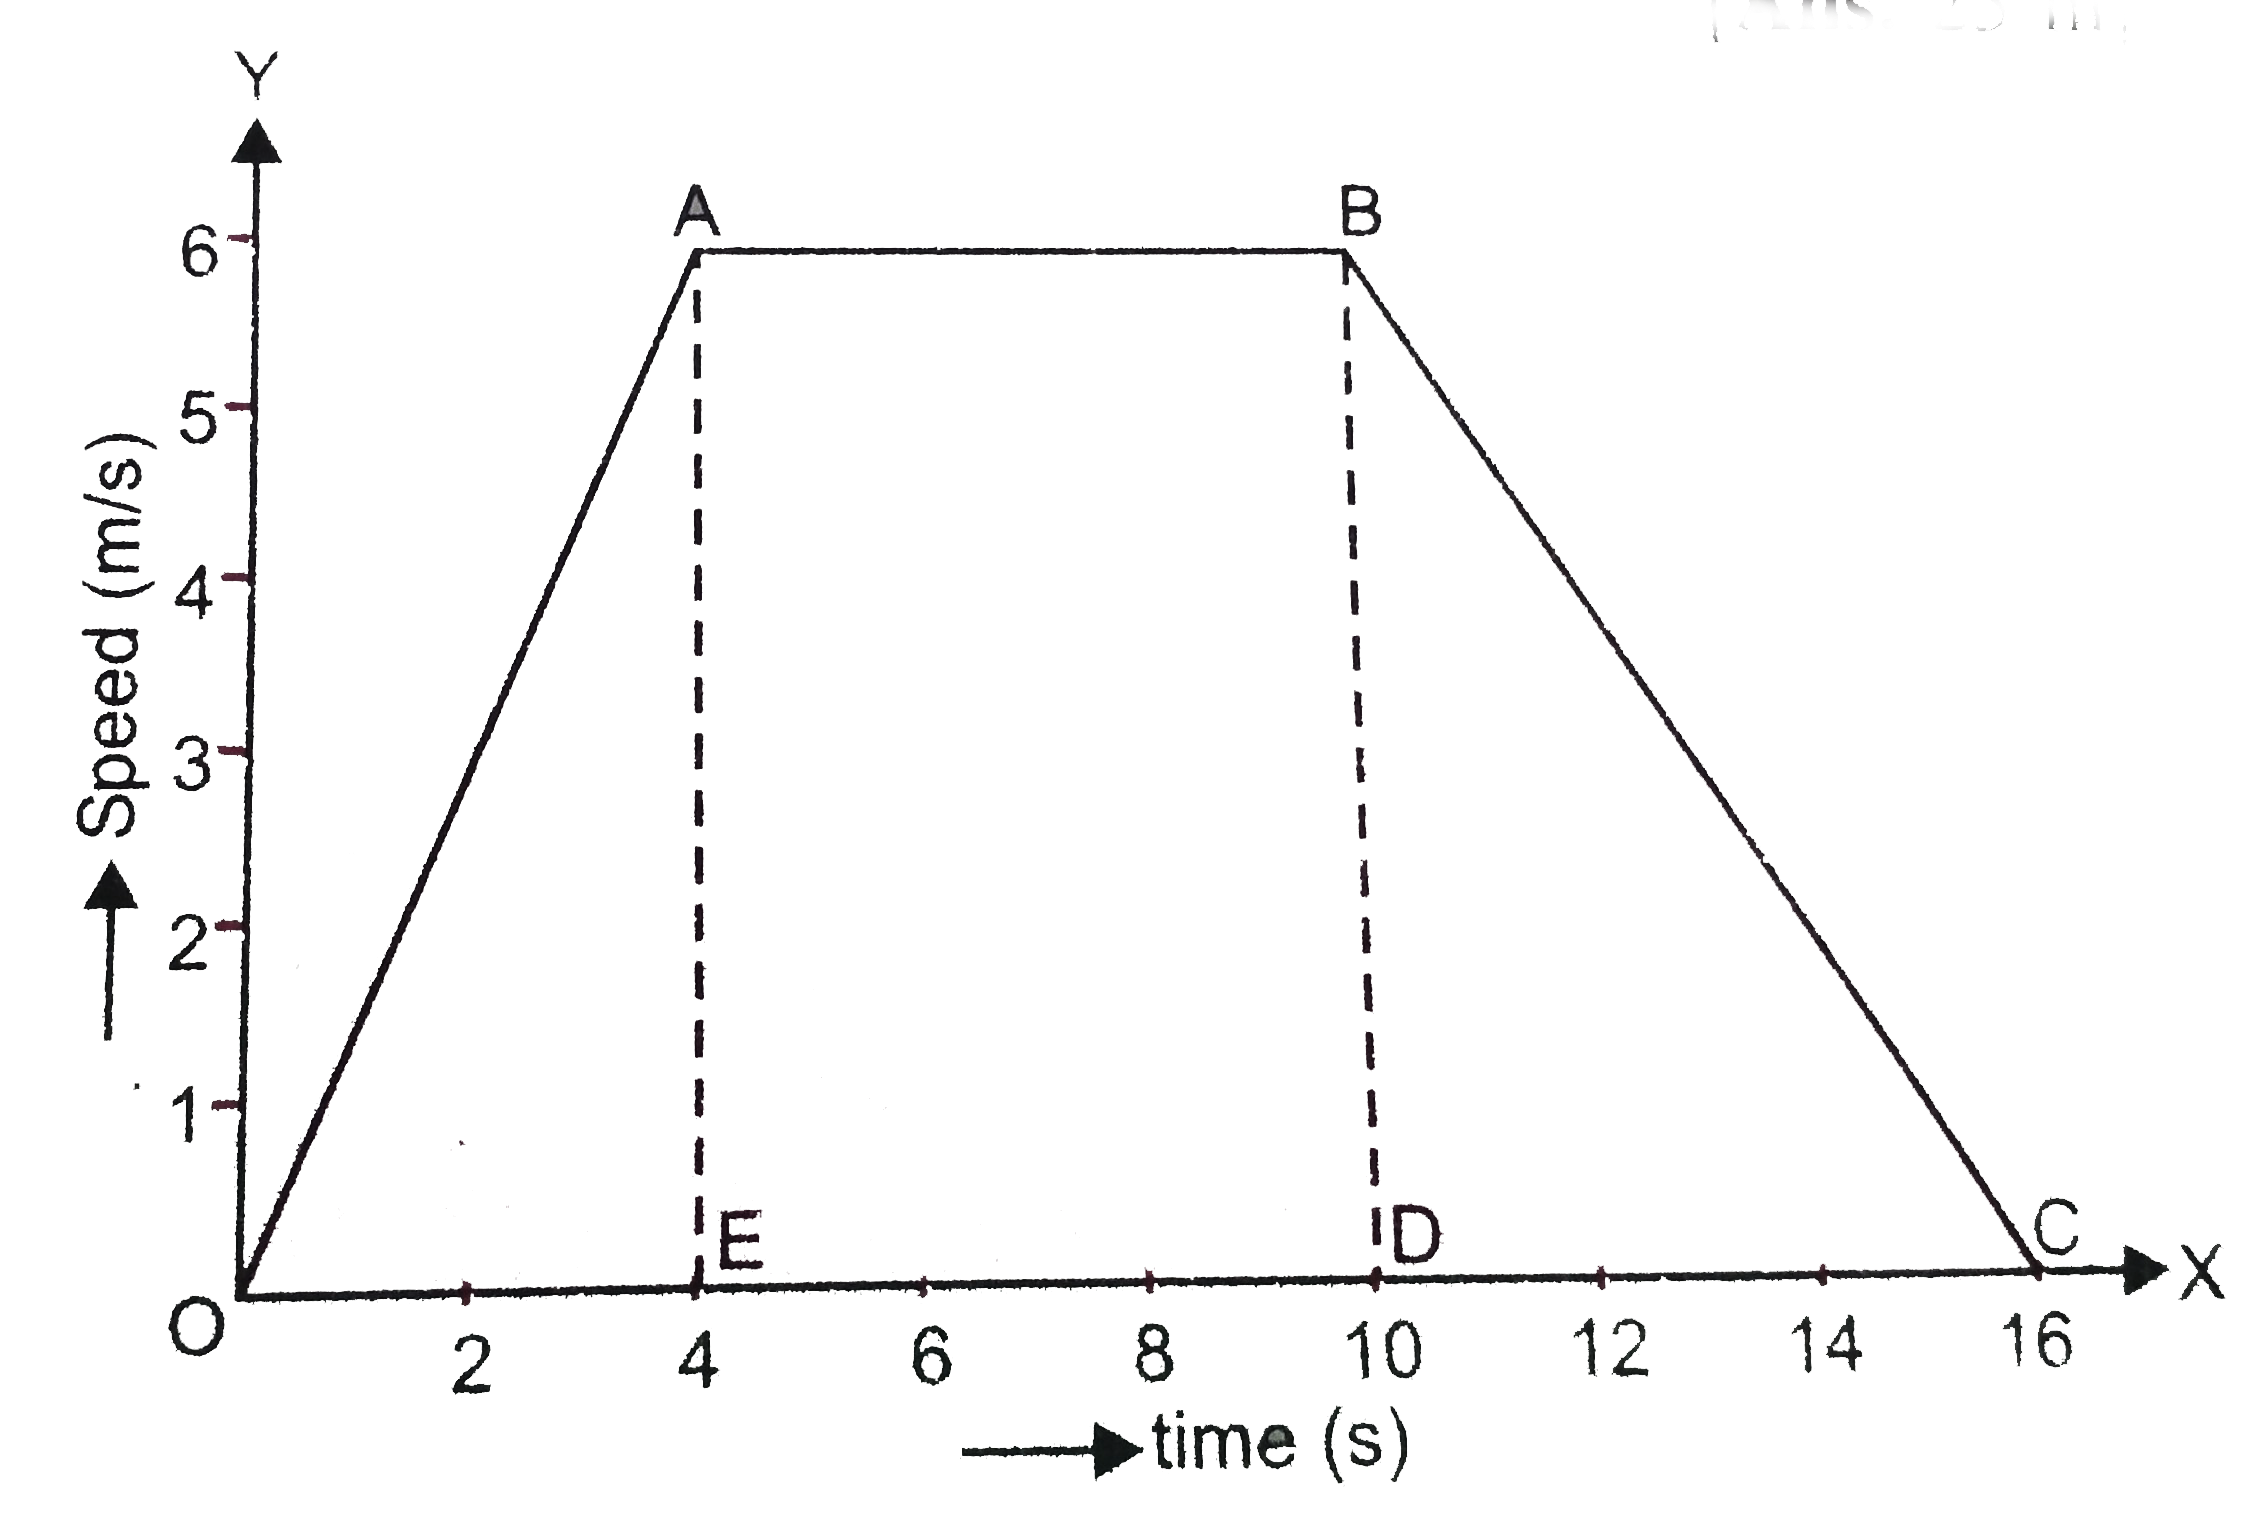
Study the speed time graph of a body shown in Figure. and answer the following questions:
(a) What type of motion is represented by OA ?
(b) What type of motion is represented by AB ?
( c ) What type of motion is represented by BC ?
(d) Find out acceleration of the body.
(e) Find out retardation of the body .
(f) Find out the distance travelled by the body from A to B

(a) Oa is a straight line graph between speed and time, and it is sloping upwards from O to A. Therefore, the graph line OA represents uniform acceleration.
(b) AB is a straight line graph between speed and time, which is parallel to the time axis (x-axis). So, AB represents uniform speed (or constant speed). There is no acceleration from A to B.
(c) BC is a straight line graph between speed and time which is sloping downwards from B to C. Therefore, BC represents uniform retardation (or negative acceleration).
(d) Let us find out the acceleration now. We have just seen that the graph line OA represents acceleration.
So, the slope of speed-time graph OA will give us the acceleration of the body. Thus,
Acceleration = Slope of line OA
=ADOD
Now, in the given graph (Figure 40), we find that AD = 6 m/s and OD = 4 seconds. So, putting these values in the above relation, we get :
Acceleration = 6m/s4s
= 1.5 m/s2 ...(1)
(e) Let us calculate the retardation now. We have discussed above that the graph line BC represents retardation. So, the slope of speed-time graph BC will be equal to the retadation of the body. So,
Retardation = Slope of line BC
=BEEC
Now, in the graph given to us (Figure 40), we find that BE = 6 m/s and EC = 16-10=6 seconds. So, putting these values in the above relation, we get :
Retardation = 6m/s6s
= 1 m/s2 ...(2)
(f) We will now find out the distance travelled by the body in moving from A to B (Figure 40). We have studied that in a speed-time graph, the distace travelled by the body is equal to the area enclosed between the speed-time graph and the time-axis. Thus,
Distance travelled from A to B = Area under the line AB and the time axis
= Area of rectangle DABE
=DA×DE
Now, from the given graph (Figure 40), we find that DA = 6 m/s and DE = 10 -4 = 6 s. Therefore,
Distance travelled from A to B = 6×6
= 36 m

Topper's Solved these Questions
- MOTION Book:LAKHMIR SINGH & MANJIT KAURChapter:MOTION Exercise:SAMPLE PROBLEM
Explore 1 Video
- MOTION Book:LAKHMIR SINGH & MANJIT KAURChapter:MOTION Exercise:VERY SHORT ANSWER TYPE QUESTIONS
Explore 3 Videos
- MODEL TEST PAPER 5Book:LAKHMIR SINGH & MANJIT KAURChapter:MODEL TEST PAPER 5Exercise:Section B
Explore 2 Videos
- SOUNDBook:LAKHMIR SINGH & MANJIT KAURChapter:SOUNDExercise:Value Based Questions
Explore 20 Videos
Similar Questions
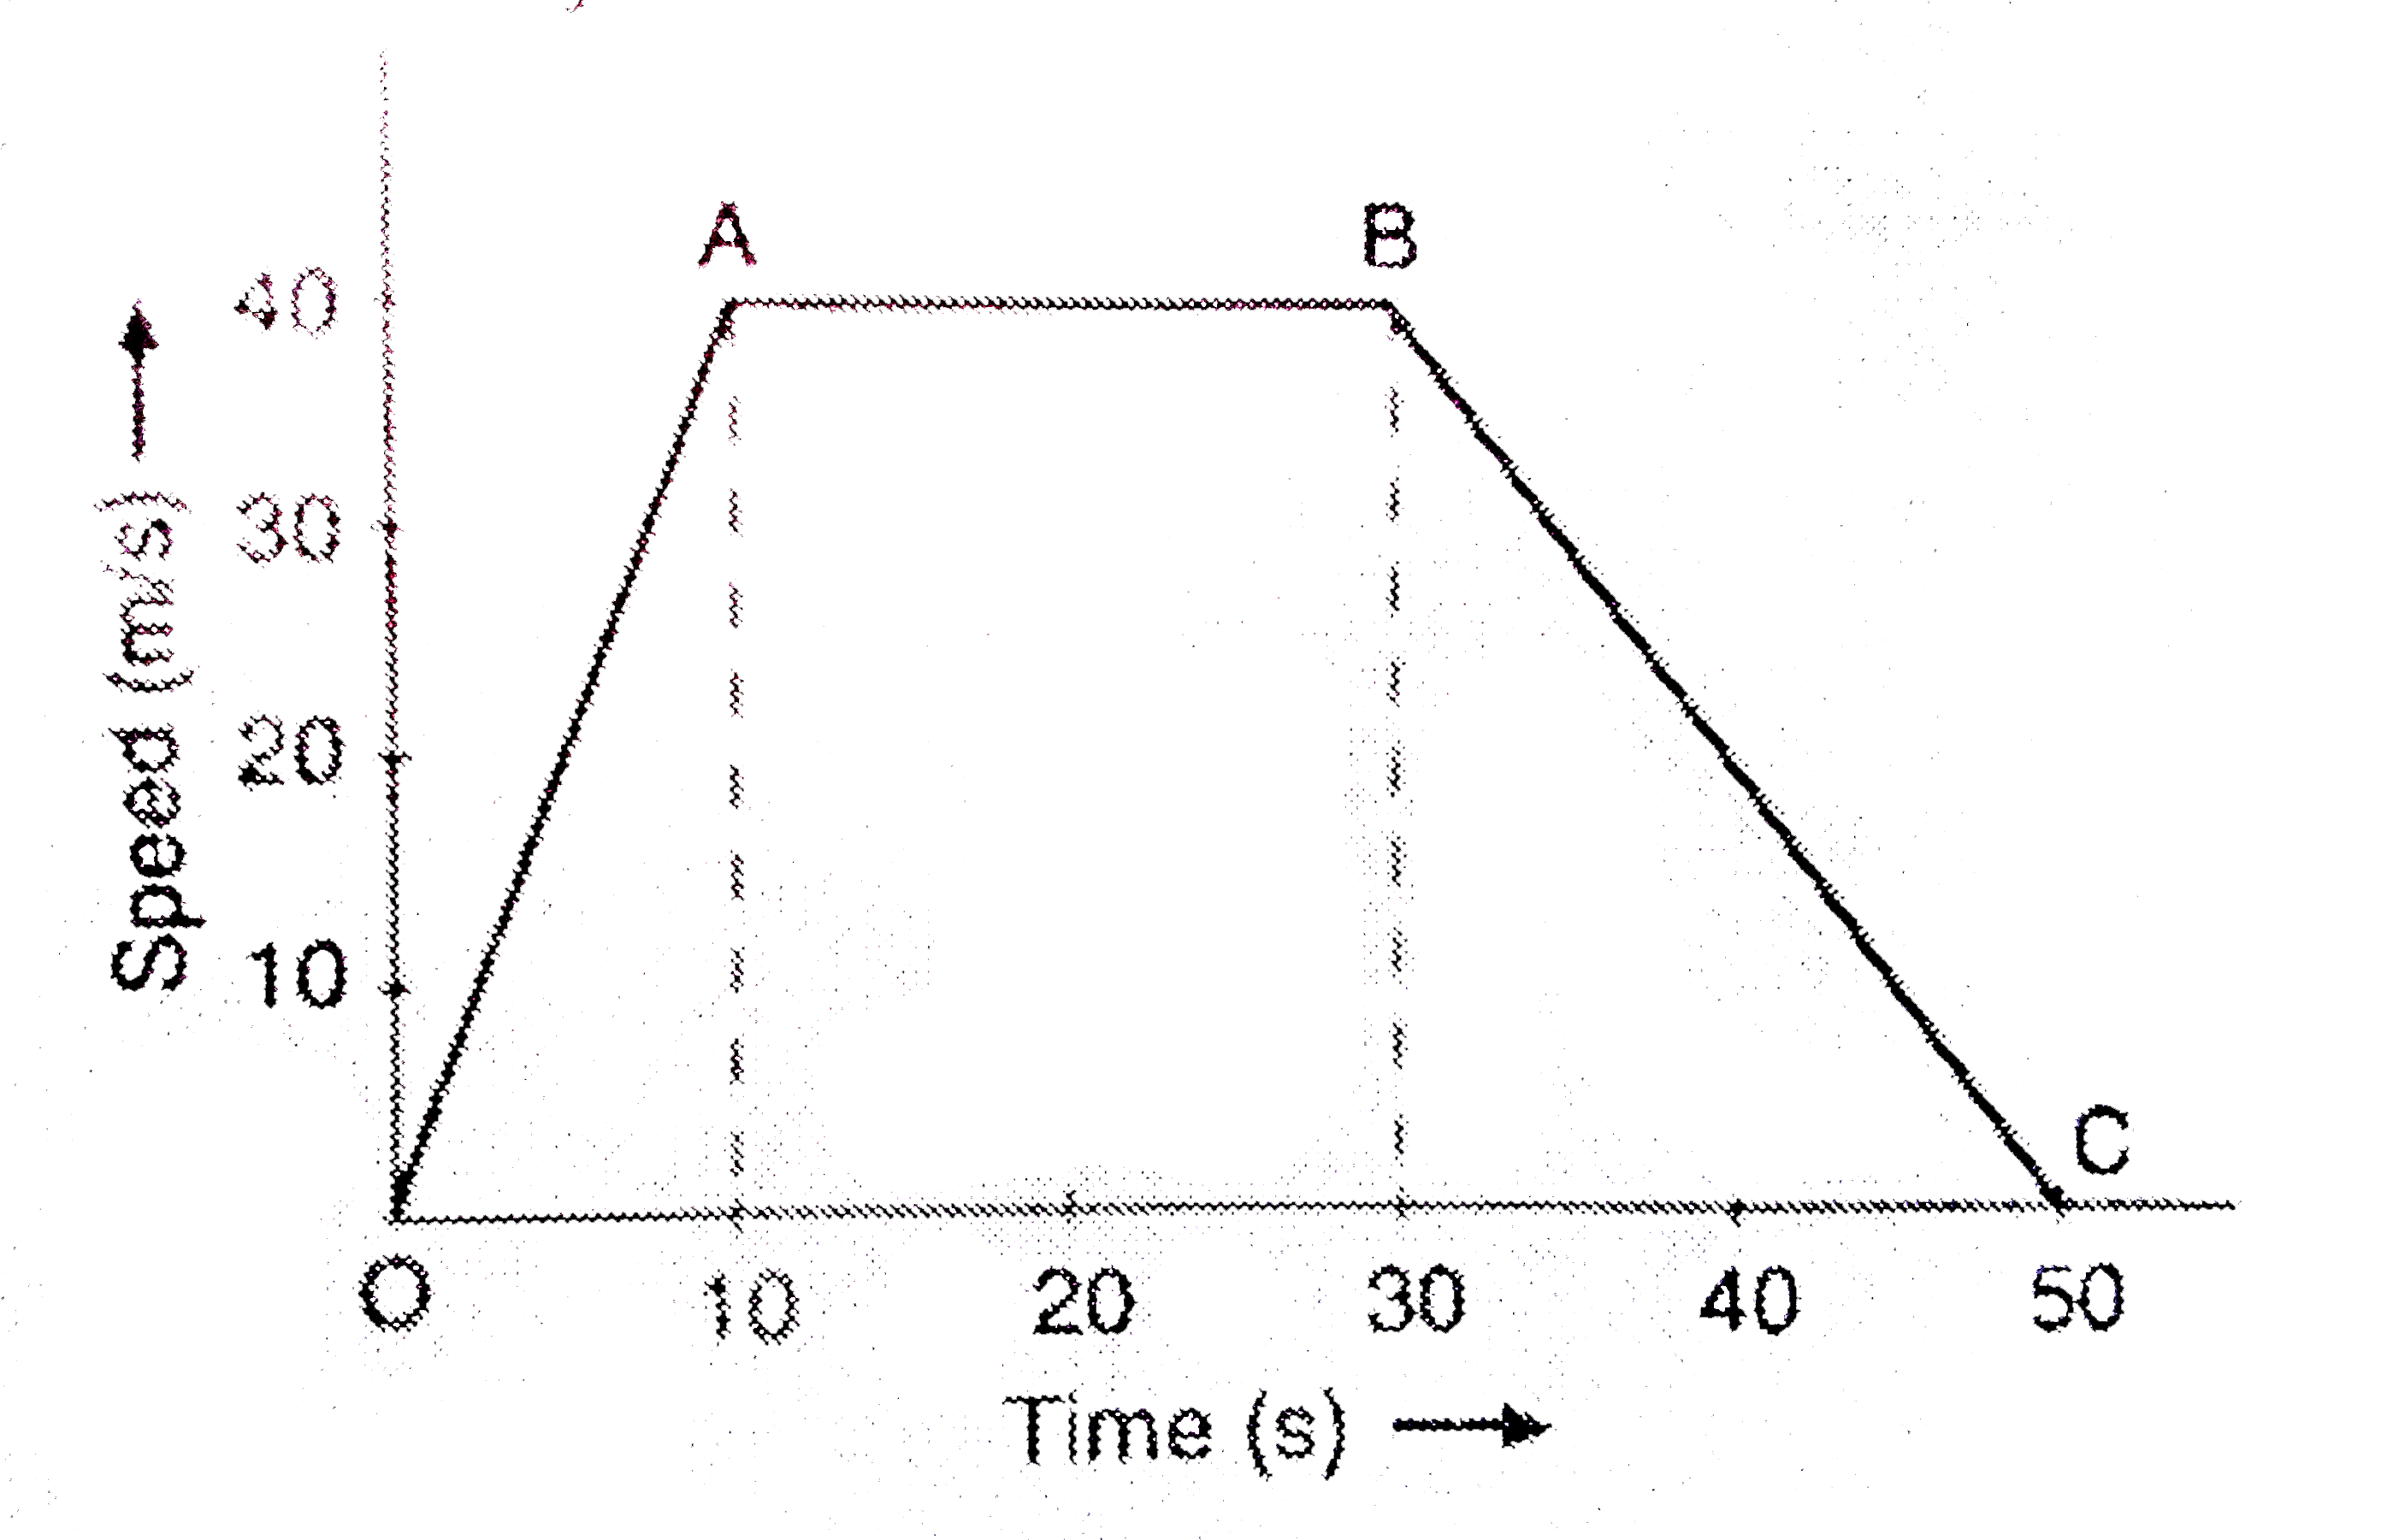
Study the speed-time graph of a car given alongside and answer the following questions :

(i) What type of motion is represented by OA ?
(ii) What type of motion is represented by AB ?
(iii) What type of motion is represented by BC ?
(iv) What is the acceleration of car from O to A ?
(v) What is the acceleration of car from A to B ?
(vi) What is the retardation of car from B to C ?
View SolutionWhat type of motion is represented by each one of the following graphs ?

View SolutionWhat type of motion is represented by the following ?
Soldiers in a march past.
View SolutionWhat type of reaction is represented by the digestion of food in our body?
View SolutionWhat type of reaction is represented by the digestion of food in our body?
View SolutionWhat type of motion is represented by the following ?
Pedals of a moving bicycle.
View SolutionWhat type of motion is represented by the following ?
Hands of an athlete in a race.
View SolutionWhat type of motion is represented by the following ?
Spinning of earth on its axis.
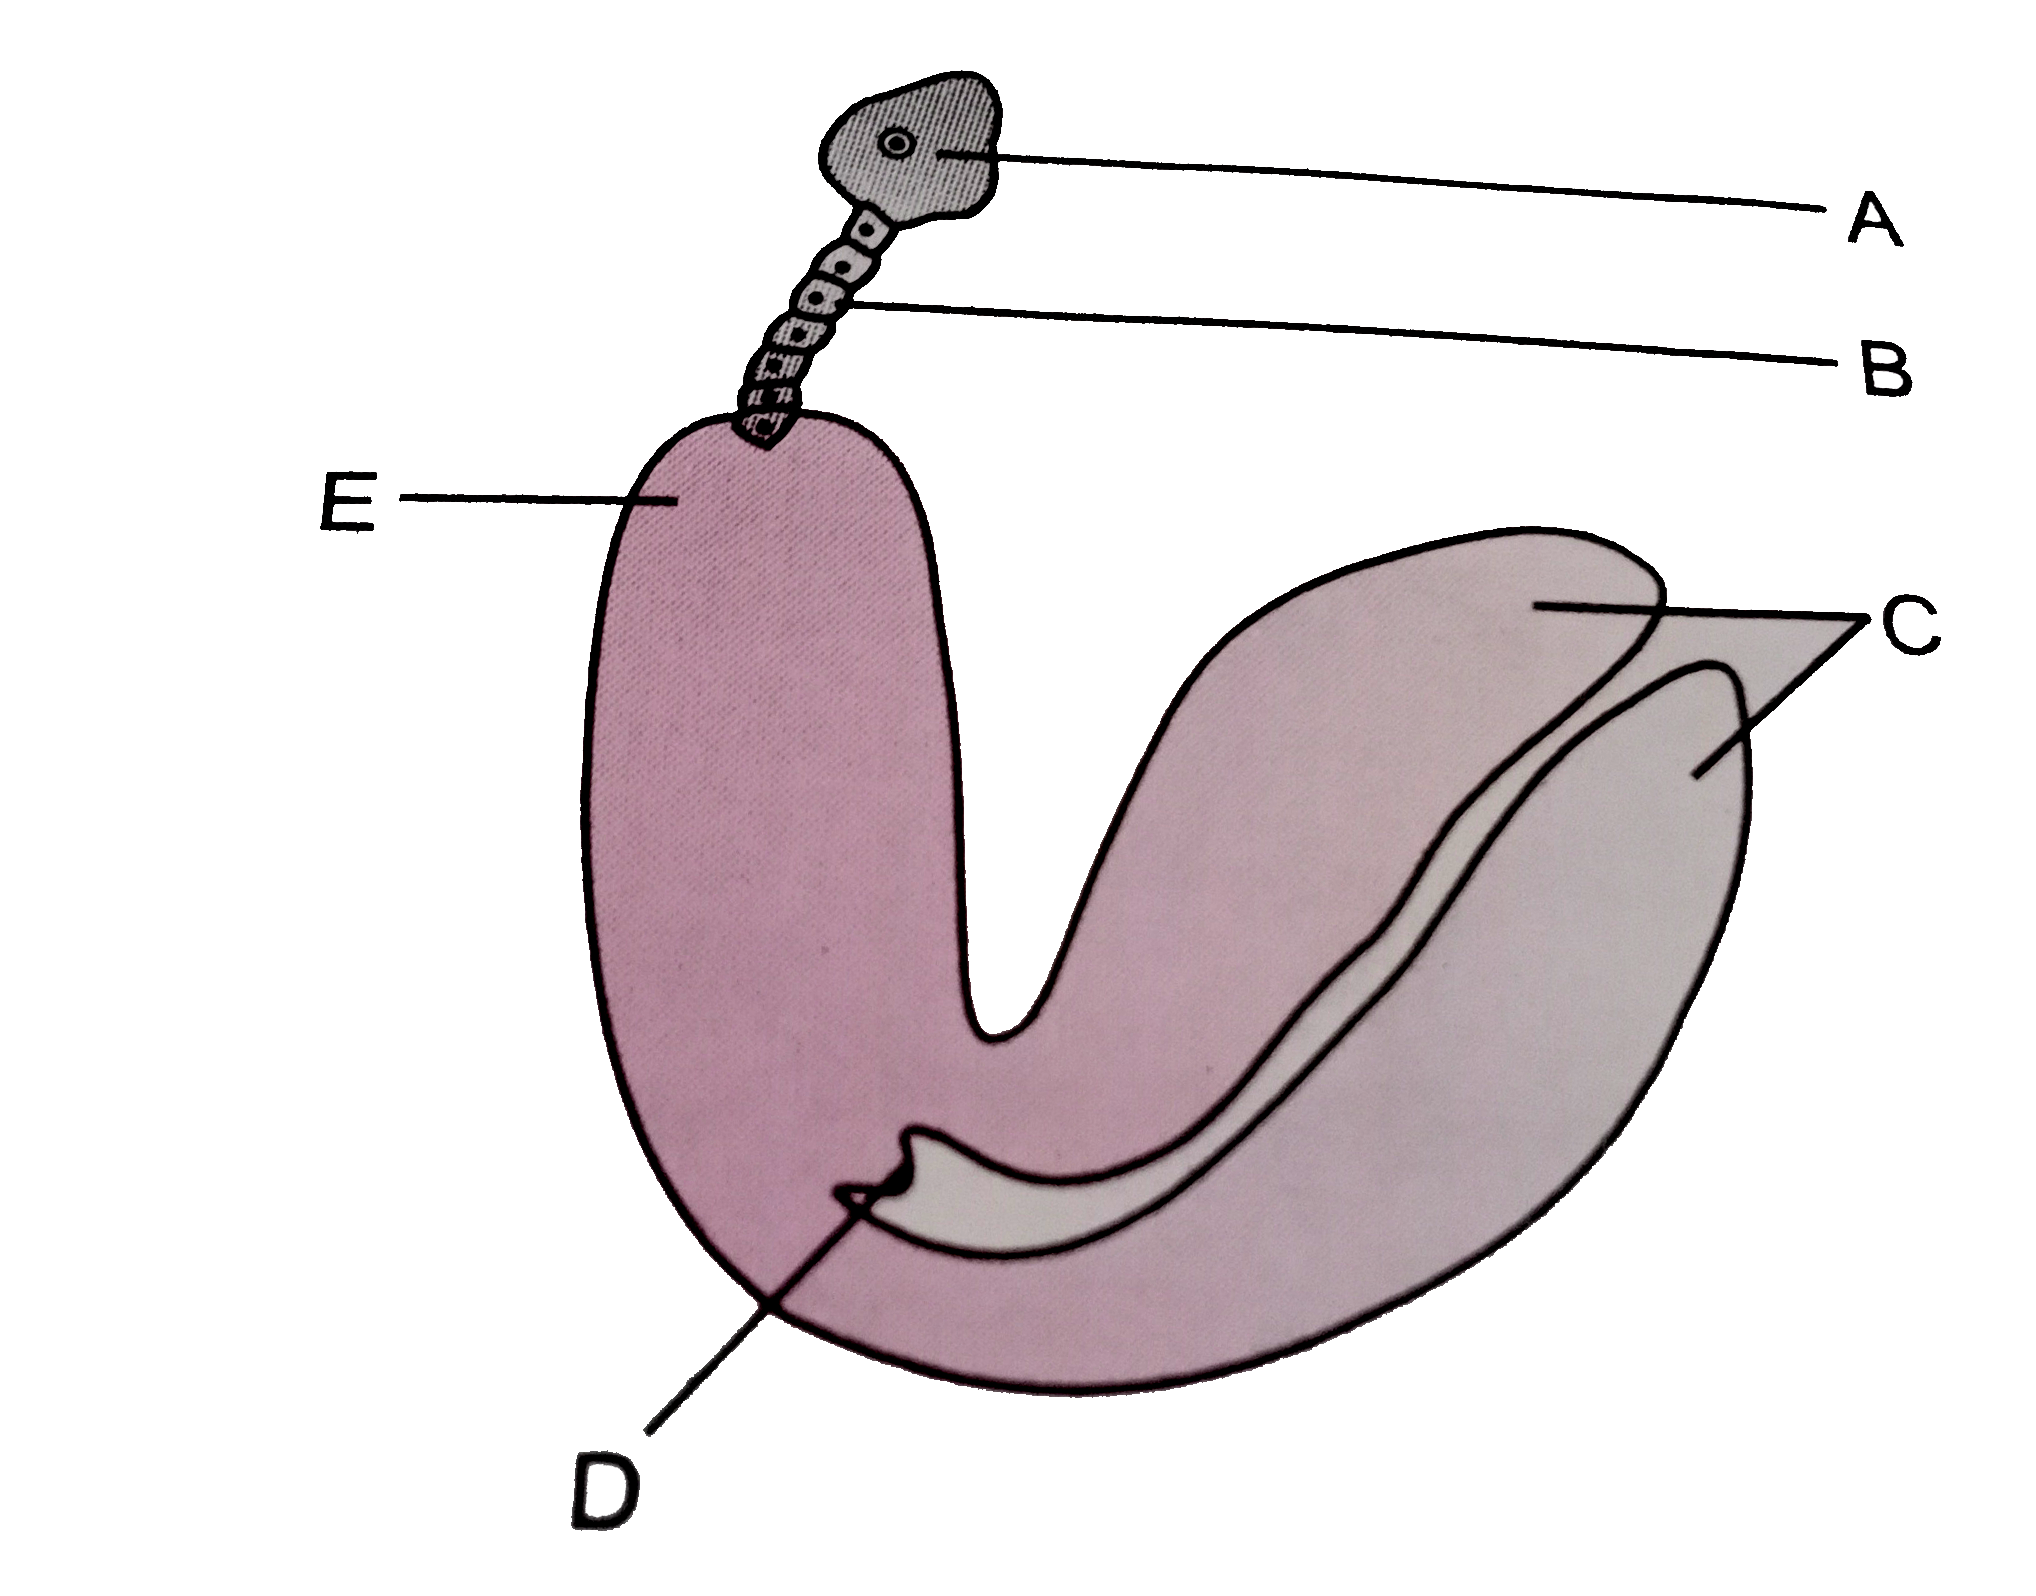
View SolutionObserve the figure and answer the following questions:
(a) What does A,B,C,D and E represent in the given figure?
(b) What type of embryo is shown in figure ?
(c ) What is the function of A and B ?

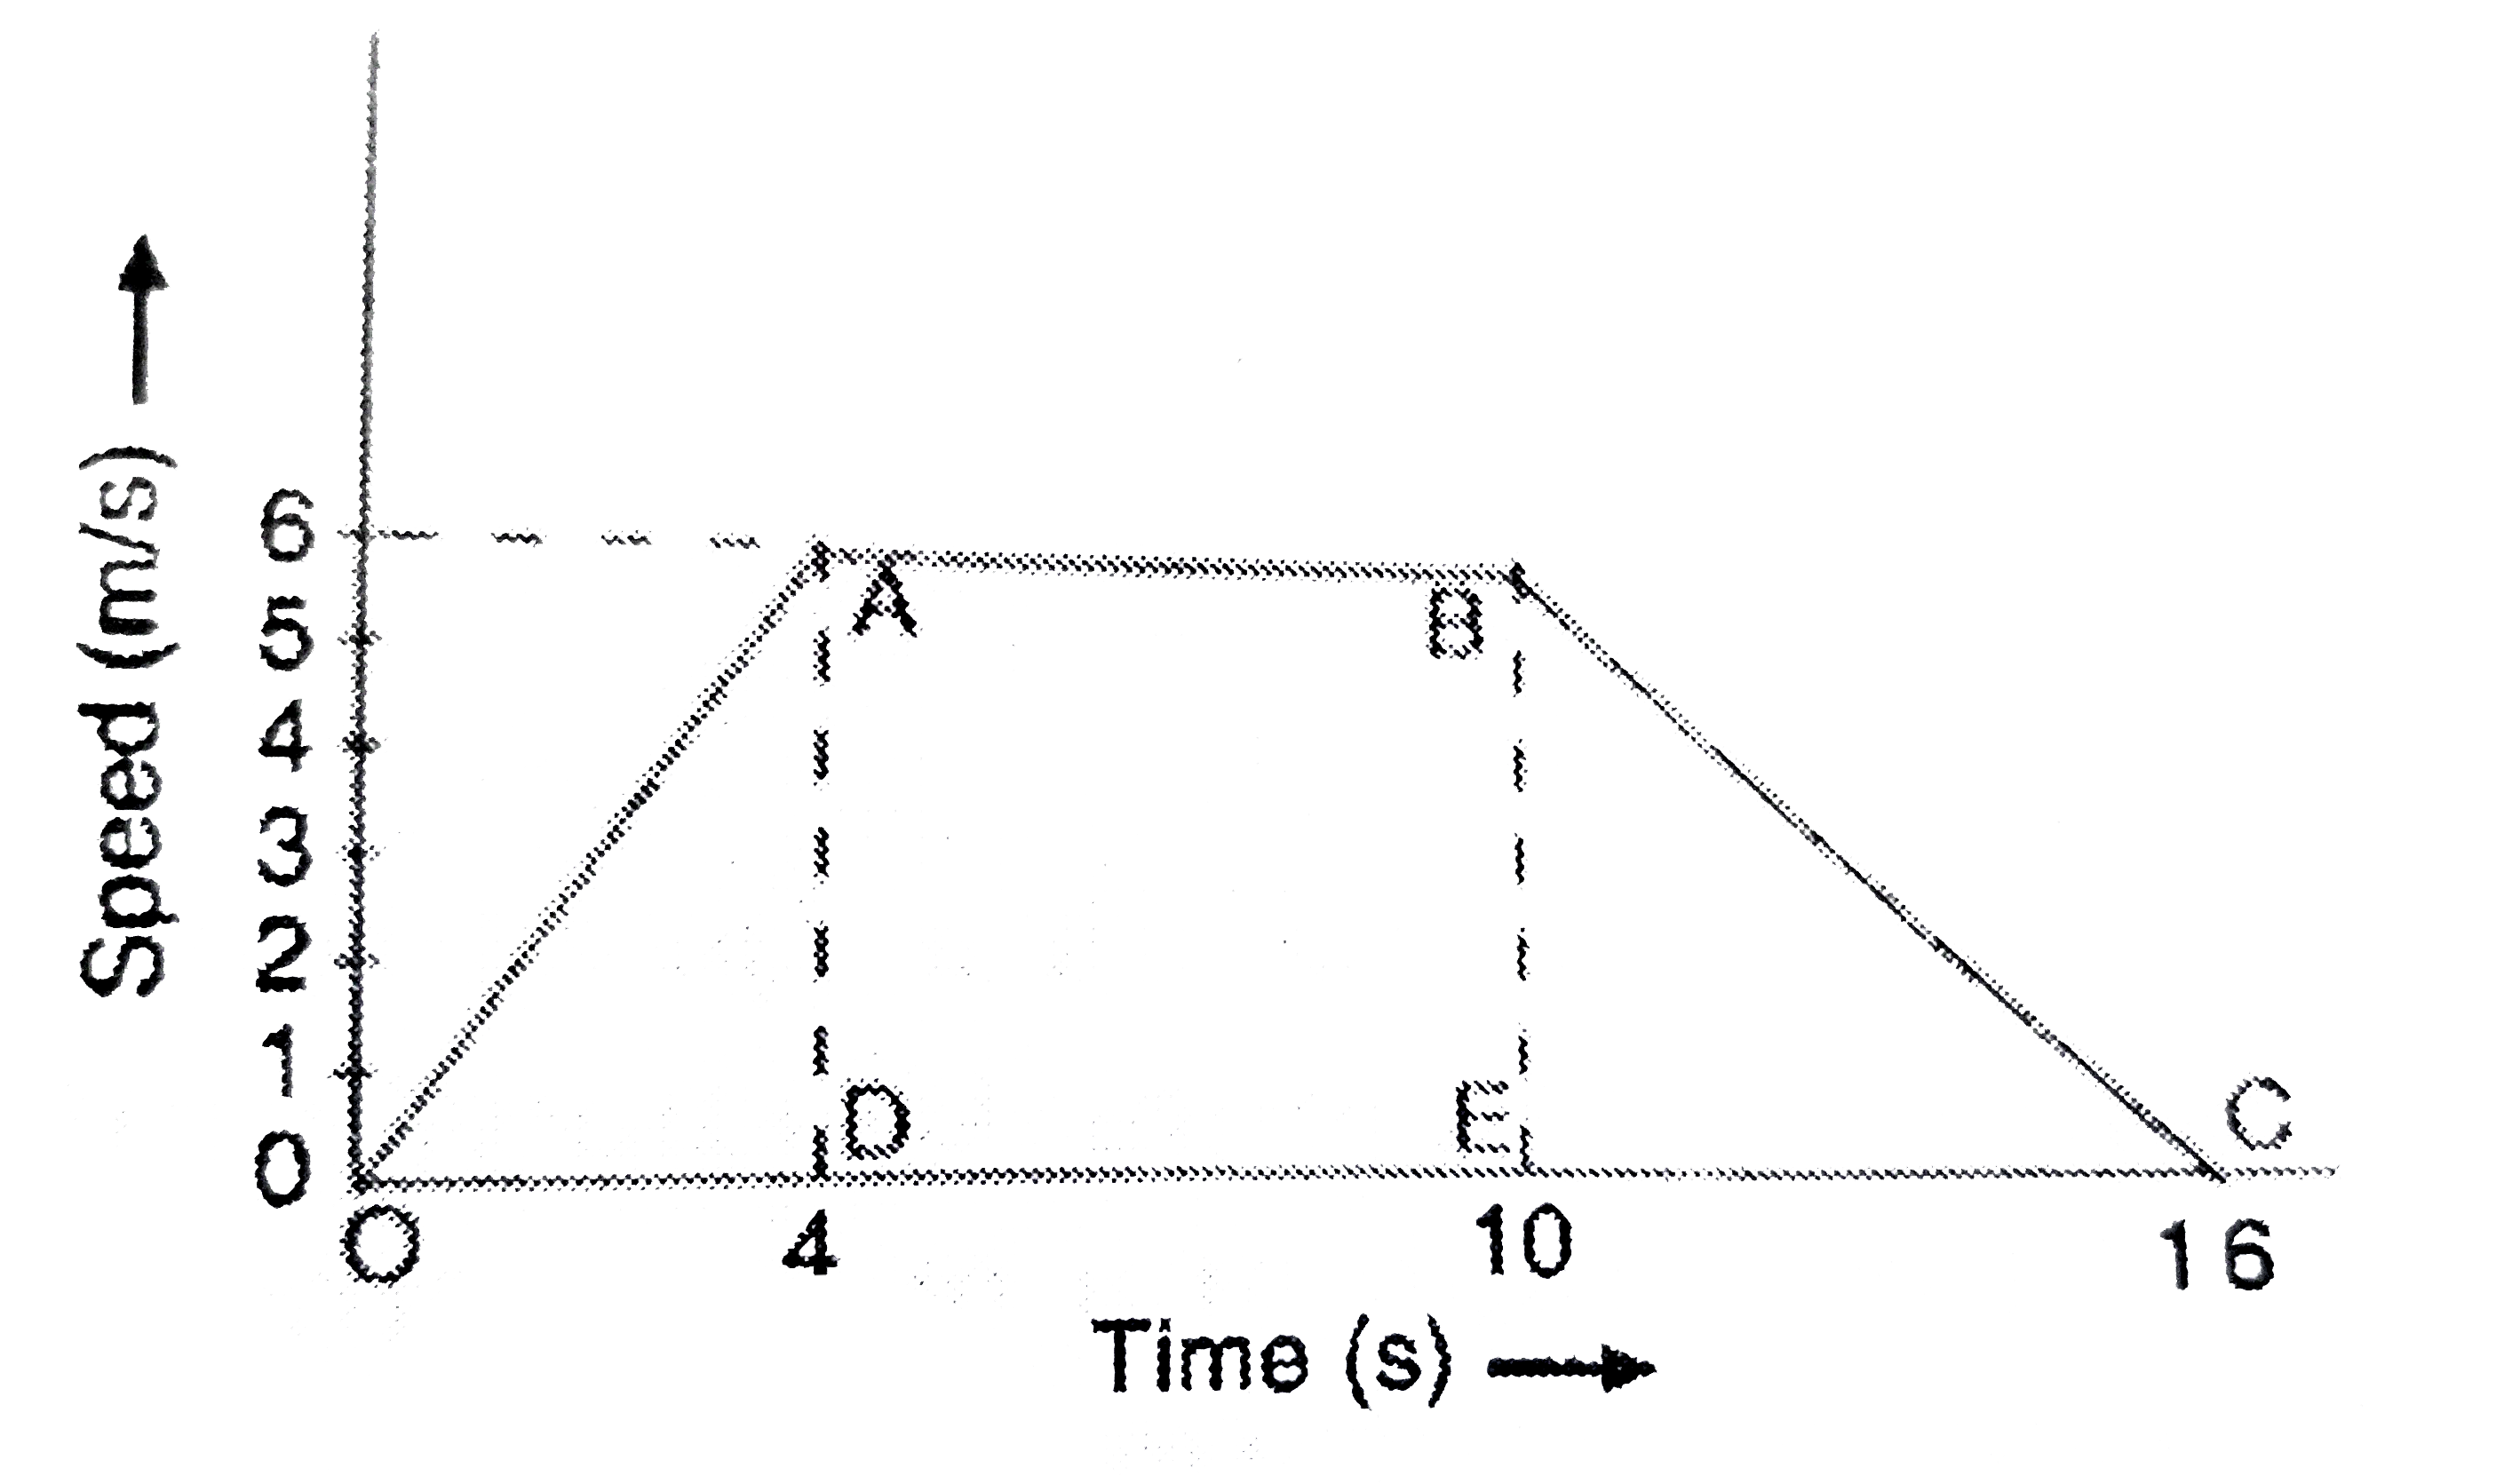
View SolutionThe speed time graph of a body is as shown in Figure. Calculate
(i) acceleration of body, (ii) retardation of body, (iii) total distance travelled by the body.
View Solution
