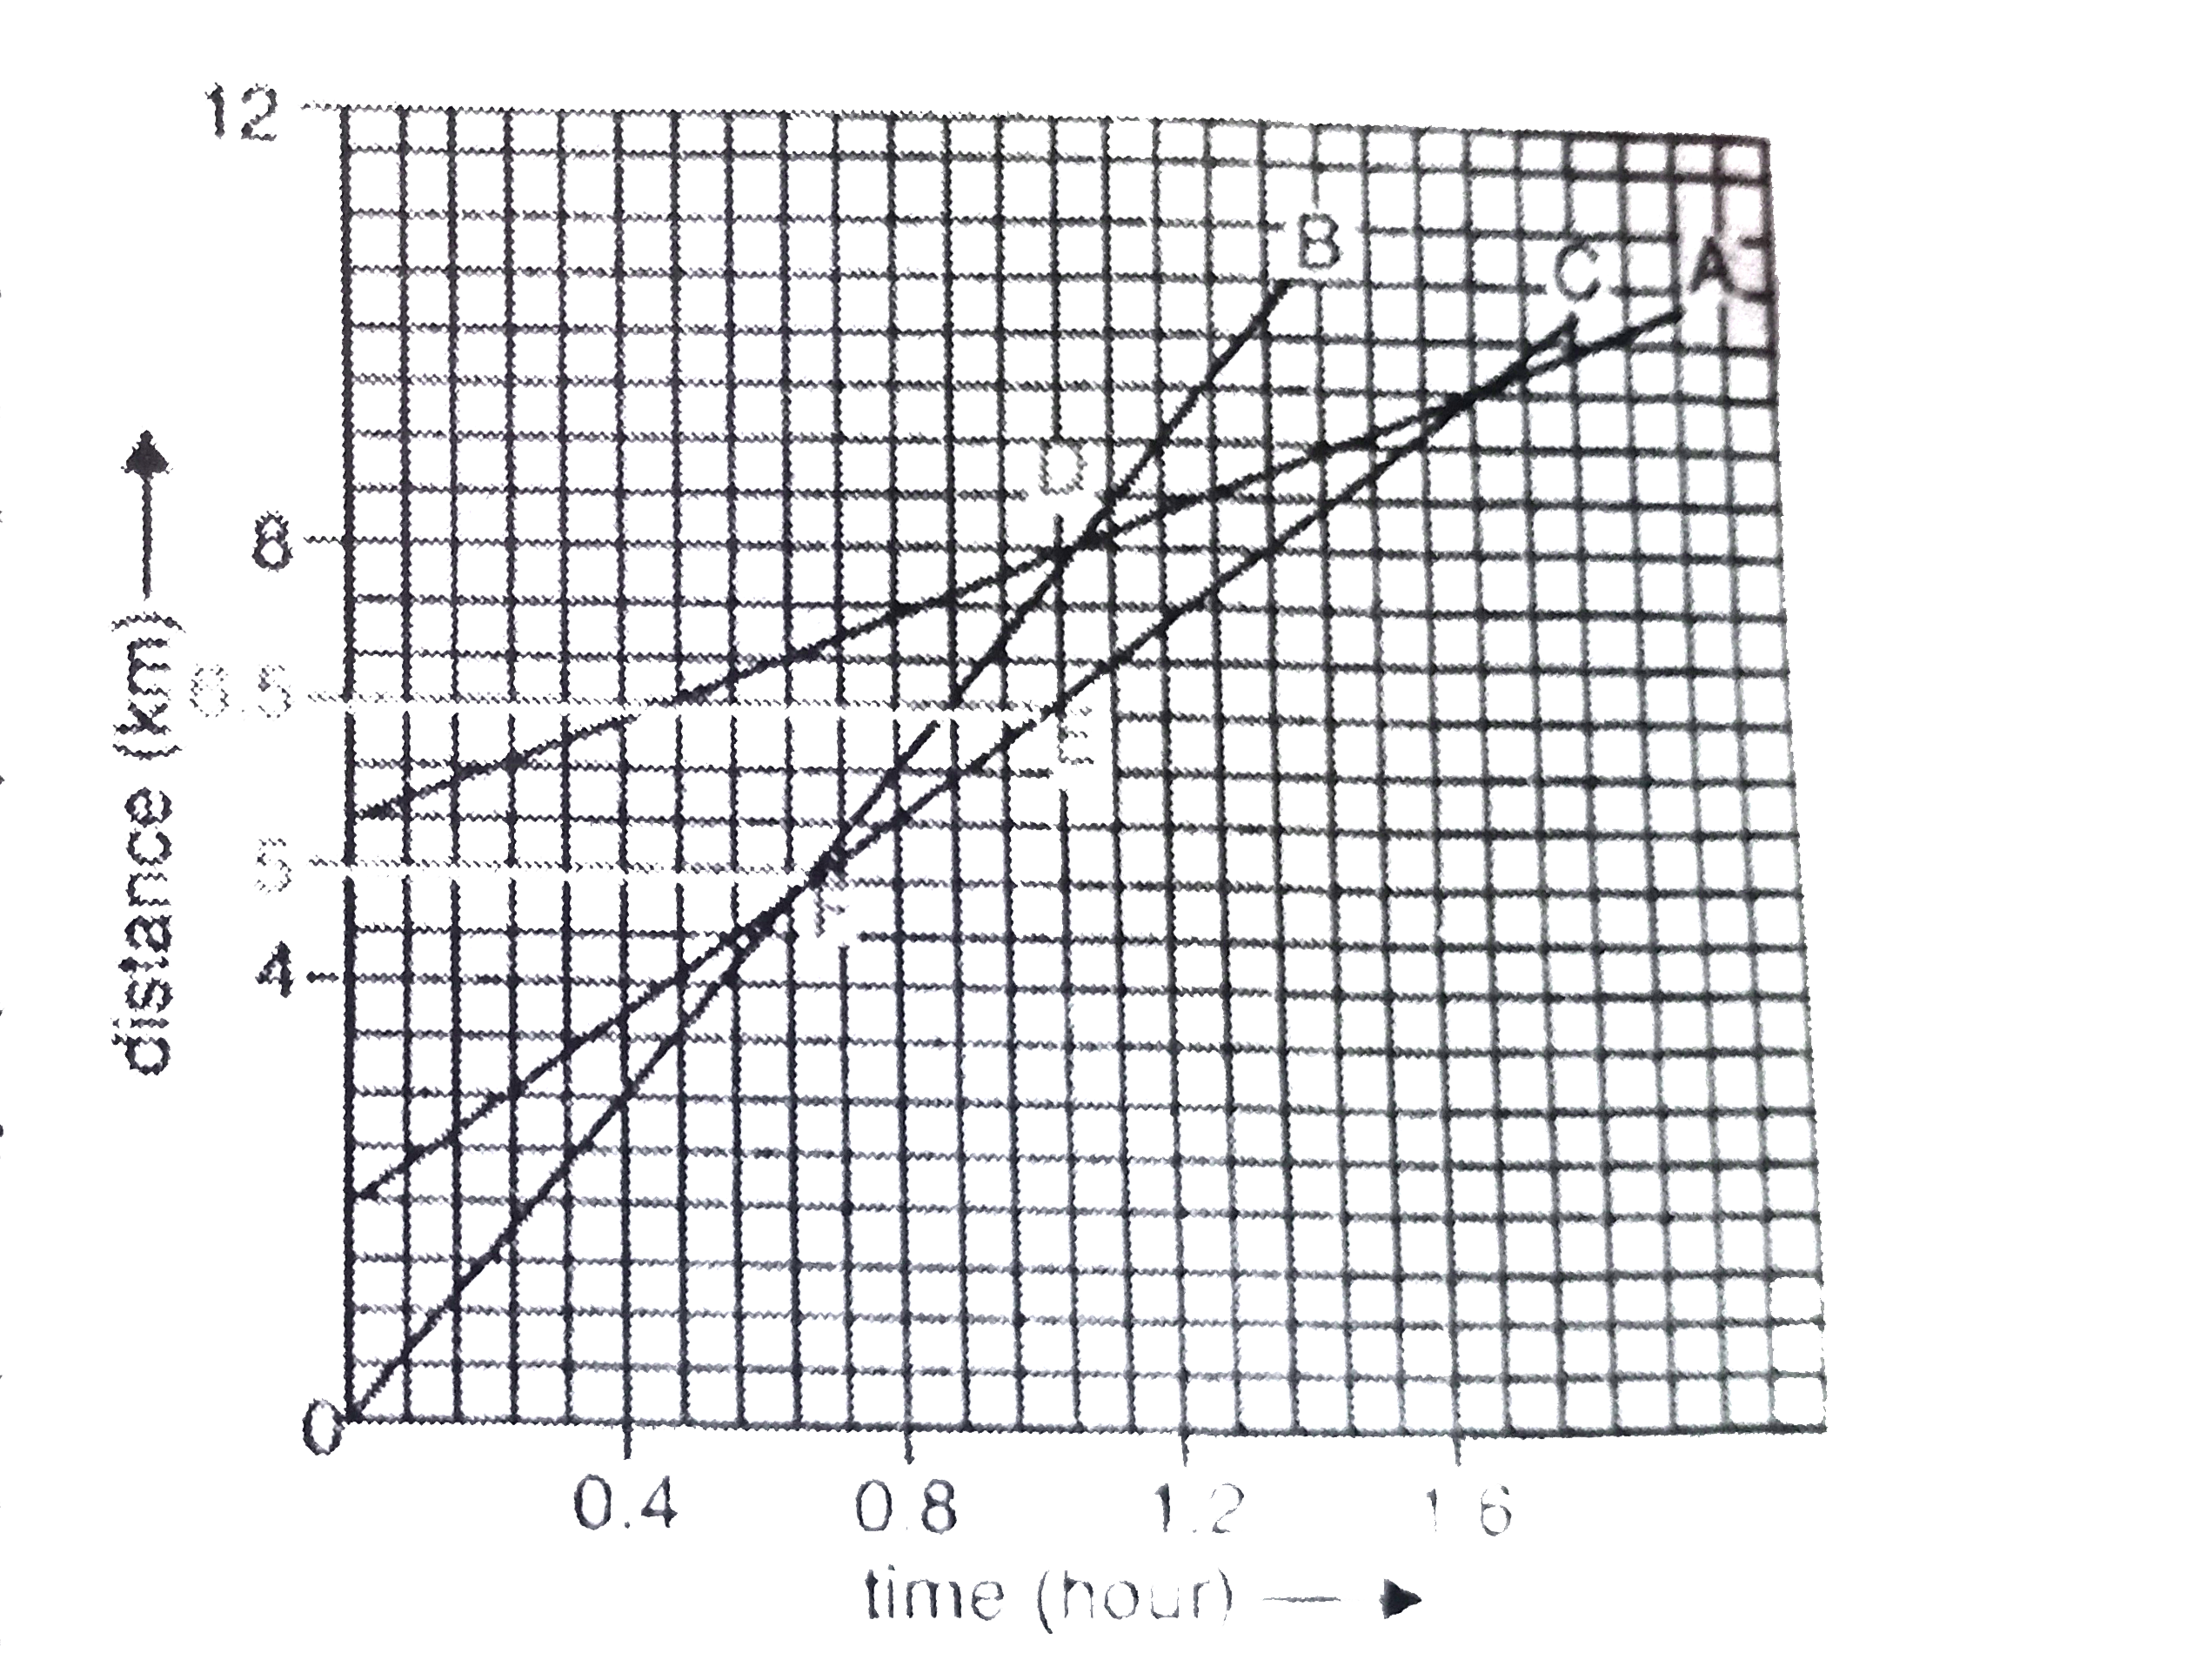
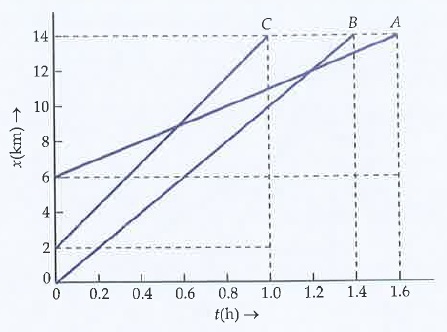
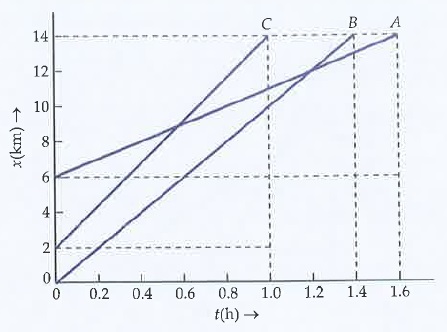
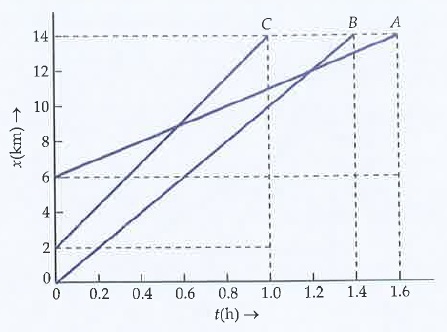
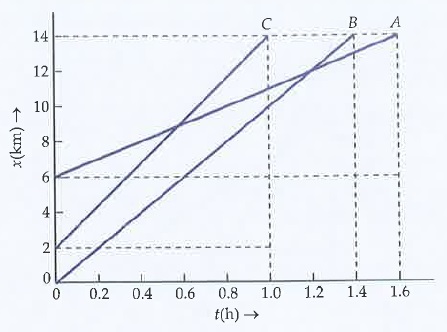
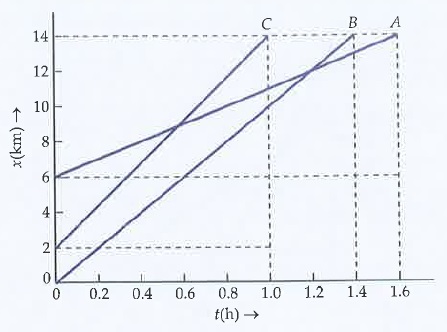
Figure shows the distance-time graph of three object A,B and C. Study the graph and answer the following questions :
(a) Which of the three is travelling the fastest ?
(b) Are all three ever at the same point on the road ?
( c) How far has C travelld by when B passes A ?
(d) How far has B travelled by the time it passes C ?
(a) The slope of distance-time graph of a moving object indicates its speed. Greater the slope, higher is the speed. Now, in the given figure, the slope of distance-time graph of object B is the maximum, so the object B is travelling the fastest.
(b) In order to be at the same point on the road, the respective distance and time values for all the three moving objects should be the same. Since the distance-time graph lines of the three objects A, B and C do not cross at a single point, therefore, the three objects are never at the same point on the road.
(c) We can see from the given figure that when B passes A at point D, then the C is at point E. If we locate the distance corresponding to point E on the Y-axis, we find that it is 6.5 km. Thus, C has travelled 6.5 km when B passes A.
(d) The distance-time graphs of B and C meet at point F. If we locate the distance corresponding to point F on the Y-axis, we will find that it is 5 km. Thus, B has travelled 5 km by the time it passes C.
Topper's Solved these Questions
- MOTION BOOK - LAKHMIR SINGH & MANJIT KAURCHAPTER - MOTION EXERCISE - QUESTIONS BASED ON HIGH ORDER THINKING SKILLS (HOTS)
2 Videos
- MODEL TEST PAPER 5BOOK - LAKHMIR SINGH & MANJIT KAURCHAPTER - MODEL TEST PAPER 5EXERCISE - Section B
2 Videos
- SOUNDBOOK - LAKHMIR SINGH & MANJIT KAURCHAPTER - SOUNDEXERCISE - Value Based Questions
20 Videos
Similar Questions
Fig 1.11 show the distance - time graphs of three A,B and C. Study the graph and answer the following question : Which of the three is travelling the fastest ?
View SolutionFig 1.11 show the distance - time graphs of three A,B and C. Study the graph and answer the following question : How far has C travelled when B passes A ?
View SolutionFig 1.11 show the distance - time graphs of three A,B and C. Study the graph and answer the following question : Are all three ever at the same point on the road ?
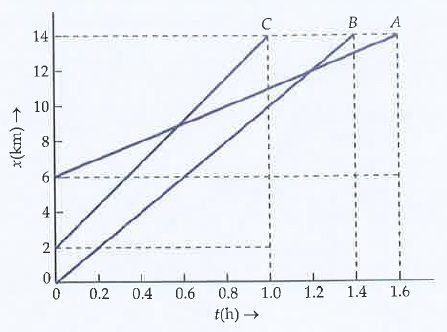
View SolutionFigure 3.64 shows the position-time graphs of three car A, B and C. On the basis of the graphs, answer the following questions : When A passes C, where is B ?
View SolutionFigure 3.64 shows the position-time graphs of three car A, B and C. On the basis of the graphs, answer the following questions : Are the three cars ever at the same point on the road ?
View SolutionFigure 3.64 shows the position-time graphs of three car A, B and C. On the basis of the graphs, answer the following questions : Which car has the highest speed and which the lowest ?
View SolutionFigure shows the position-time graphs of three car A, B and C. On the basis of the graphs, answer the following questions : What is the relative velocity of car B with respect to car C ?
View SolutionFigure shows the position-time graphs of three car A, B and C. On the basis of the graphs, answer the following questions : What is the relative velocity of car C with respect to car A ?
View SolutionFigure 3.64 shows the position-time graphs of three car A, B and C. On the basis of the graphs, answer the following questions : How far did car A travel between the time it passed cars B and C ?
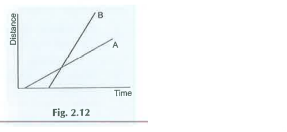
View SolutionFigure 2.12 shows distance-time graphs of two objects A and B. Which object is moving with a greater speed when both are moving ?
View Solution