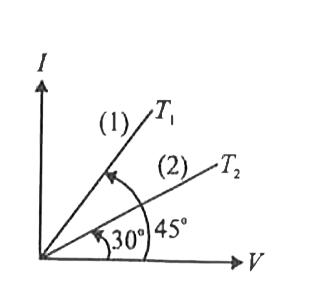
In the following graph, say whether T1>T2 or not.
 Solution in Kannada
Since slope of (1) > slope of (2),
K1>K2,R1<R2 ,since R ∝ temperature. T1<T2.
Topper's Solved these Questions
- CURRENT ELECTRICITYBOOK - SUBHASH PUBLICATIONCHAPTER - CURRENT ELECTRICITYEXERCISE - TWO MARK QUESTIONS AND ANSWERS
19 Videos
- CURRENT ELECTRICITYBOOK - SUBHASH PUBLICATIONCHAPTER - CURRENT ELECTRICITYEXERCISE - THREE MARK QUESTIONS AND ANSWERS
11 Videos
- COMMUNICATION SYSTEMS BOOK - SUBHASH PUBLICATIONCHAPTER - COMMUNICATION SYSTEMS EXERCISE - THREE MARKS QUESTIONS WITH ANSWERS
4 Videos
- DUAL NATURE OF RADIATION AND MATTERBOOK - SUBHASH PUBLICATIONCHAPTER - DUAL NATURE OF RADIATION AND MATTEREXERCISE - NUMERICALS WITH SOLUTIONS
21 Videos
Similar Questions
Mention any two effects of current.
View SolutionA uniform wire of resistance 9Ω is bent to form an equilateral triangle. What is the effective resistance between any two corners of the triangle.
View SolutionOutline the production of an Amplitude Modulated Wave.
View SolutionA photo has a wavelength of 5000 Å. Calculate its momentum.
View SolutionShown below are the black body radiation curves at temperature T_(1) and T_(2) (T_(2) gt T_(1)) . Which of the following plots is correct?
View SolutionIsothermal curves for a given mass of gas are shown at two different temperture T_(1) and T_(2) in Fig. State whether T_(1) gt T_(2) or T_(2)gt T_(1) . Justify your answer.
View SolutionThe V - i graph for a conductor at temperature T_(1) and T_(2) are as shown in the figure. ( T_(2) - T_(1)) is proportional to
View SolutionThe p-V diagrams of same mass of a gas are drawn at two different temperatues T_(1) and T_(2) Explain whether T_(1)gtT_(2)gt or T_(2)gtT_(1).
View SolutionExamine the following plots and predict whether in (i) P_(1) lt P_(2) "and" T_(1) gt T_(2) , in (ii) T_(1) = T_(2)ltT_(3) , in (iii) V_(1) gt V_(2), "in" (iv) P_(1) gt P_(2) "or" P_(2) gt P_(1)
View SolutionGraphs between pressure and volume are plotted at different temperatures . Which of the following isotherms represent Boyle's law as PV = constant ? (T_(1) gt T_(2) gt T_(3))
View SolutionIf X1 and X2 are the susceptibilities of a diamagnetic substance at a absoulte temperature T1 and T2 where T2>T1 then
View SolutionAt two different temperature T_(1) and T_(2), (T_(2) gt T_(1)) , draw two PV-P graphs for a definite amount of an ideal gas.
View SolutionIsothermal curves for a given mass of gas are shown at two different temperture T1andT2 in Fig. State whether T1>T2orT2>T1. Justify your answer.

View Solutionनिम्न चित्रों में T1 तथा T2(T2>T1) ताप पर कृष्ण वस्तु हेतु ऊर्जा वितरण दर्शाये गये हैं, कौन सा ग्राफ सही है
View SolutionThe V - i graph for a conductor at temperature T_(1) and T_(2) are as shown in the figure. ( T_(2) - T_(1)) is proportional to
View Solution
