A graph of electric current along the y-axis and potential difference along the x-axis gives a straight line passing through the origin. What does the slope determine?Solution in Kannada
The correct Answer is:Electrical resistance (R).
Step by step video, text & image solution for A graph of electric current along the y-axis and potential difference along the x-axis gives a straight line passing through the origin. What does the slope determine? by Physics experts to help you in doubts & scoring excellent marks in Class 12 exams.
Updated on:21/07/2023Topper's Solved these Questions
- CURRENT ELECTRICITYBOOK - SUBHASH PUBLICATIONCHAPTER - CURRENT ELECTRICITYEXERCISE - TWO MARK QUESTIONS AND ANSWERS
19 Videos
- CURRENT ELECTRICITYBOOK - SUBHASH PUBLICATIONCHAPTER - CURRENT ELECTRICITYEXERCISE - THREE MARK QUESTIONS AND ANSWERS
11 Videos
- COMMUNICATION SYSTEMS BOOK - SUBHASH PUBLICATIONCHAPTER - COMMUNICATION SYSTEMS EXERCISE - THREE MARKS QUESTIONS WITH ANSWERS
4 Videos
- DUAL NATURE OF RADIATION AND MATTERBOOK - SUBHASH PUBLICATIONCHAPTER - DUAL NATURE OF RADIATION AND MATTEREXERCISE - NUMERICALS WITH SOLUTIONS
21 Videos
Similar Questions
Mention any two effects of current.
View SolutionA uniform wire of resistance 9Ω is bent to form an equilateral triangle. What is the effective resistance between any two corners of the triangle.
View SolutionOutline the production of an Amplitude Modulated Wave.
View SolutionA photo has a wavelength of 5000 Å. Calculate its momentum.
View SolutionRepresenting the stopping potential V along y-axis and ((1)/(lamda)) along x-axis for a given photocathode, the curve is a straight line, the slope of which is equal to
View SolutionA straight conductor is placed along the axis of a circular coil perpendicular to the plane of the coil. Then electric current is passed through both,
View SolutionIf a graph is plotted taking the temperature in Fahrenheit along the Y -axis and the corresponding temperature in Celsius along the X -axis, it will be a straight line
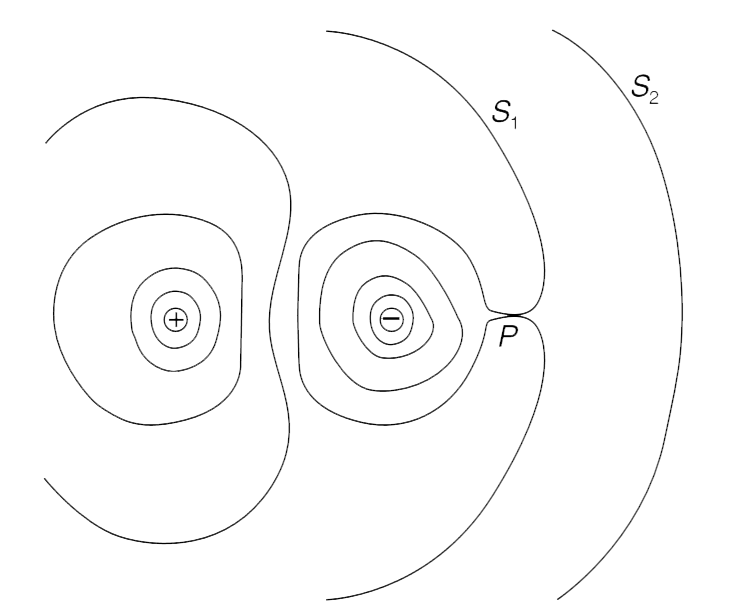
View SolutionThree point charge have been placed along the x axis at points A, B and C. Distance AB = BC. The field lines generated by the system is shown in figure. (a) Plot the variation of electric potential along x axis. Show potential on y axis of your graph. (b) Plot the variation of electric potential along y axis with B as origin. Shows potential on x axis in your graph.

View SolutionThe slope of the graph showing the variation of potential difference V on X-axis and current Y-axis gives conductor
View Solutionउस रेखा की प्रवणता ज्ञात कीजिए, जो प्रथम चतुर्थांश में Y अक्ष के साथ 30∘ का कोण बनाती हो तथा मूलबिंदु से गुजरती है
View SolutionA graph is drawn between centigrade temperatures of a body along x-axis and corresponding Fahrenheit temperatures along y-axis. Slope of the graph is
View SolutionFor a freely falling body the acceleration graph is - (A) Straight line parallel to the acceleration axis. (B) Straight line parallel ot the time axis. (C) Straight line passing through the origin. (D) Parabola passing through the origin.
View Solutionएक सरल रेखा, l, x- अक्ष के साथ 30∘ का कोण बनाती है, सरल रेखा की ढाल ज्ञात कीजिए।
View SolutionPassage -I:
A graph is drawn between centigrade temperature of a body along x-axis and corresponding Fahrenheit temperature along y-axis.
Slope of the graph is
View SolutionThe slope of the graph showing the variation of potential difference V on X-axis and current Y-axis gives conductor
View Solution
