In Figure, time and distance
graph of a linear motion is given. Two positions of time and distance are
recorded as, when T = 0, D = 2 and when T = 3, D = 8. Using the concept of
slope, find law of motion, i.e., how distance depends upon time.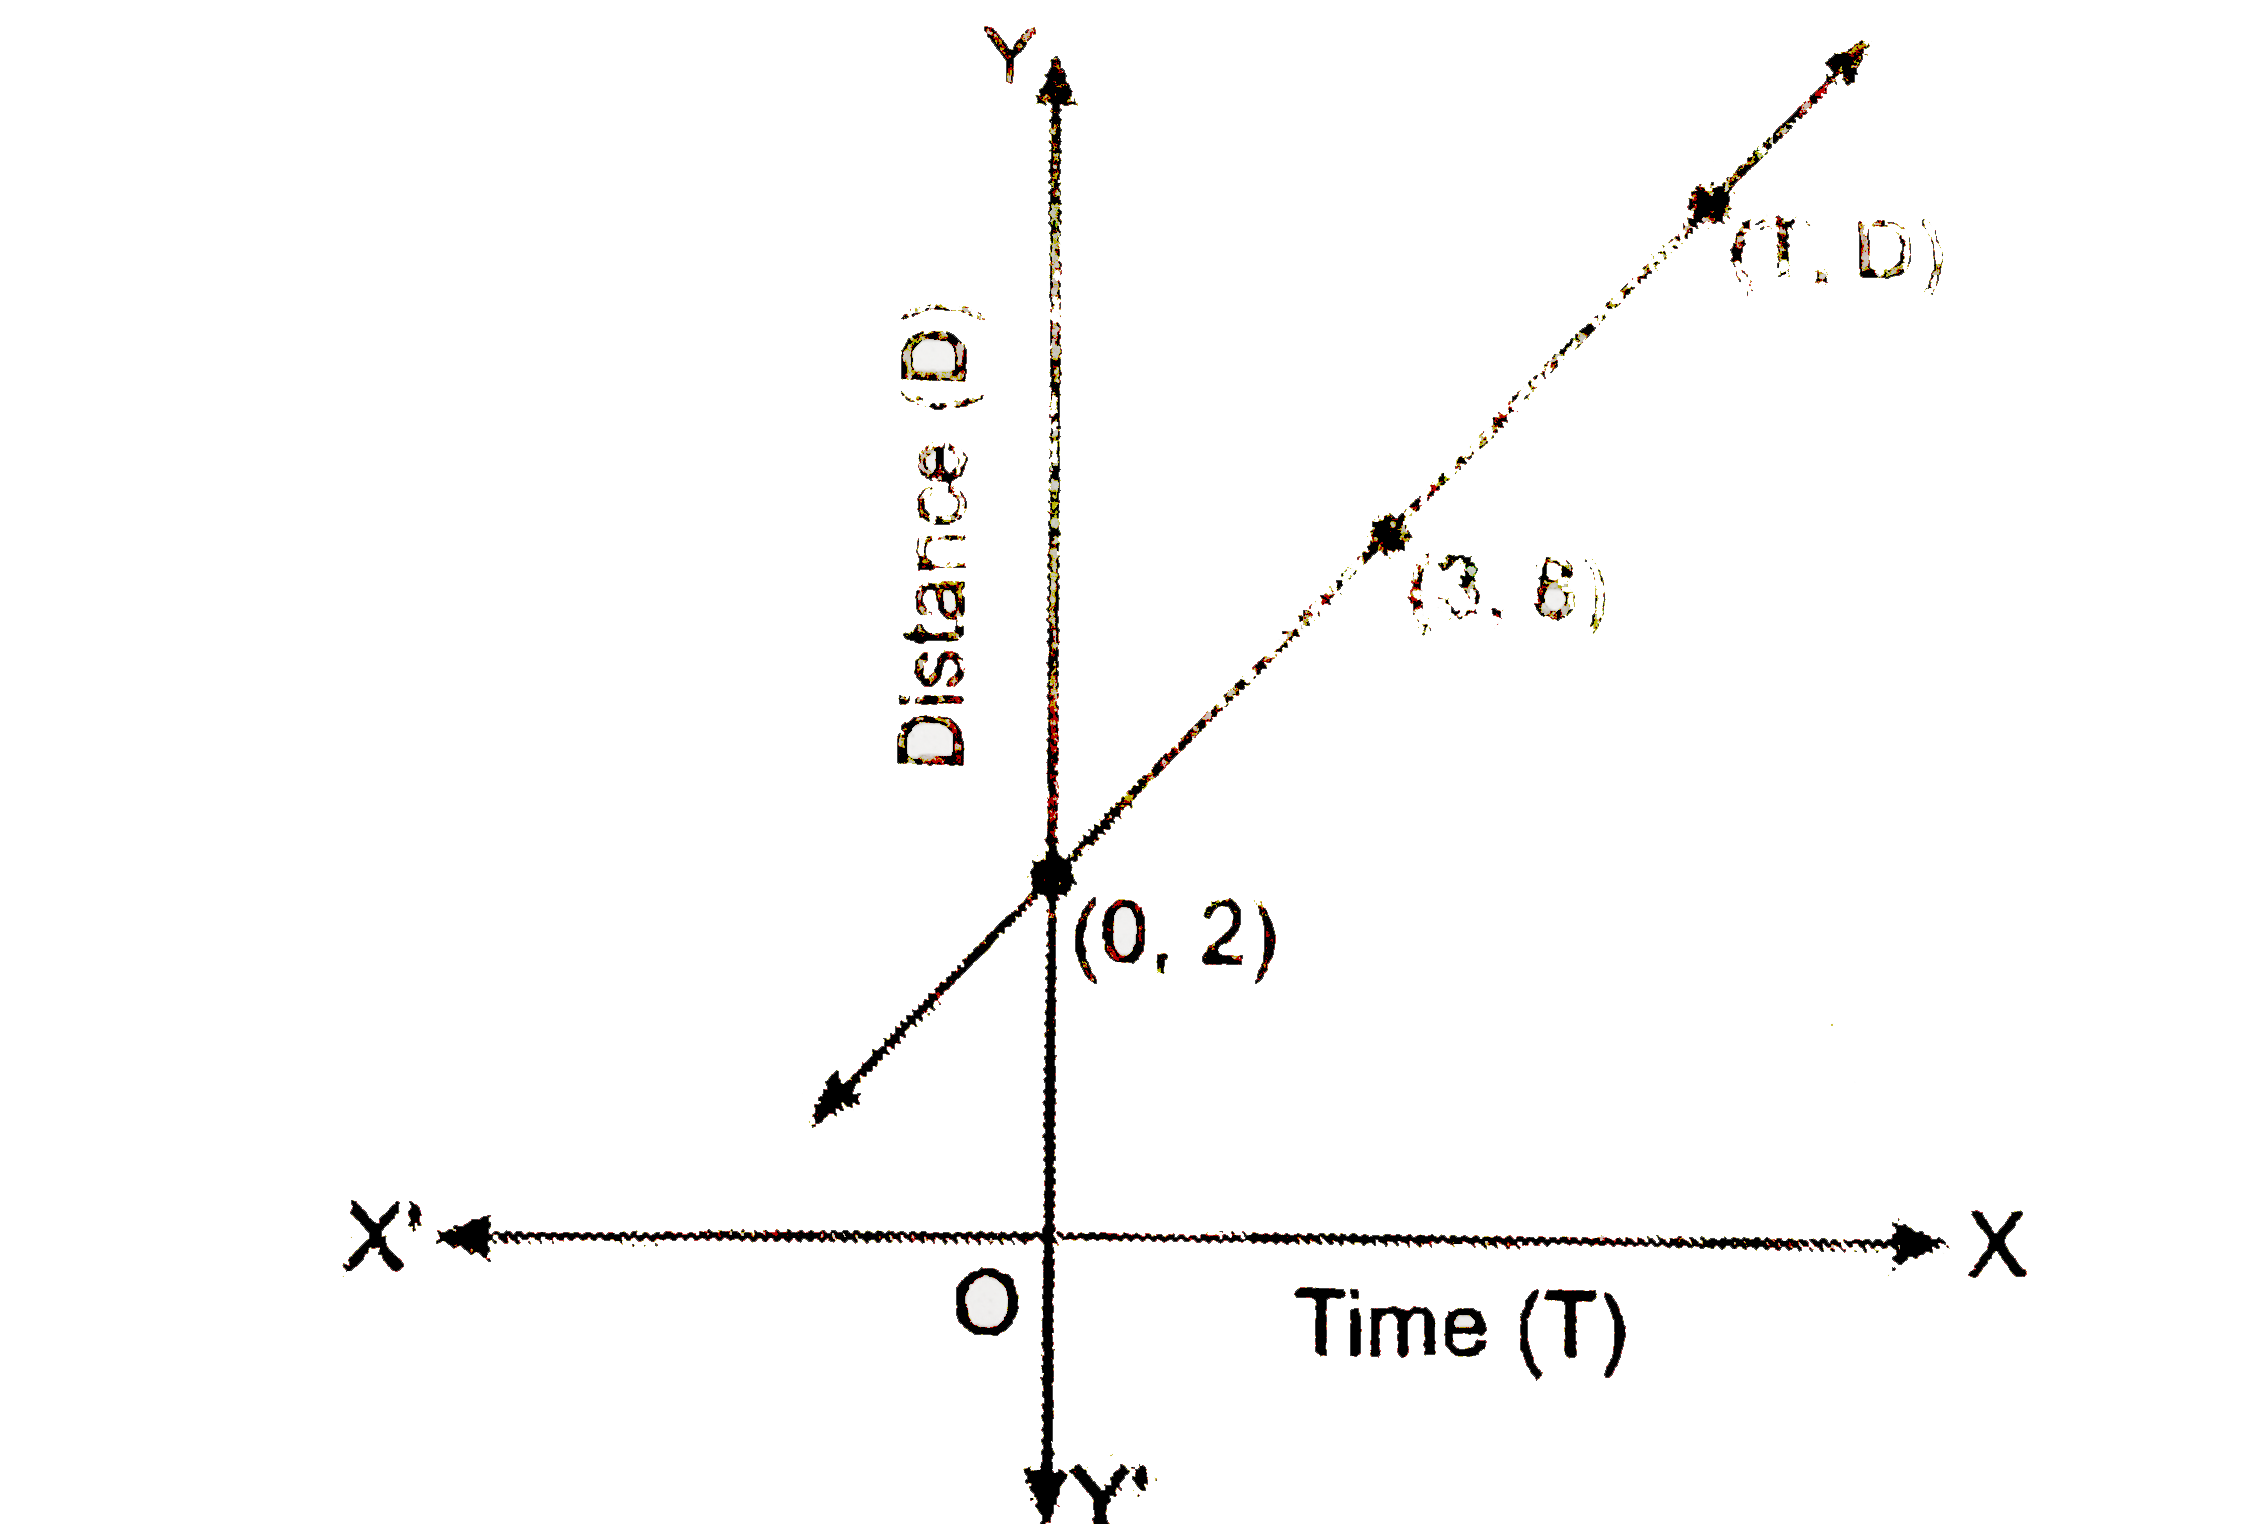
Let (T,D) be any point on the line.

Now, the points (0,2), (3,8) and (T,D) are collinear.
∴ With the help of slopes
8−23−0=D−8T−3
⇒2T−6=D−8
⇒=2T+2
⇒D=2(T+1)
Which is required relation.
Topper's Solved these Questions
- STRAIGHT LINESBook:NAGEEN PRAKASHANChapter:STRAIGHT LINESExercise:Exercise
Explore 206 Videos
- STATISTICSBook:NAGEEN PRAKASHANChapter:STATISTICSExercise:MISCELLANEOUS EXERCISE
Explore 7 Videos
- TRIGNOMETRIC FUNCTIONSBook:NAGEEN PRAKASHANChapter:TRIGNOMETRIC FUNCTIONSExercise:MISCELLANEOUS EXERCISE
Explore 10 Videos
Similar Questions
In Figure, time and distance graph of a linear motion is given. Two positions of time and distance are recorded as, when T = 0, D = 2 and when T = 3, D = 8. Using die concept of slope, find law of motion, i.e., how distance depends upon time.
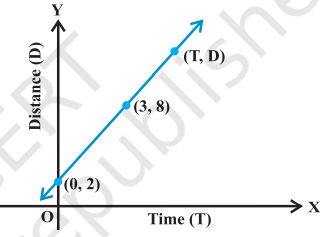
View SolutionIn figure, time and distance graph of a linear motion is given. Two positions of time and distance recorded and when T=0, D=2 and when T=3, D=8. Using the concept of slope, find law of motion i.e. how distance depends upon time.
View Solution
Knowledge Check
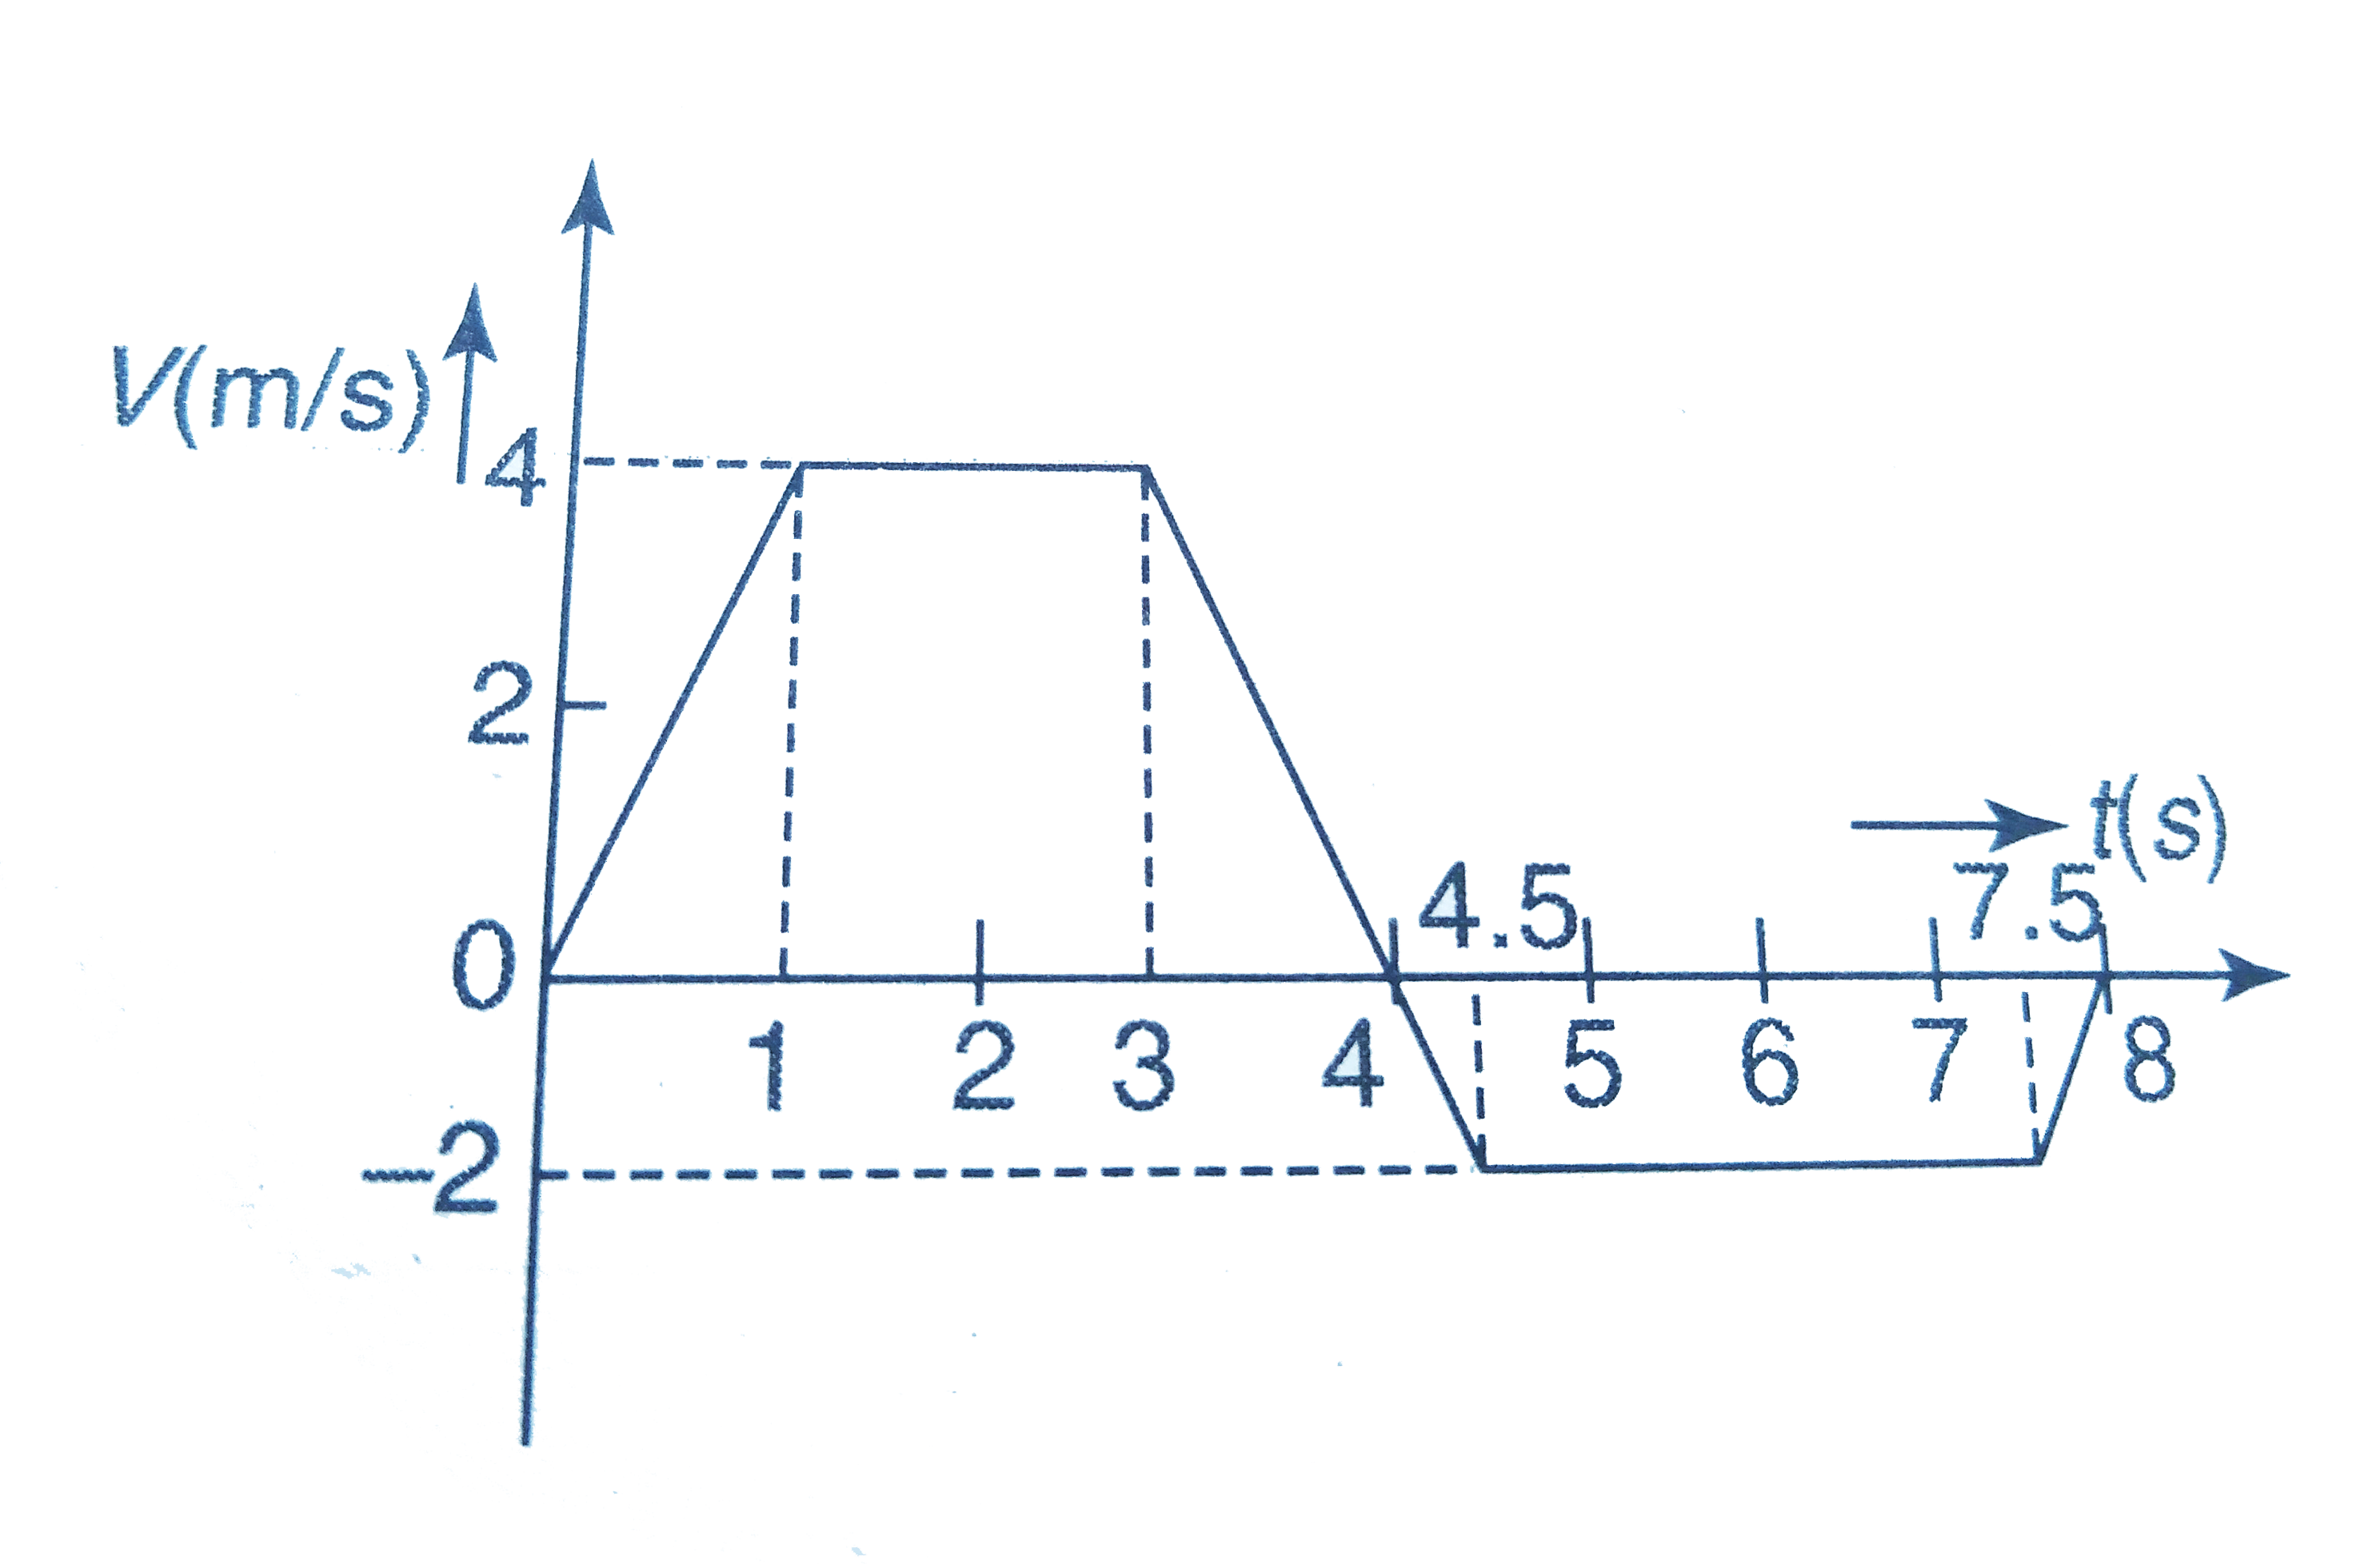
The v-t graph of a linear motion is shown in adjoining figure. The distance from origin after 8 seconds is -
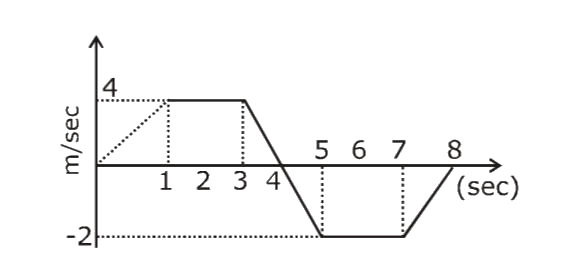 A18 metersB16 metersC8 metersD6 meters
The velocity-time graph of a linear motion is shown below. The distance from the origin after 8 seconds is :
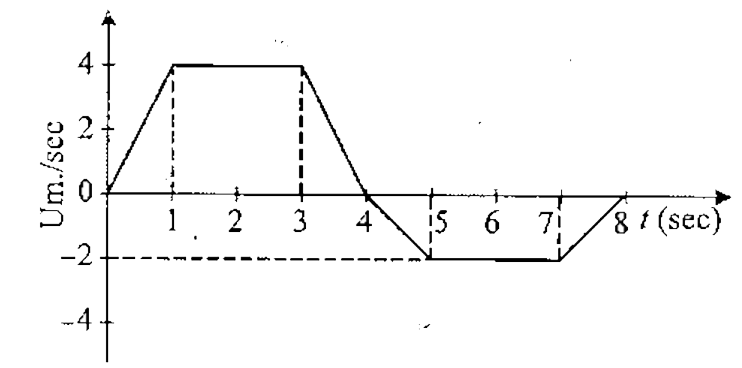 A18 mB16 mC8 mD6 m
The velocity-time graph of a linear motion os shown figure. The distance from the starting point after 8sec is.
 A5 mB16 mC8 mD19 m
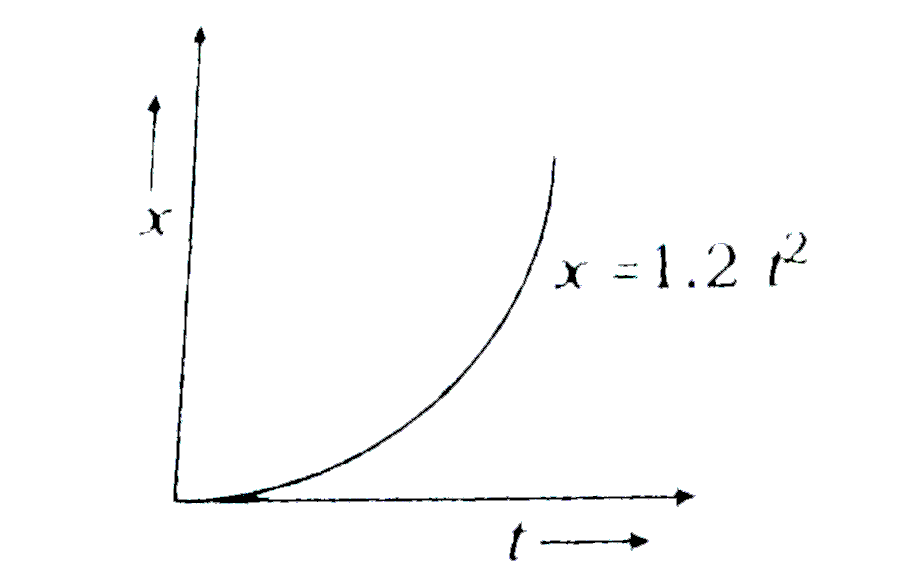
Given figure shows the distance-time graph of the motion of a car. It follows from the,| graph that the car is
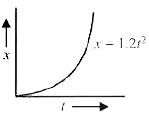
View SolutionFigure given shows the distance - time graph of the motion of a car. It follows from the graph that the car is
View SolutionThe distance-time graph of an object shown in figure 2.E2.
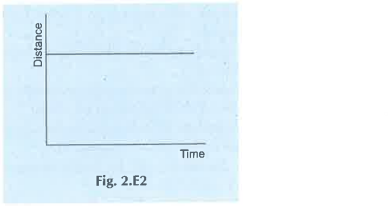
The object
View SolutionThe velocity-time graph of a linear motion is shown in figure. The displacement & distance from the origin after 8 sec is :-
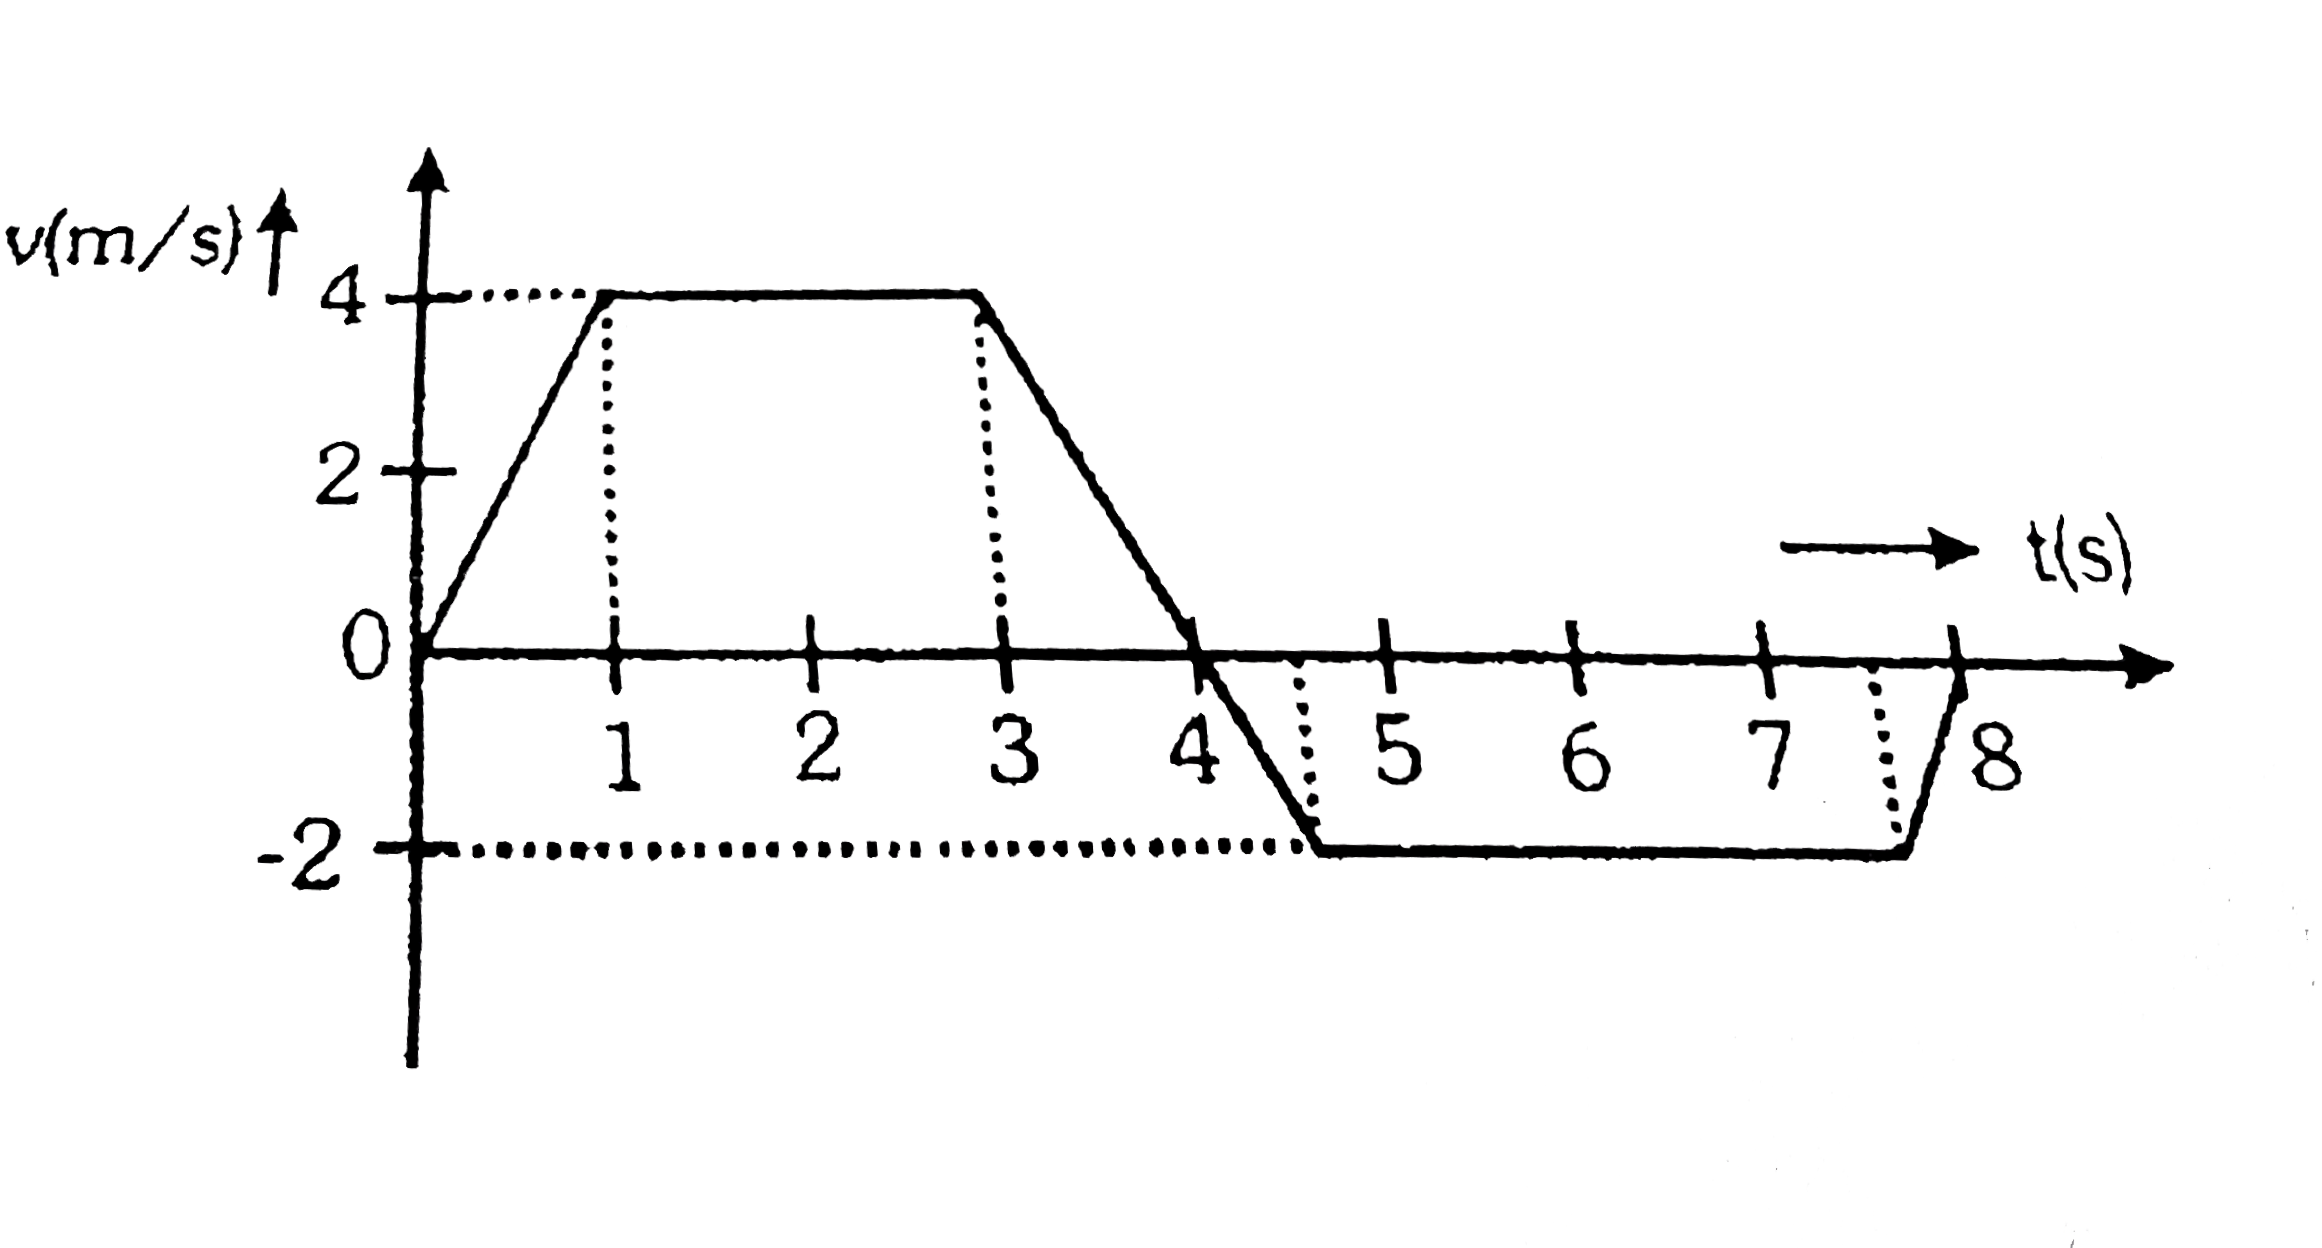
View SolutionThe velocity time graph of a linear motion is shown in the figure. The distance from the starting point after 8 seconds will be
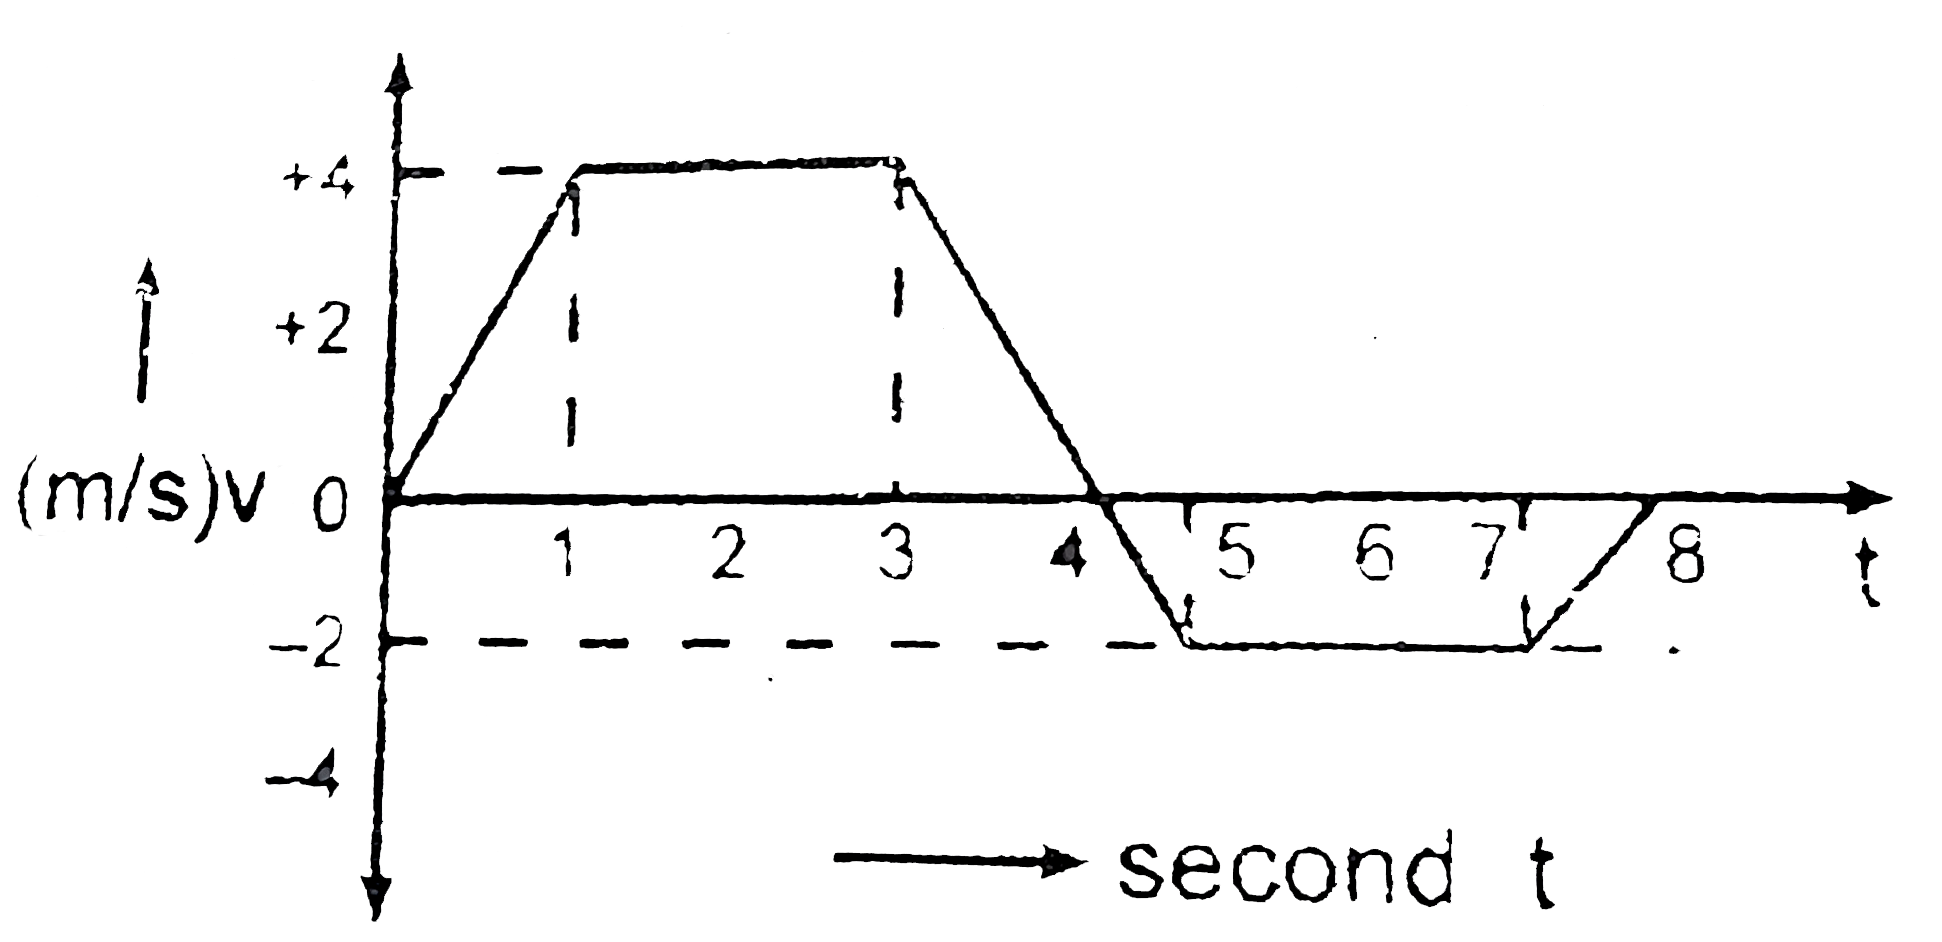 .
.
View Solution
