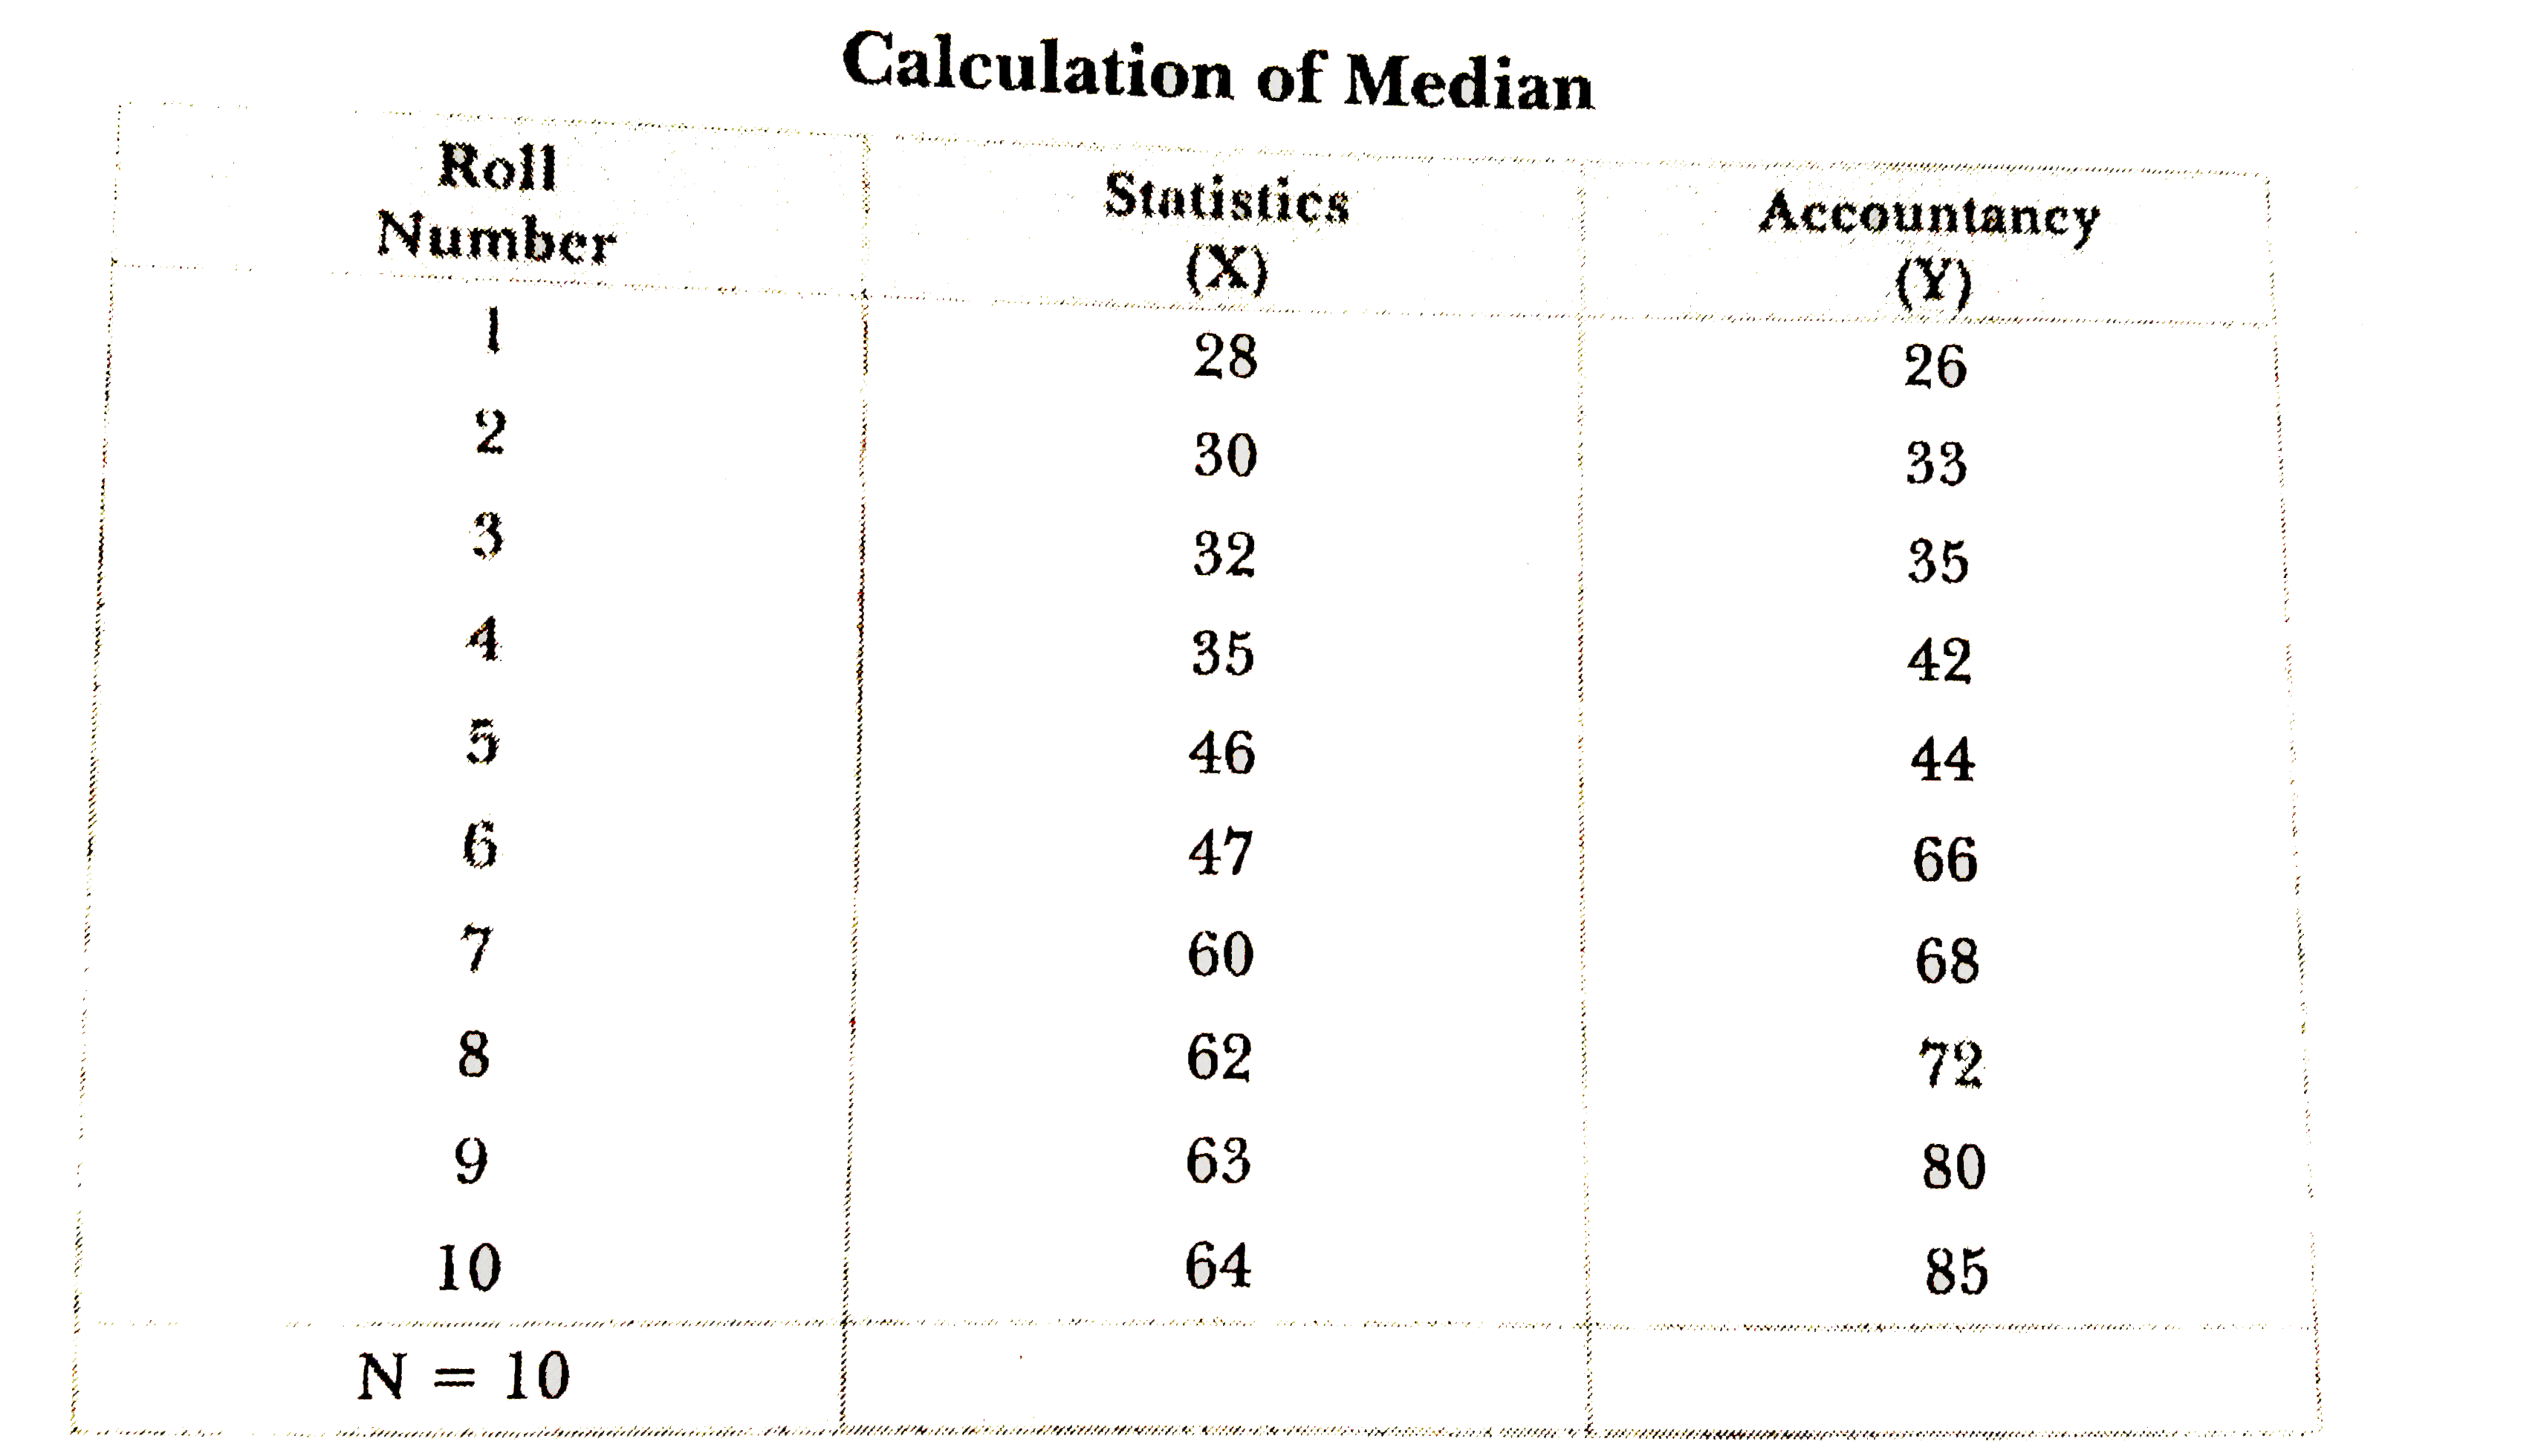
Following are the marks obtained by a batch of 10 students in a certain class test in Statistics (X) and Accountancy (Y) :
Roll Number12345678910Statistics (X)63646232306047463528Accountancy(Y)68663542268544803372
In which subject is level of Knowledge of students higher ?

Median = Size of (N+12) th item
(10+12) th item
= Size of (112) th item
Median(X)=Size of 5th item + Size of 6th item2
=46+472=932=46.5 marks
Median (Y) =Size of 5th item + Size of 6th item2
=44+662=1002=55 marks
Median marks of Accountany (Y) are more than that of Statistics (X). Therefore , level of knownledge of students is higher in Accountanycy.
Topper's Solved these Questions
- MEASURES OF CENTRAL TENDENCY MEDIAN AND MODEBOOK - TARUN JAIN & VK OHRICHAPTER - MEASURES OF CENTRAL TENDENCY MEDIAN AND MODEEXERCISE - Objective Type Questios
26 Videos
- MEASURES OF CENTRAL TENDENCY MEDIAN AND MODEBOOK - TARUN JAIN & VK OHRICHAPTER - MEASURES OF CENTRAL TENDENCY MEDIAN AND MODEEXERCISE - Concept - based Objective Questions
7 Videos
- MEASURES OF CENTRAL TENDENCY MEDIAN AND MODEBOOK - TARUN JAIN & VK OHRICHAPTER - MEASURES OF CENTRAL TENDENCY MEDIAN AND MODEEXERCISE - NCERT Questions (With Hints to Answers)
5 Videos
- MEASURES OF CENTRAL TENDENCY - ARITHMETIC MEANBOOK - TARUN JAIN & VK OHRICHAPTER - MEASURES OF CENTRAL TENDENCY - ARITHMETIC MEANEXERCISE - Illustration
72 Videos
- MEASURES OF DISPERSIONBOOK - TARUN JAIN & VK OHRICHAPTER - MEASURES OF DISPERSIONEXERCISE - Learning by doing
30 Videos
Similar Questions
Following table gives marks in Statistics of the students of a class.
Find out mean marks.
Mid-value510152025303540Number of Students579108632
View SolutionFollowing table gives marks in Statistics of the students of a class.
Find out mean marks.
Mid-value510152025303540Number of Students579108632
View Solution
Knowledge Check
Two numbers within the bracket denote the rank of 10 students of a class in two subjects : (1,10),(2,9),(3,8),(4,7),(5,6),(6,5),(7,4),(8,3),(9,2),(10,1). Then rank correlation coefficient is
A0B−1C1D0.5
Distribution of marks obtained by 100 student of a class is given below . Find out the median marks
Marks051015202530354045Number of Students46155812281435
View SolutionGiven below are the marks obtained by 30 students of a class, Using the class intervals of equal class size in which one class interval is 30-40 (excluding 40), construct a frequency table.
427439484280353852813172655877827965473064563948606372504635
View SolutionCalculate the median and mode of the number of persons per house in a village with the help of the following information : Number of Persons per House12345678910Number of House26133120956042211454
View SolutionFollowing is the distribution of marks in Statistics obtained by 32 students :
Mid - value51525354555Frequency4610732
Caculate the median marks.
View SolutionDraw a graph from the following data. Draw tangents at x=2,4,6and8 . Find the slopes of these tangents. Verify that the curve drawn is y=2x2 and the slope of tangent is tanθ=dydx=4x
,x12345678910y281832507298128162200
View SolutionThe following are the marks (out of 100) of 60 students in Mathematics.
16,13,5,80,7,51,48,24,56,70,19,17,16,36,34, 42,34,42,34,34,35,72,55,75,31,52,28,97,74,45,62,68,86, 35,85,36,81,75,55,26,95,31,7,78,92,62,52,56,15,63,25,36,54,44,47,27,72,17,4,30.
Construct a grouped frequency table with width 10 of each class starting from 0-9.
View SolutionConstruct a frequency table with class-intervals 0-5 (5 not included) of the following marks obtained by a group of 30 students in an examination: 0,5,7,10,12,15,20,22,25,27,8,11,17,3,6,9,17,19,21, 29,31,35,37,40,42,45,49,4,50,16.
View Solution