Compute median from the following data :
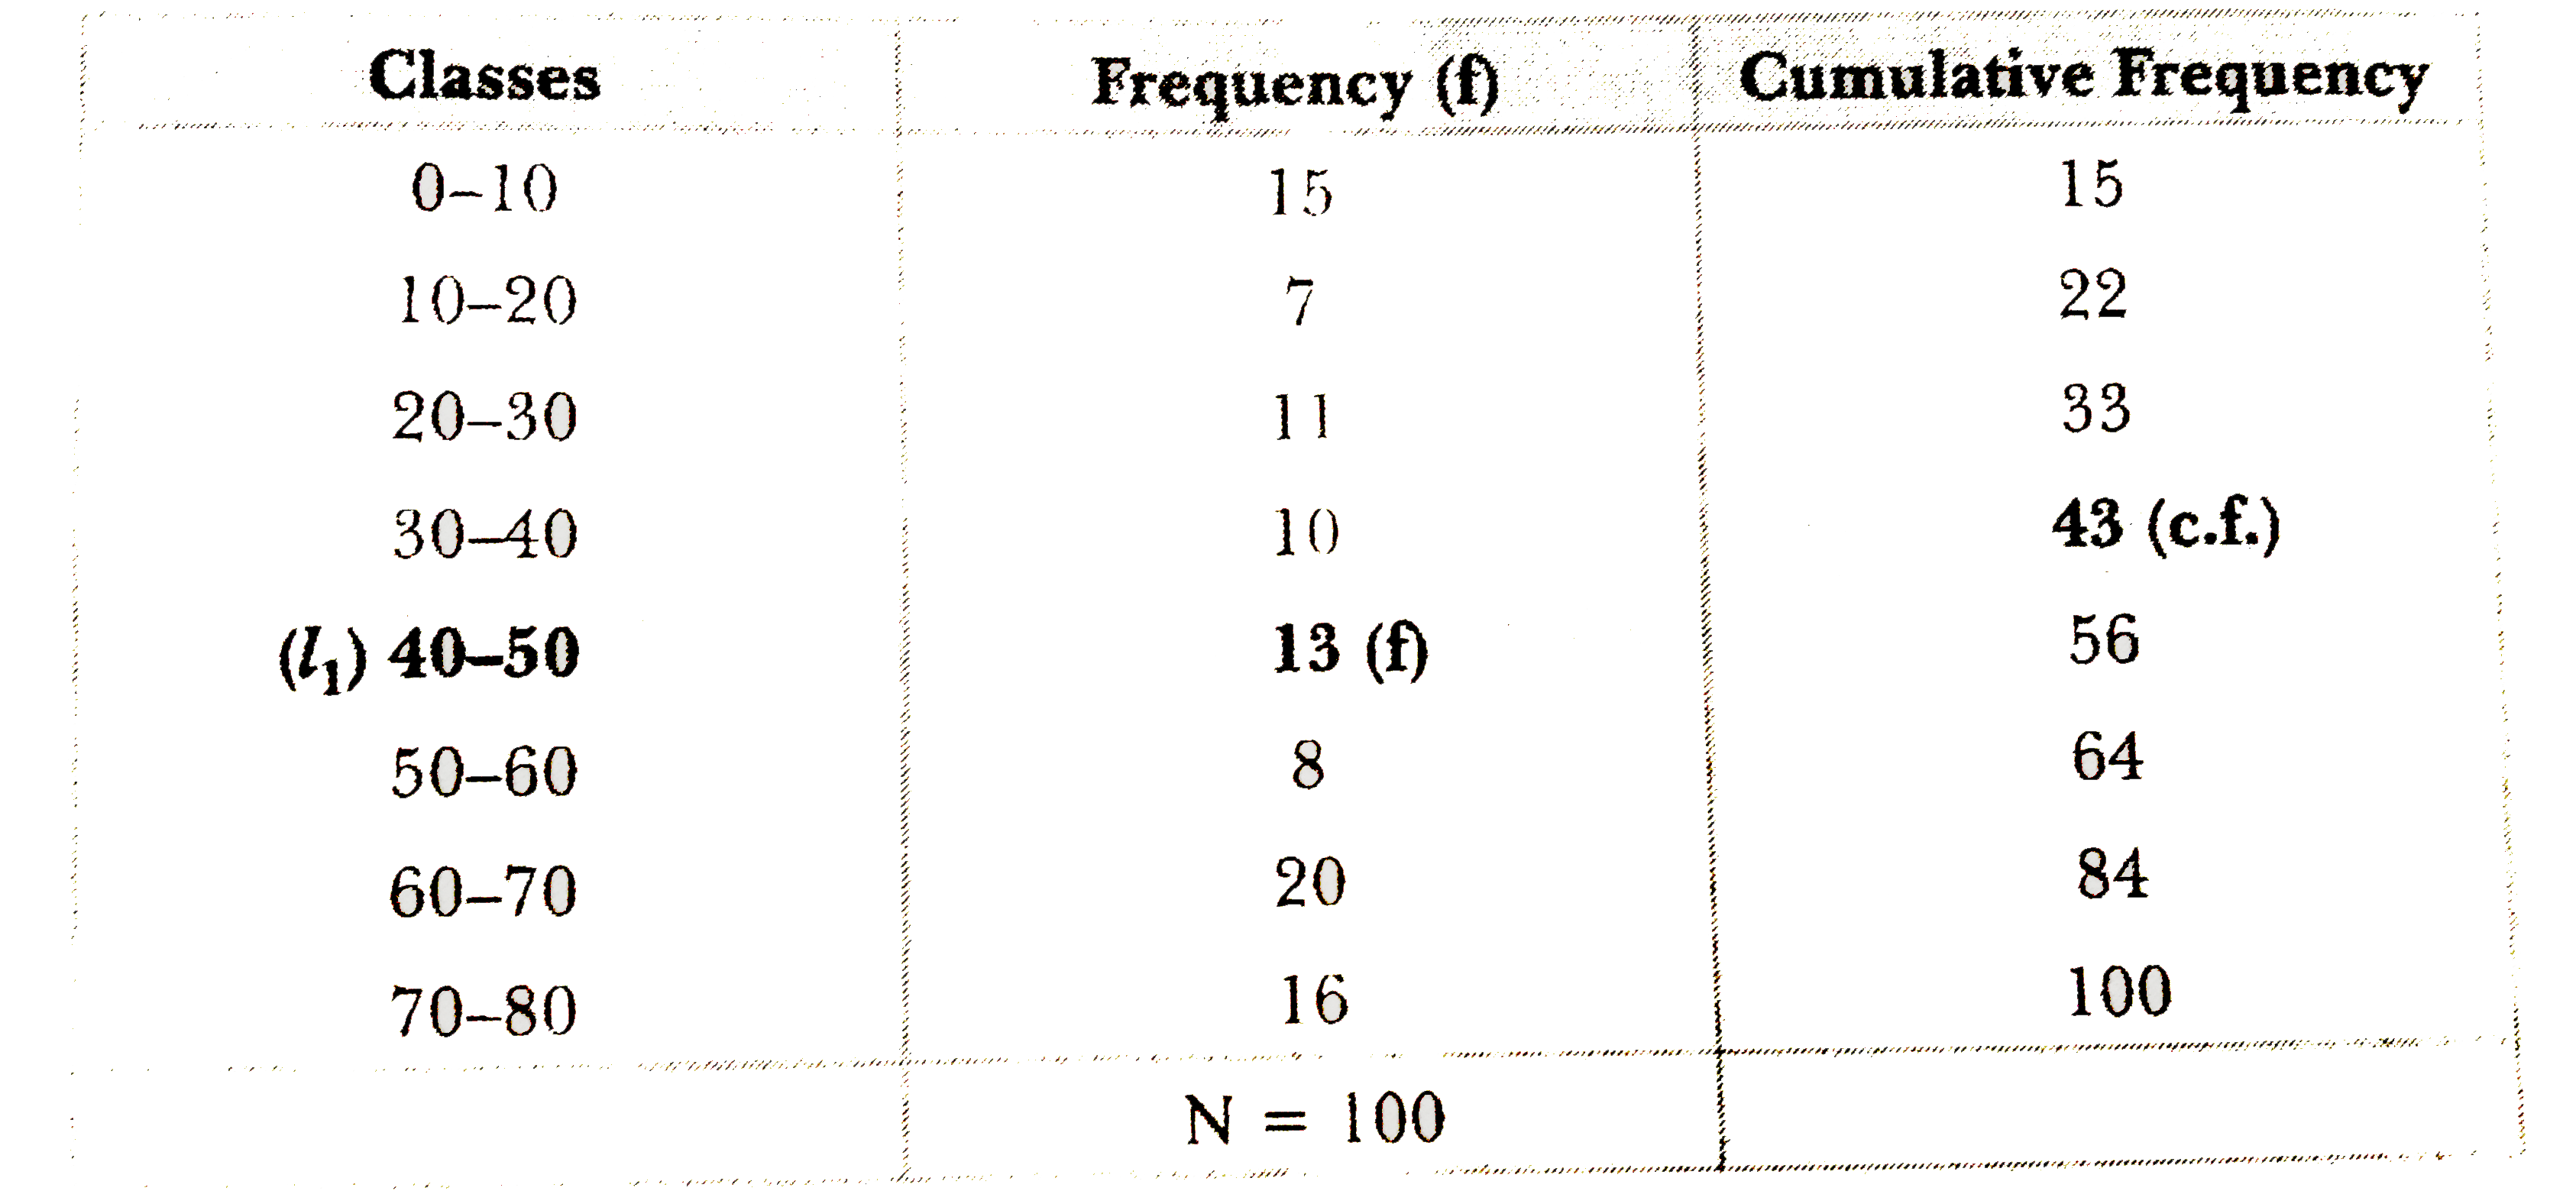
Mid - value515253545556575Frequency15711101382016
Since , we are given the mid- value , we should first find out the upper and lower limits of the various classes . As the mid - values are 5,15,25,35,45,55,65,75, so , class size is 10(=15-5) . For determining limits of different classes , applying the formula :
Lower Limit : l1=m−12×iand
Upper limit : l2=m−12×i
where , i = difference between two mid - values. In this case , the upper and the lower limtis of the first mid - value are : l1=5−12×10=0andl1=5+12×10=10
i.e., 0-10 class intervals for other values are obtained as :

m= Size of (N2)th item
= Size of (1002) th item = Size of 50th item
Hence ,median lies in the class 40-50.
M=l1+N2−c.f.f×i
=40+1002−4313×10=40+50−4313×10
=40+713×10=40+5.38=45.38
Median = 45.38.
Topper's Solved these Questions
- MEASURES OF CENTRAL TENDENCY MEDIAN AND MODEBook:TARUN JAIN & VK OHRIChapter:MEASURES OF CENTRAL TENDENCY MEDIAN AND MODEExercise:Objective Type Questios
Explore 26 Videos
- MEASURES OF CENTRAL TENDENCY MEDIAN AND MODEBook:TARUN JAIN & VK OHRIChapter:MEASURES OF CENTRAL TENDENCY MEDIAN AND MODEExercise:Concept - based Objective Questions
Explore 7 Videos
- MEASURES OF CENTRAL TENDENCY MEDIAN AND MODEBook:TARUN JAIN & VK OHRIChapter:MEASURES OF CENTRAL TENDENCY MEDIAN AND MODEExercise:NCERT Questions (With Hints to Answers)
Explore 5 Videos
- MEASURES OF CENTRAL TENDENCY - ARITHMETIC MEANBook:TARUN JAIN & VK OHRIChapter:MEASURES OF CENTRAL TENDENCY - ARITHMETIC MEANExercise:Illustration
Explore 72 Videos
- MEASURES OF DISPERSIONBook:TARUN JAIN & VK OHRIChapter:MEASURES OF DISPERSIONExercise:Learning by doing
Explore 30 Videos
Similar Questions
Knowledge Check
The median from the following distribution is
Class:5−1010−1515−2020−2525−3030−3535−4040−45Frequency:5615105422A19B19.5C20D18The mode of the following distribution is
Class interval :1−56−1011−1516−2021−25Frequency :471086A14.5B16.5C10.5D13.5The median for the following frequency distribution is :
xi :123456789fi :810111620251596A6B5C7D4
Following is the distribution of marks in Statistics obtained by 32 students :
Mid - value51525354555Frequency4610732
Caculate the median marks.
View SolutionCalculate the median from the following data - set :
Size10−1515−17.517.5−2020−3030−3535−4040−50Frequency 10 15 17 25 28 30 40
View SolutionCalculate arithmetic mean from the following data by Short-cut Method:
Class Interval20−2525−3030−3535−4040−4545−5050−55Frequency 10 12 8 20 11 4 5
View SolutionCalculate arithmetic mean from the following data by Short-cut Method:
Class Interval20−2525−3030−3535−4040−4545−5050−55Frequency 10 12 8 20 11 4 5
View SolutionThe mean of the following data is 20.6. Find the value of 10 15 p 25 35 3 10 25 7 5
View Solution
