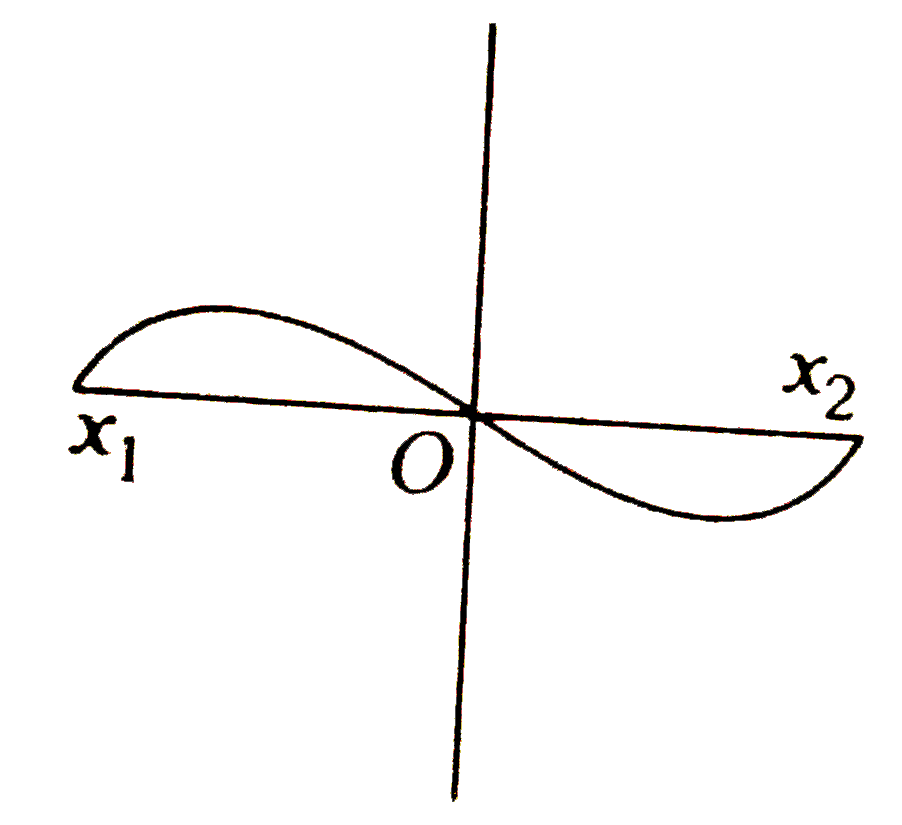
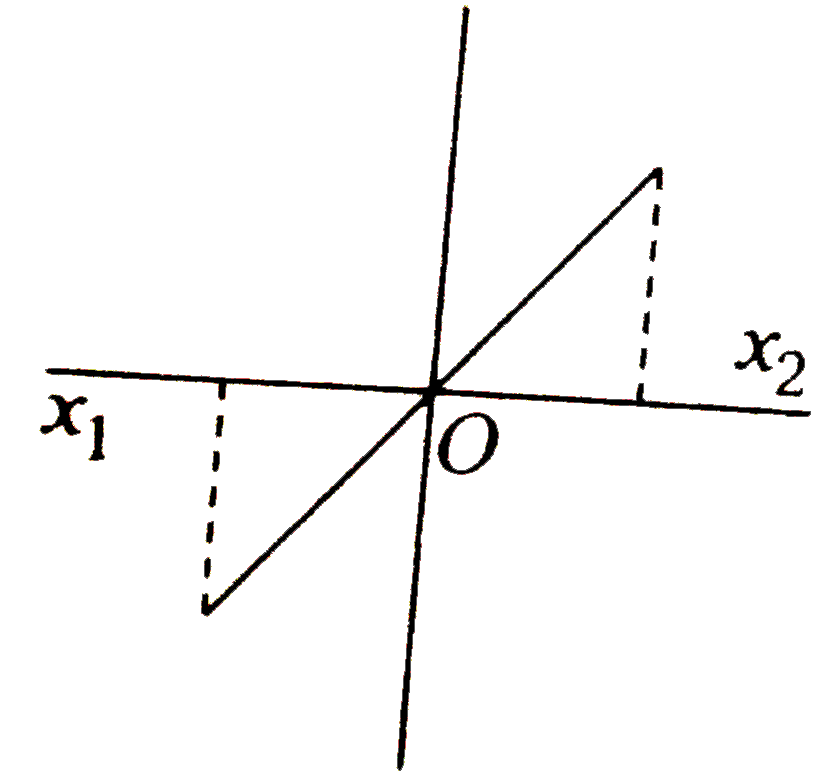
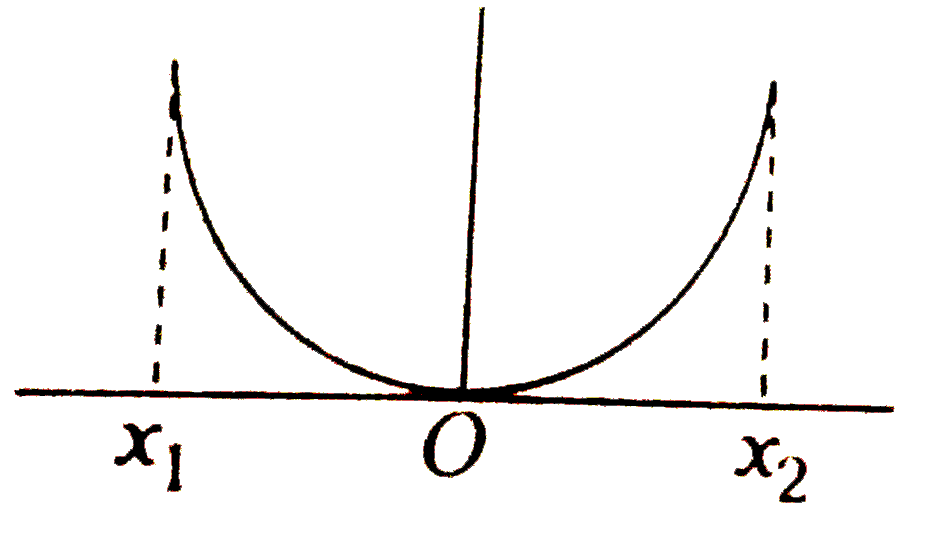
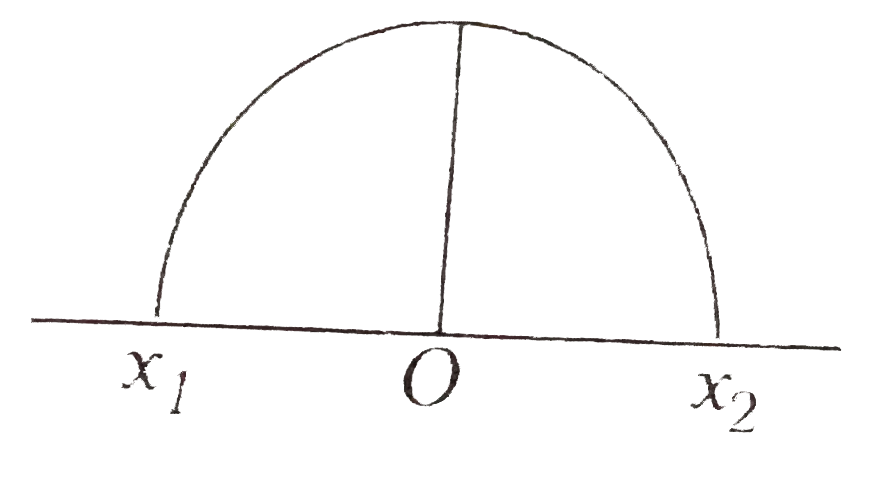
A particle of mass m oscillates with simple harmonic motion between points x1 and x2, the equilibrium position being O. Its potential energy is plotted. It will be as given below in the graph
The correct Answer is:C
(c) Potential energy graph is parabolic with its minimum value at mean position.
Similar Questions
The potential energy of a particle, executing a simple harmonic motion, at a dis"tan"ce x from the equilibrium position is proportional to
View SolutionA particle executes simple harmonic motion of ampliltude A. At what distance from the mean position is its kinetic energy equal to its potential energy?
View Solution
Knowledge Check
A particle of mass m oscillates with simple harmonic motion between points x1 and x2 the equilibrium position being O its potential energy in plotted it will be as given bellow in the graph
A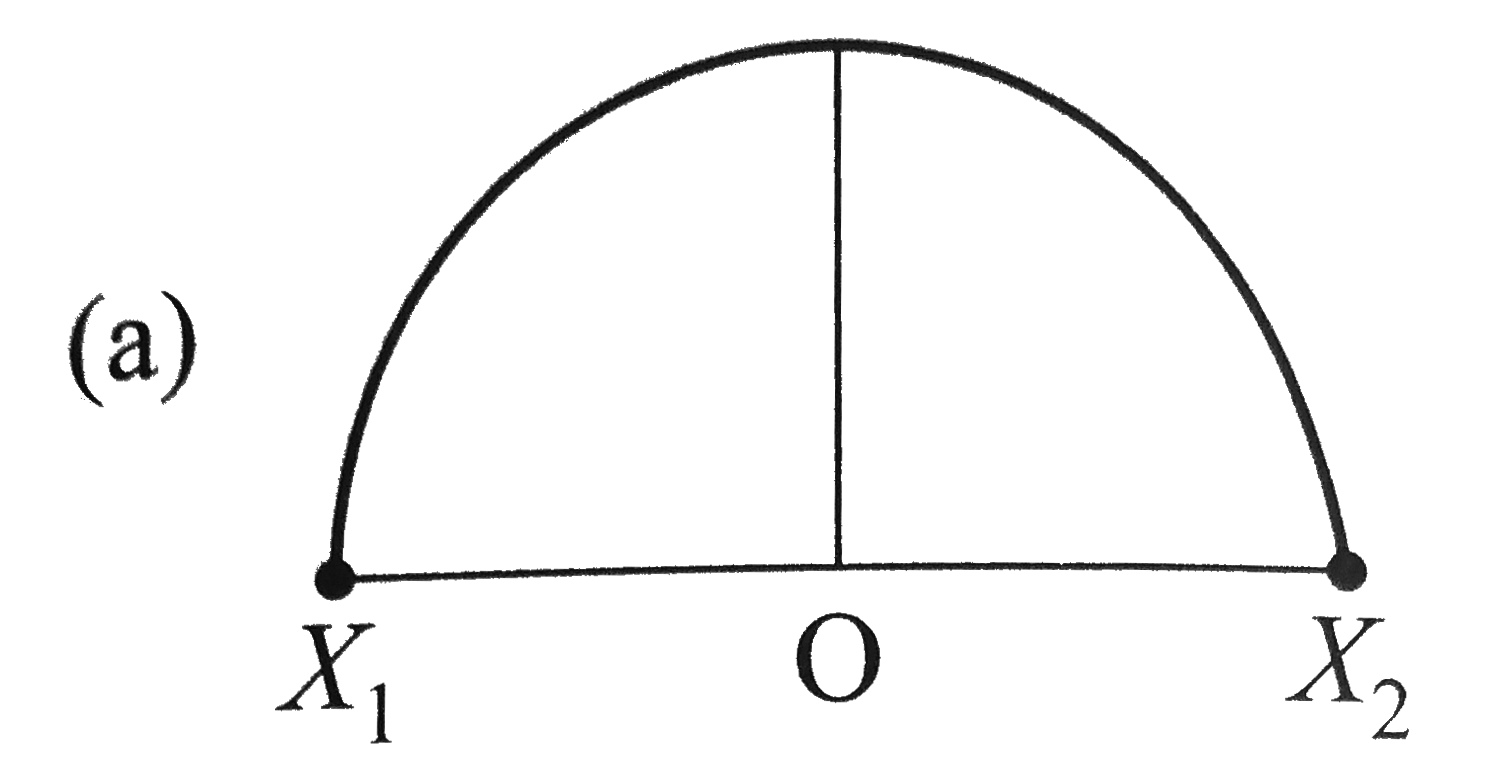 B
B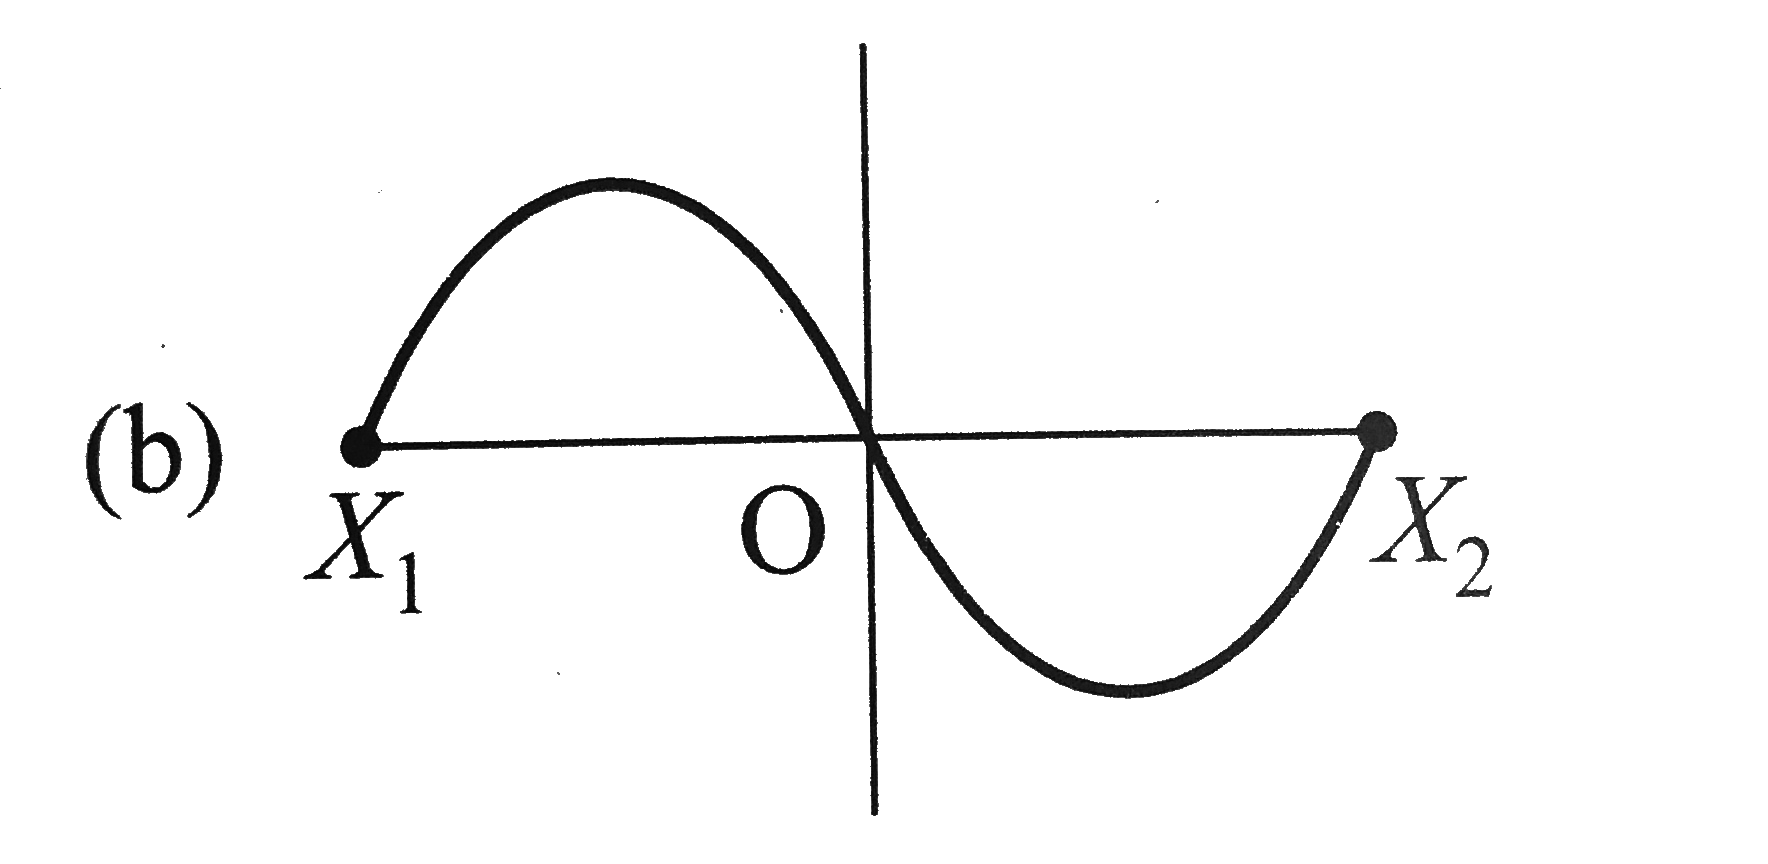 C
C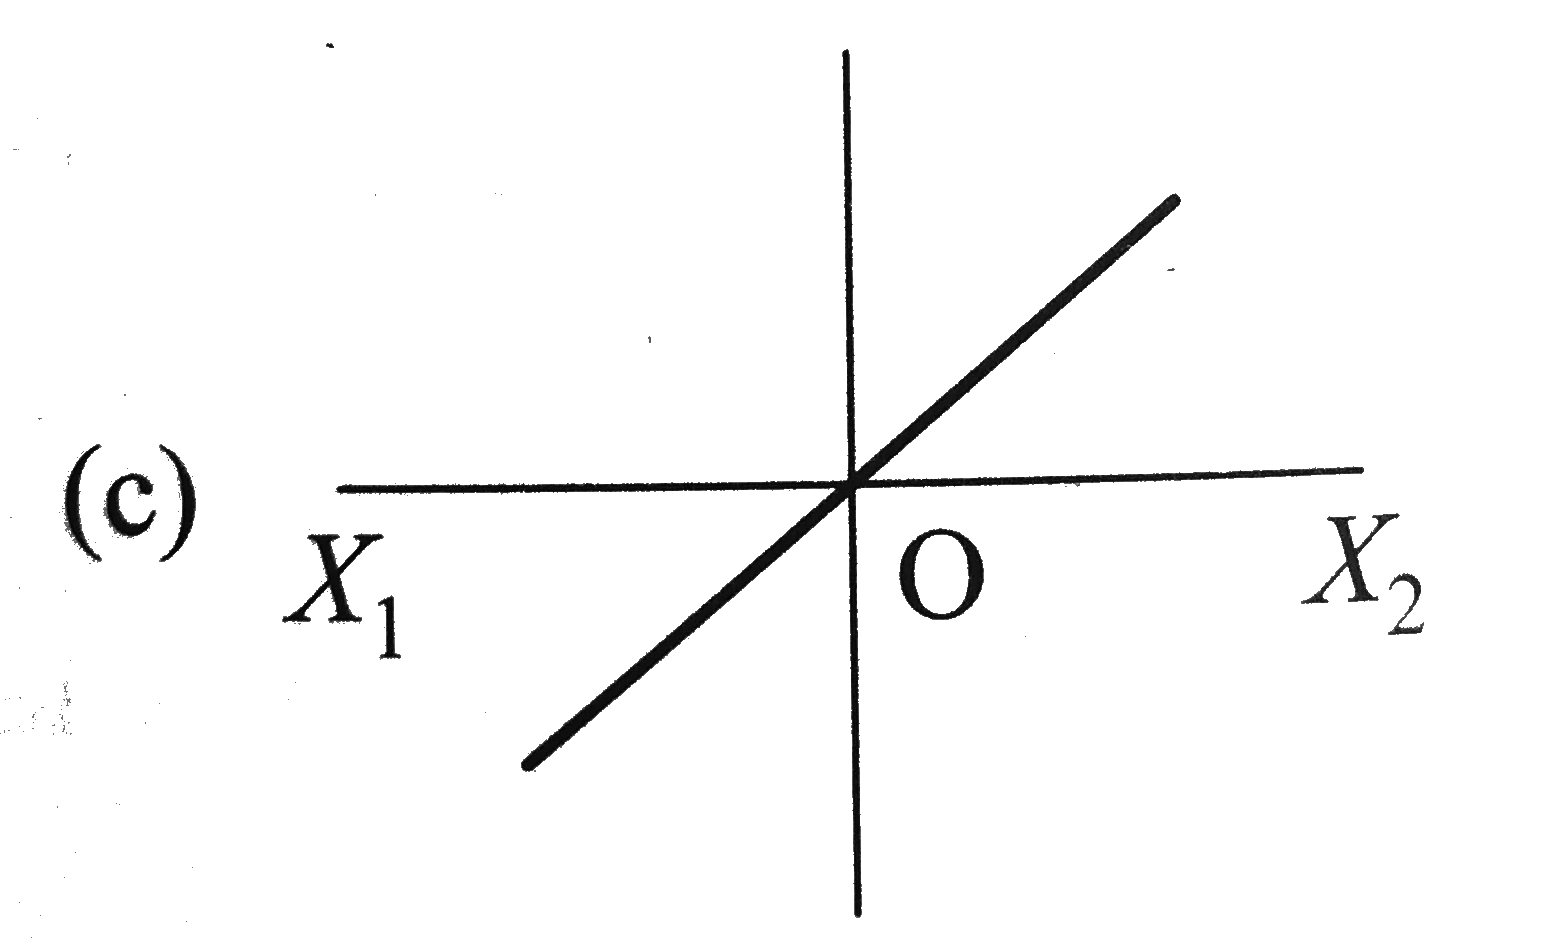 D
D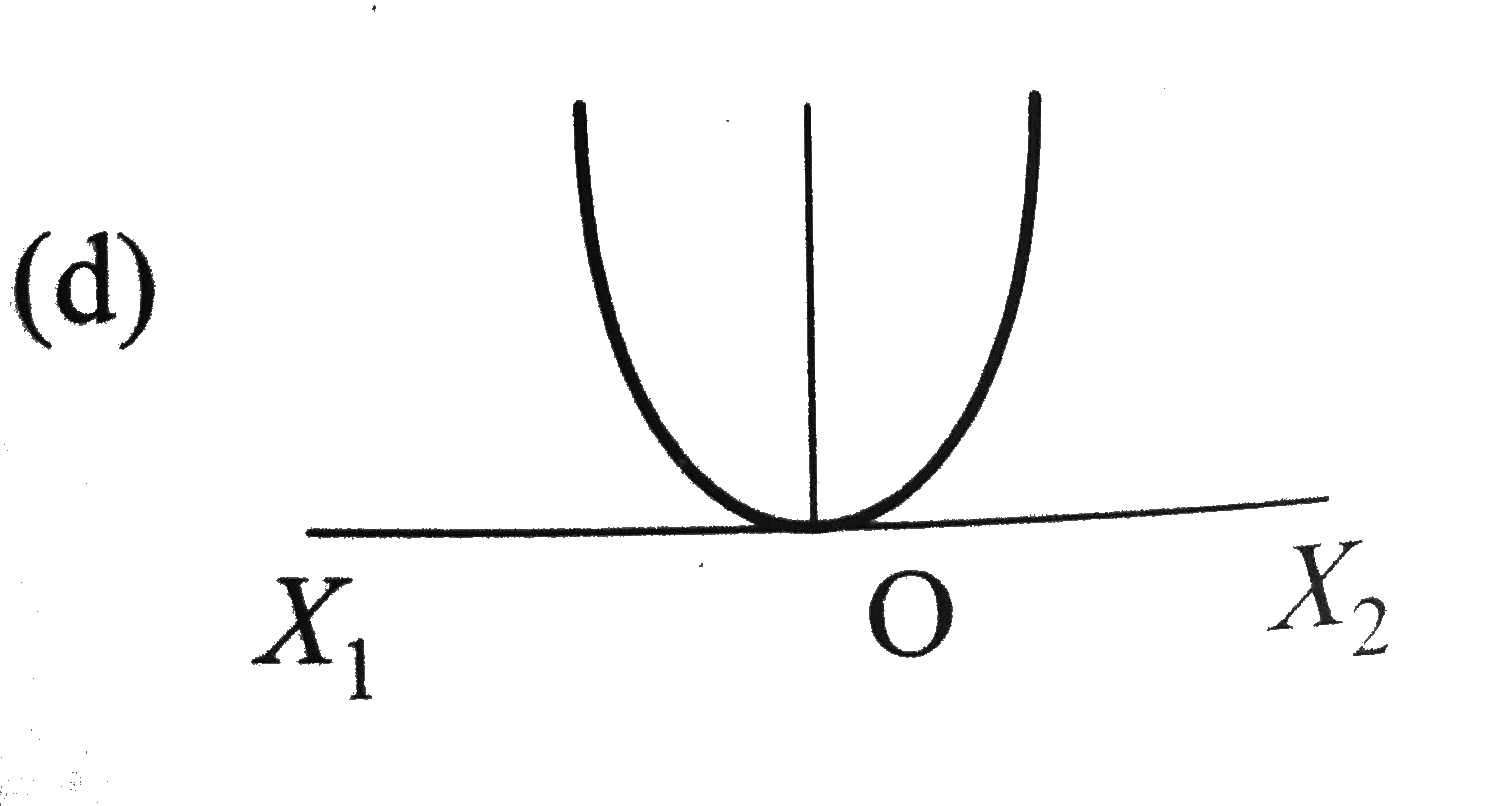
A particle of mass m oscillates with simple harmonic motion between two points x1 and x2 the equilibrium position being O its potential energy is plotted on the graph which of the following curve represents the phenomenon?
A B
B C
C D
D
A particle of mass m oscillates with simple harmonic motion between two points x1 and x2 the equilibrium position being O its potential energy is plotted on the graph which of the following curve represents the phenomenon?
A B
B C
C D
D
A particle oscillates simple harmonic motion with a period of 16s. Two second after crossing the equilibrium position its velocity becomes 1m/s. The amplitude is
View SolutionA particle is executing simple harmonic motion between exterme positions given by (−1,−2,−3)cm and (1,2,1)cm. Its amplitude of oscillation is
View SolutionA particle is vibrating in a simple harmonic motion with an amplitude of 4 cm . At what displacement from the equilibrium position, is its energy half potential and half kinetic
View SolutionA particle starts oscillating simple harmonically from its equilibrium position then, the ration of kinetic energy and potential energy of the particle at the time T/12 is: (T=time period)
View SolutionWhen the displacement of a particle executing simple harmonic motion is half its amplitude, the ratio of its kinetic energy to potential energy is
View Solution
