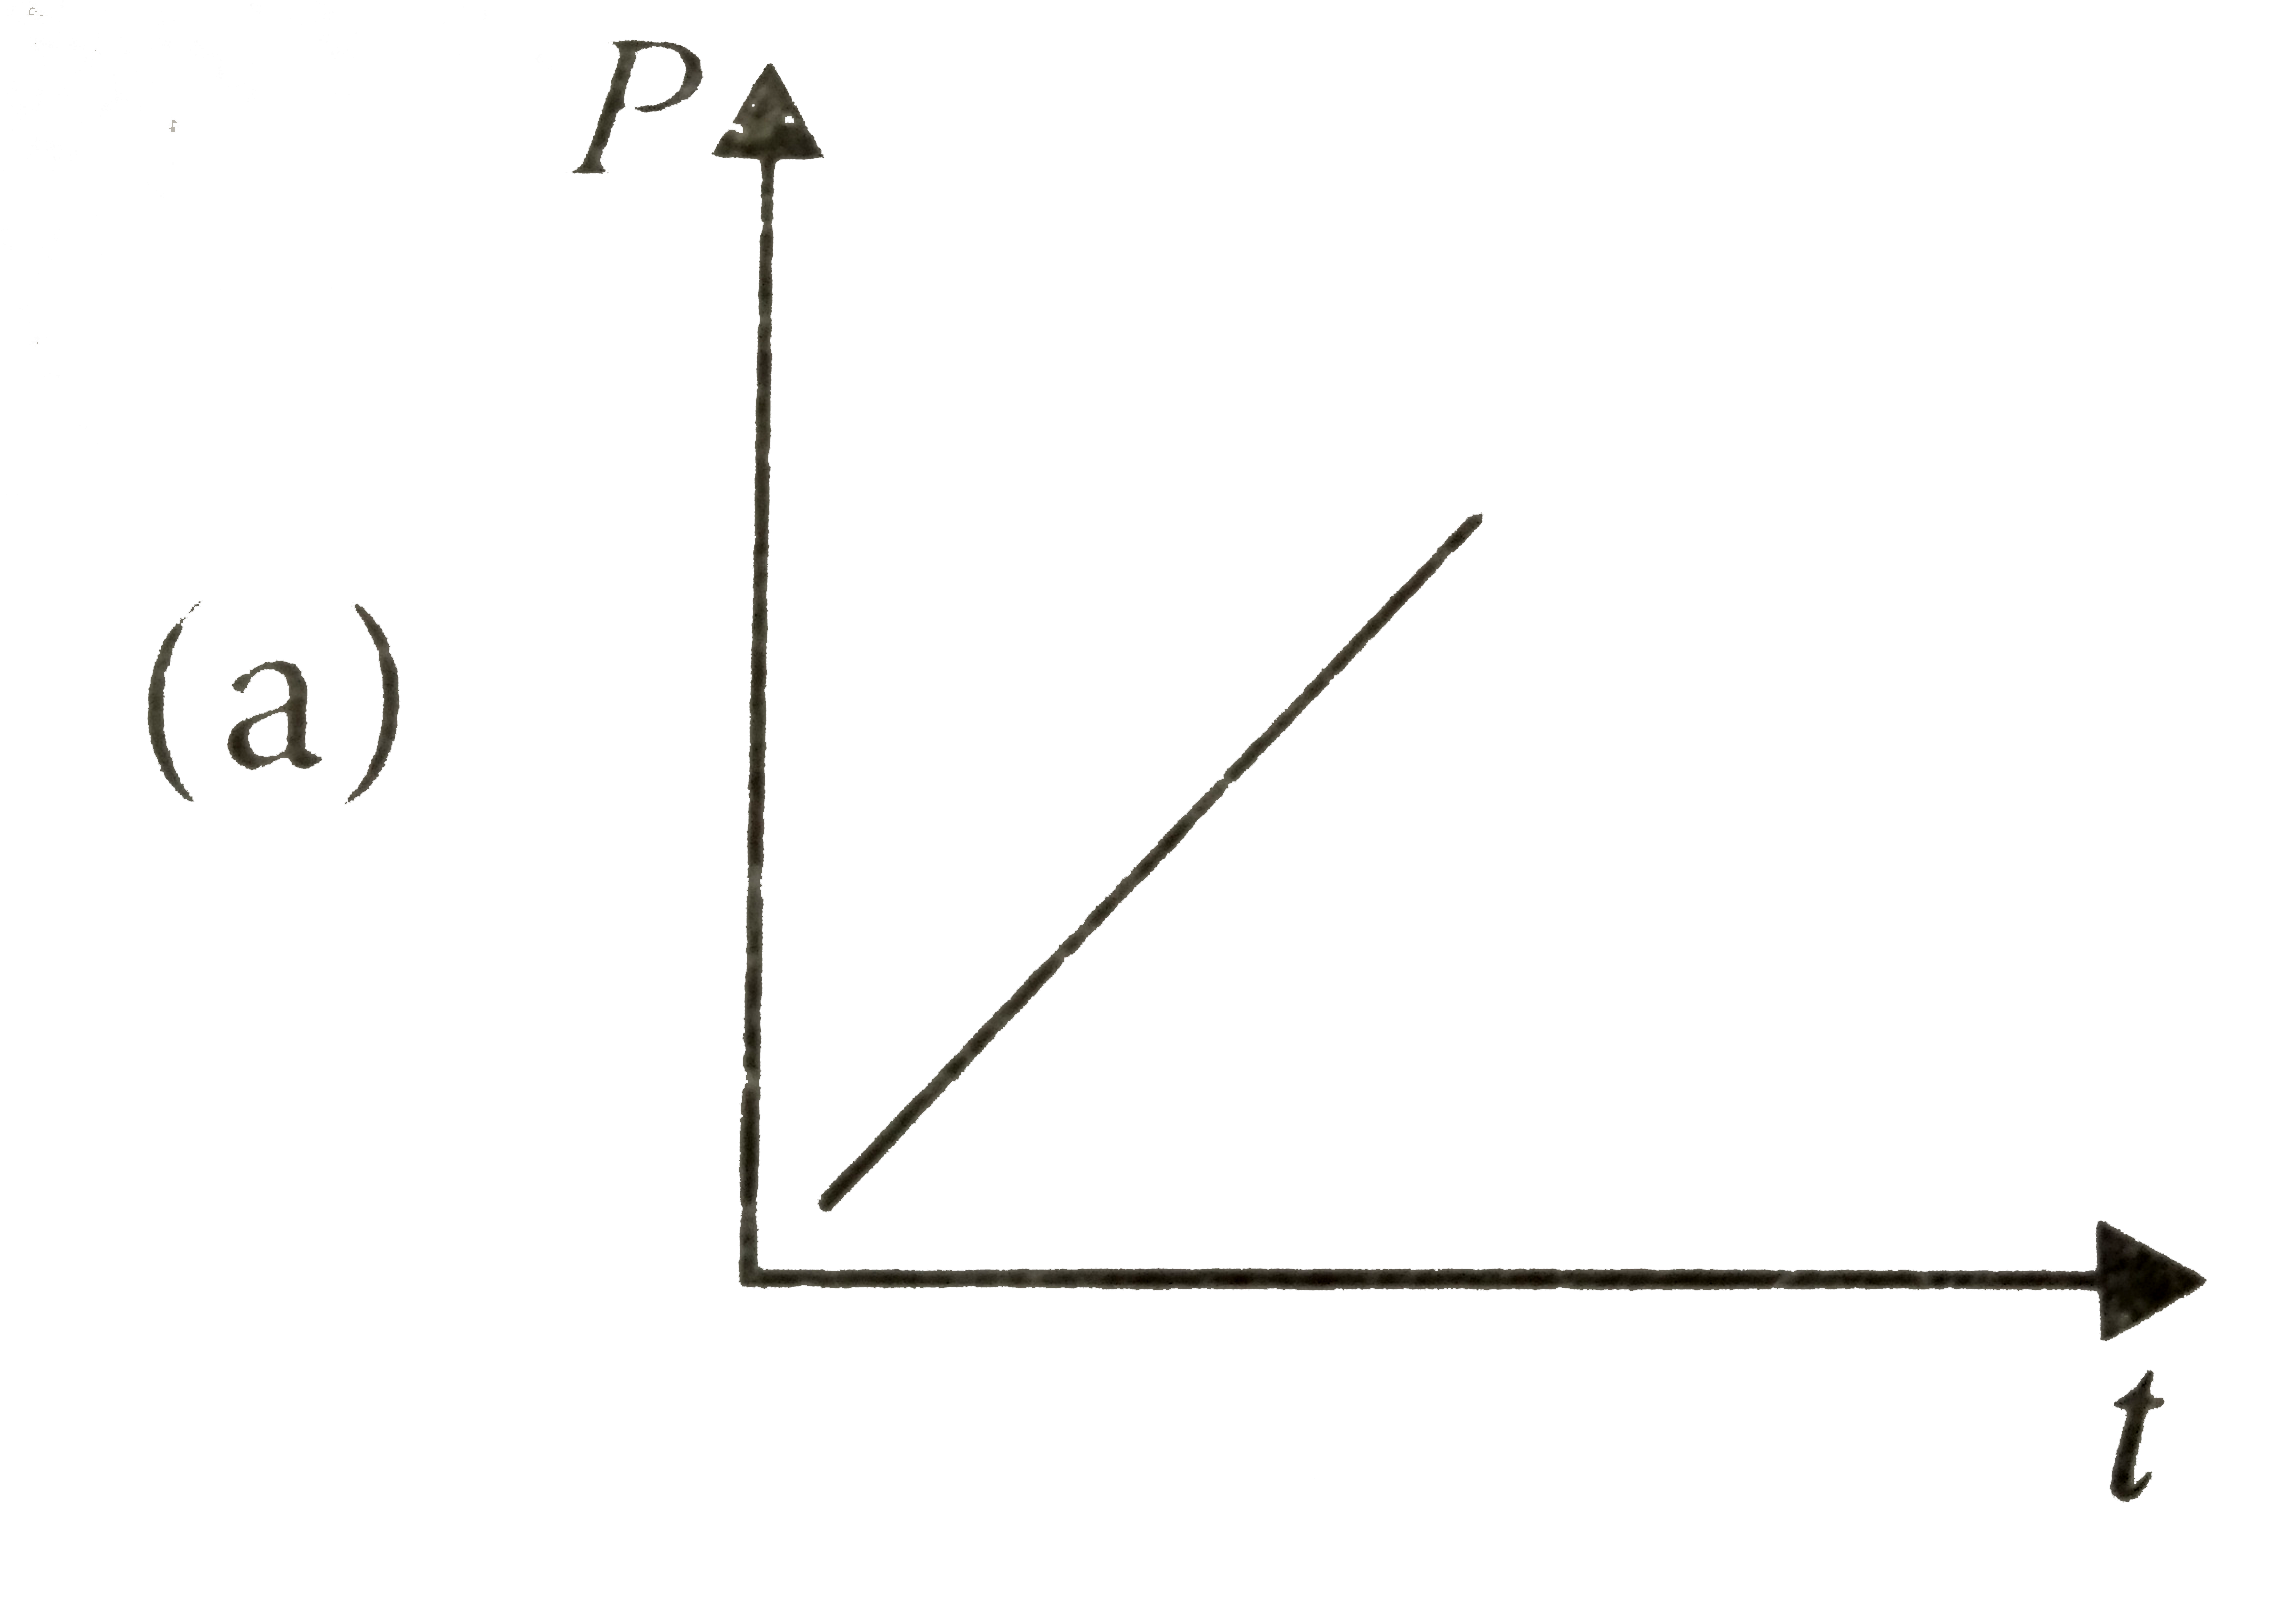
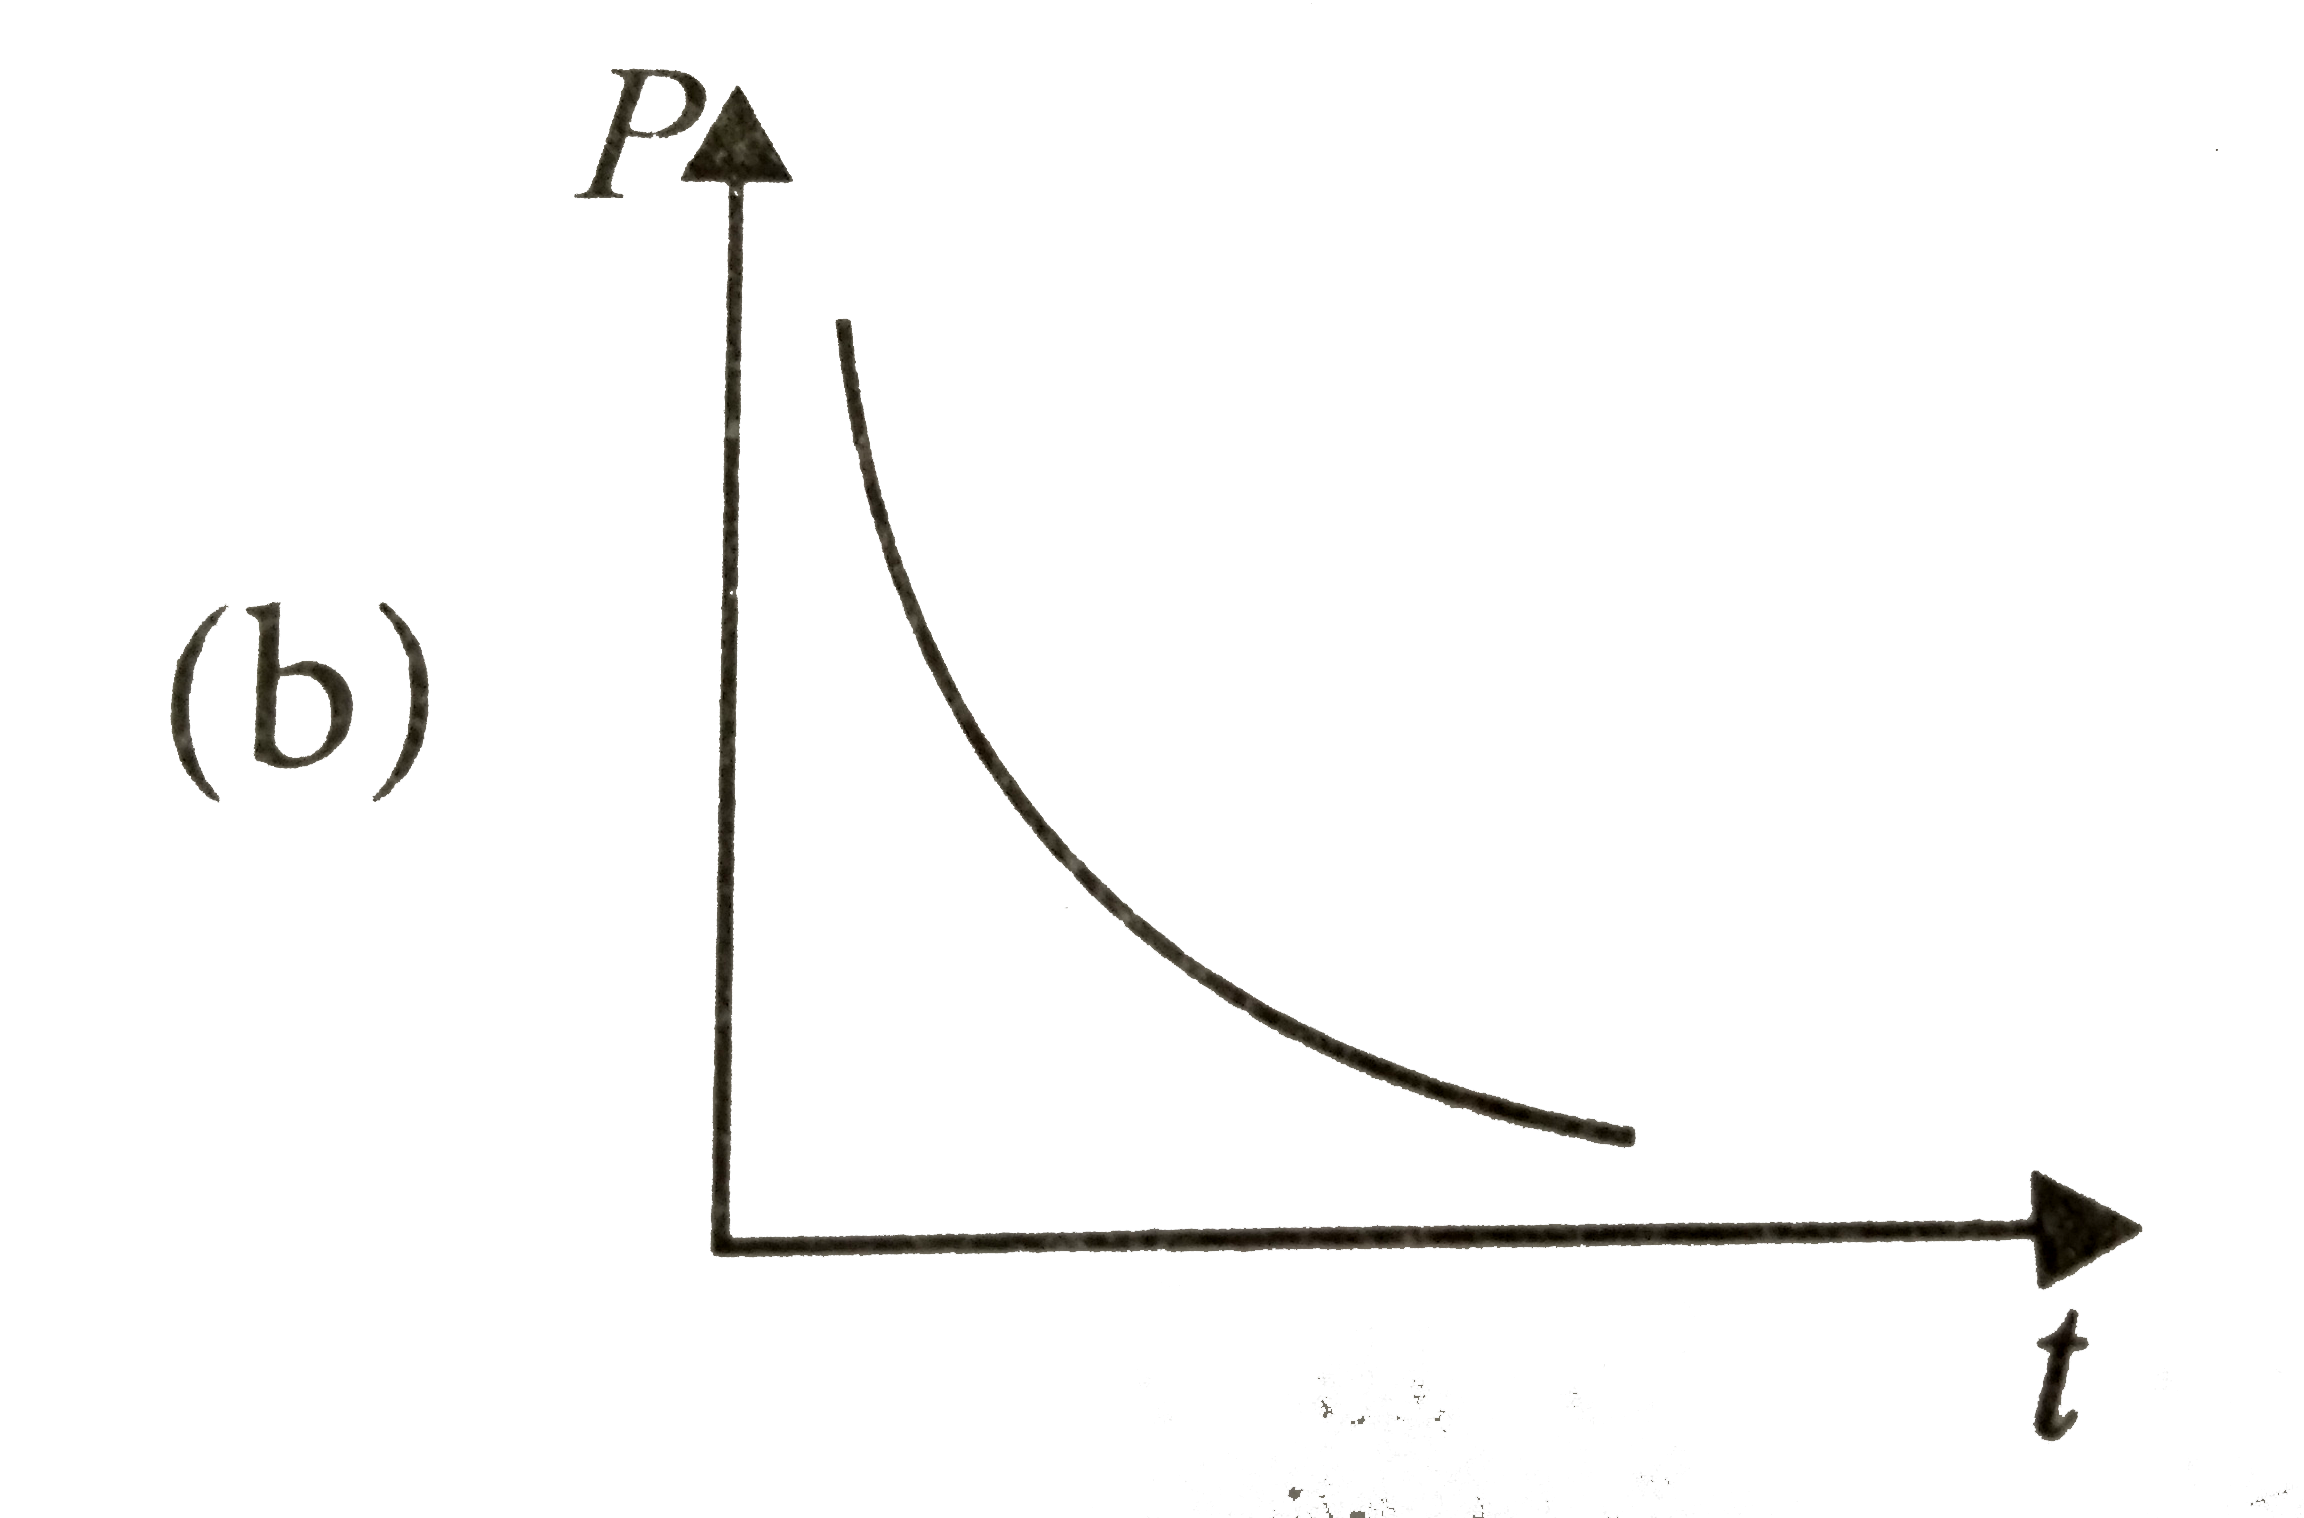
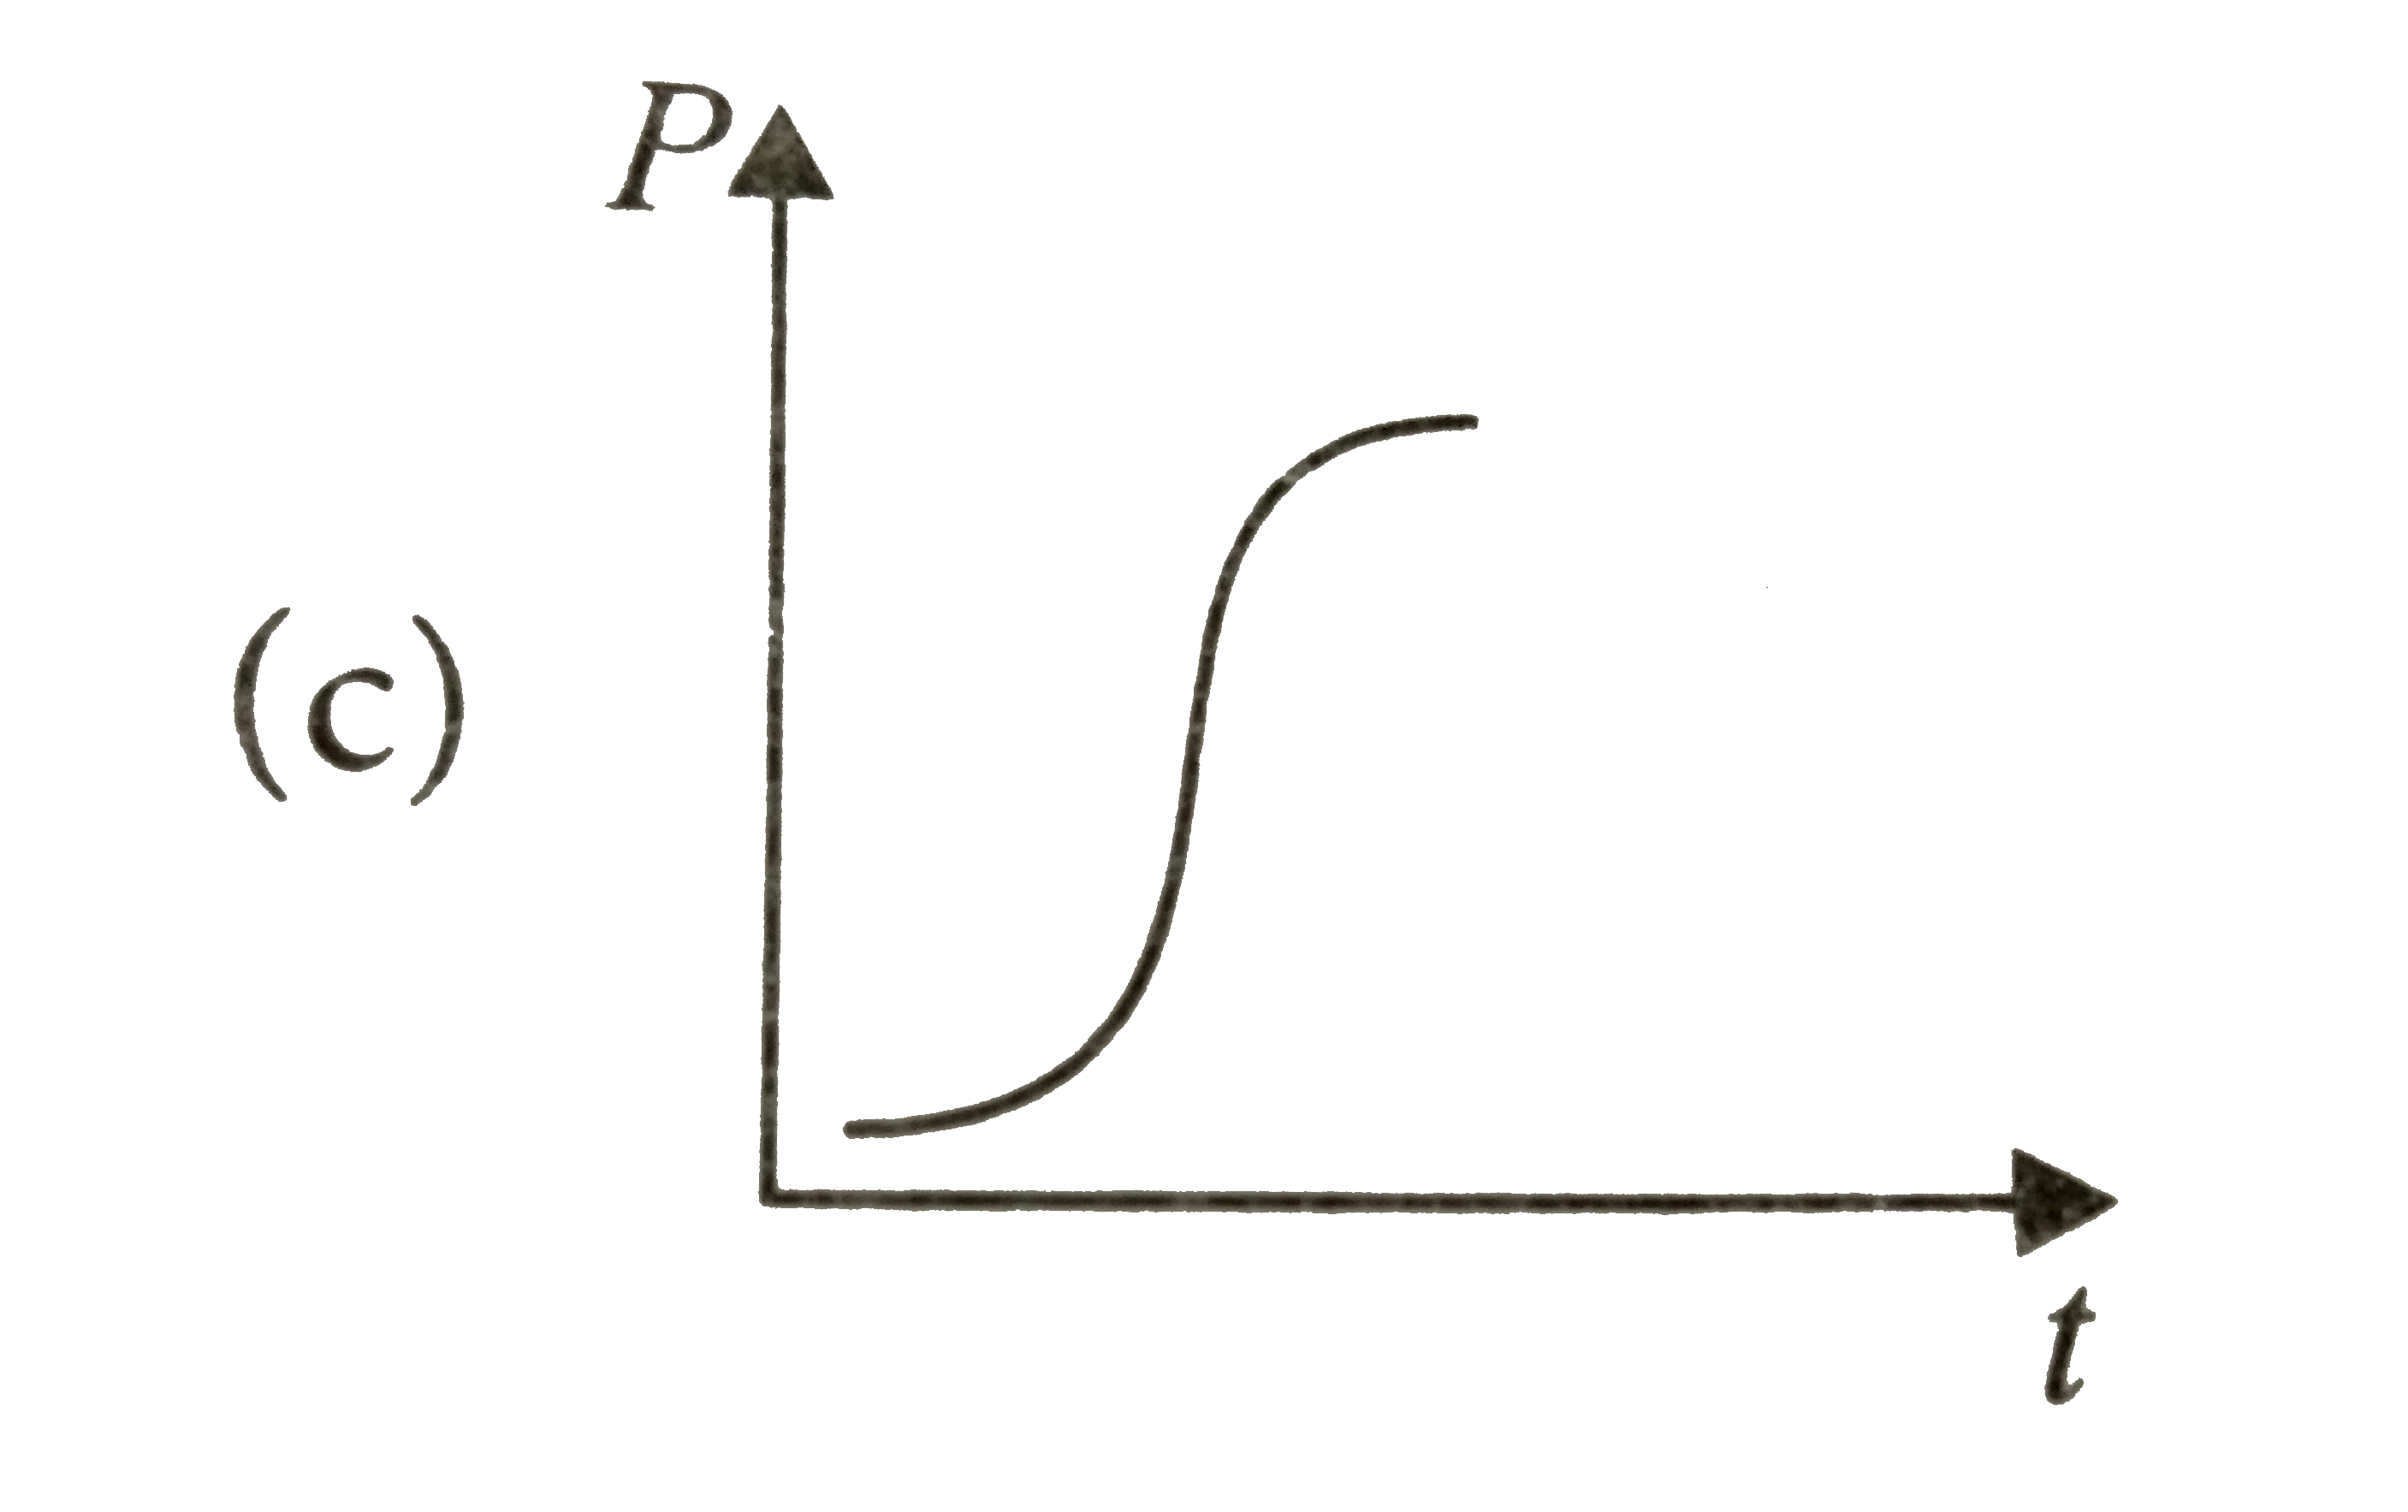
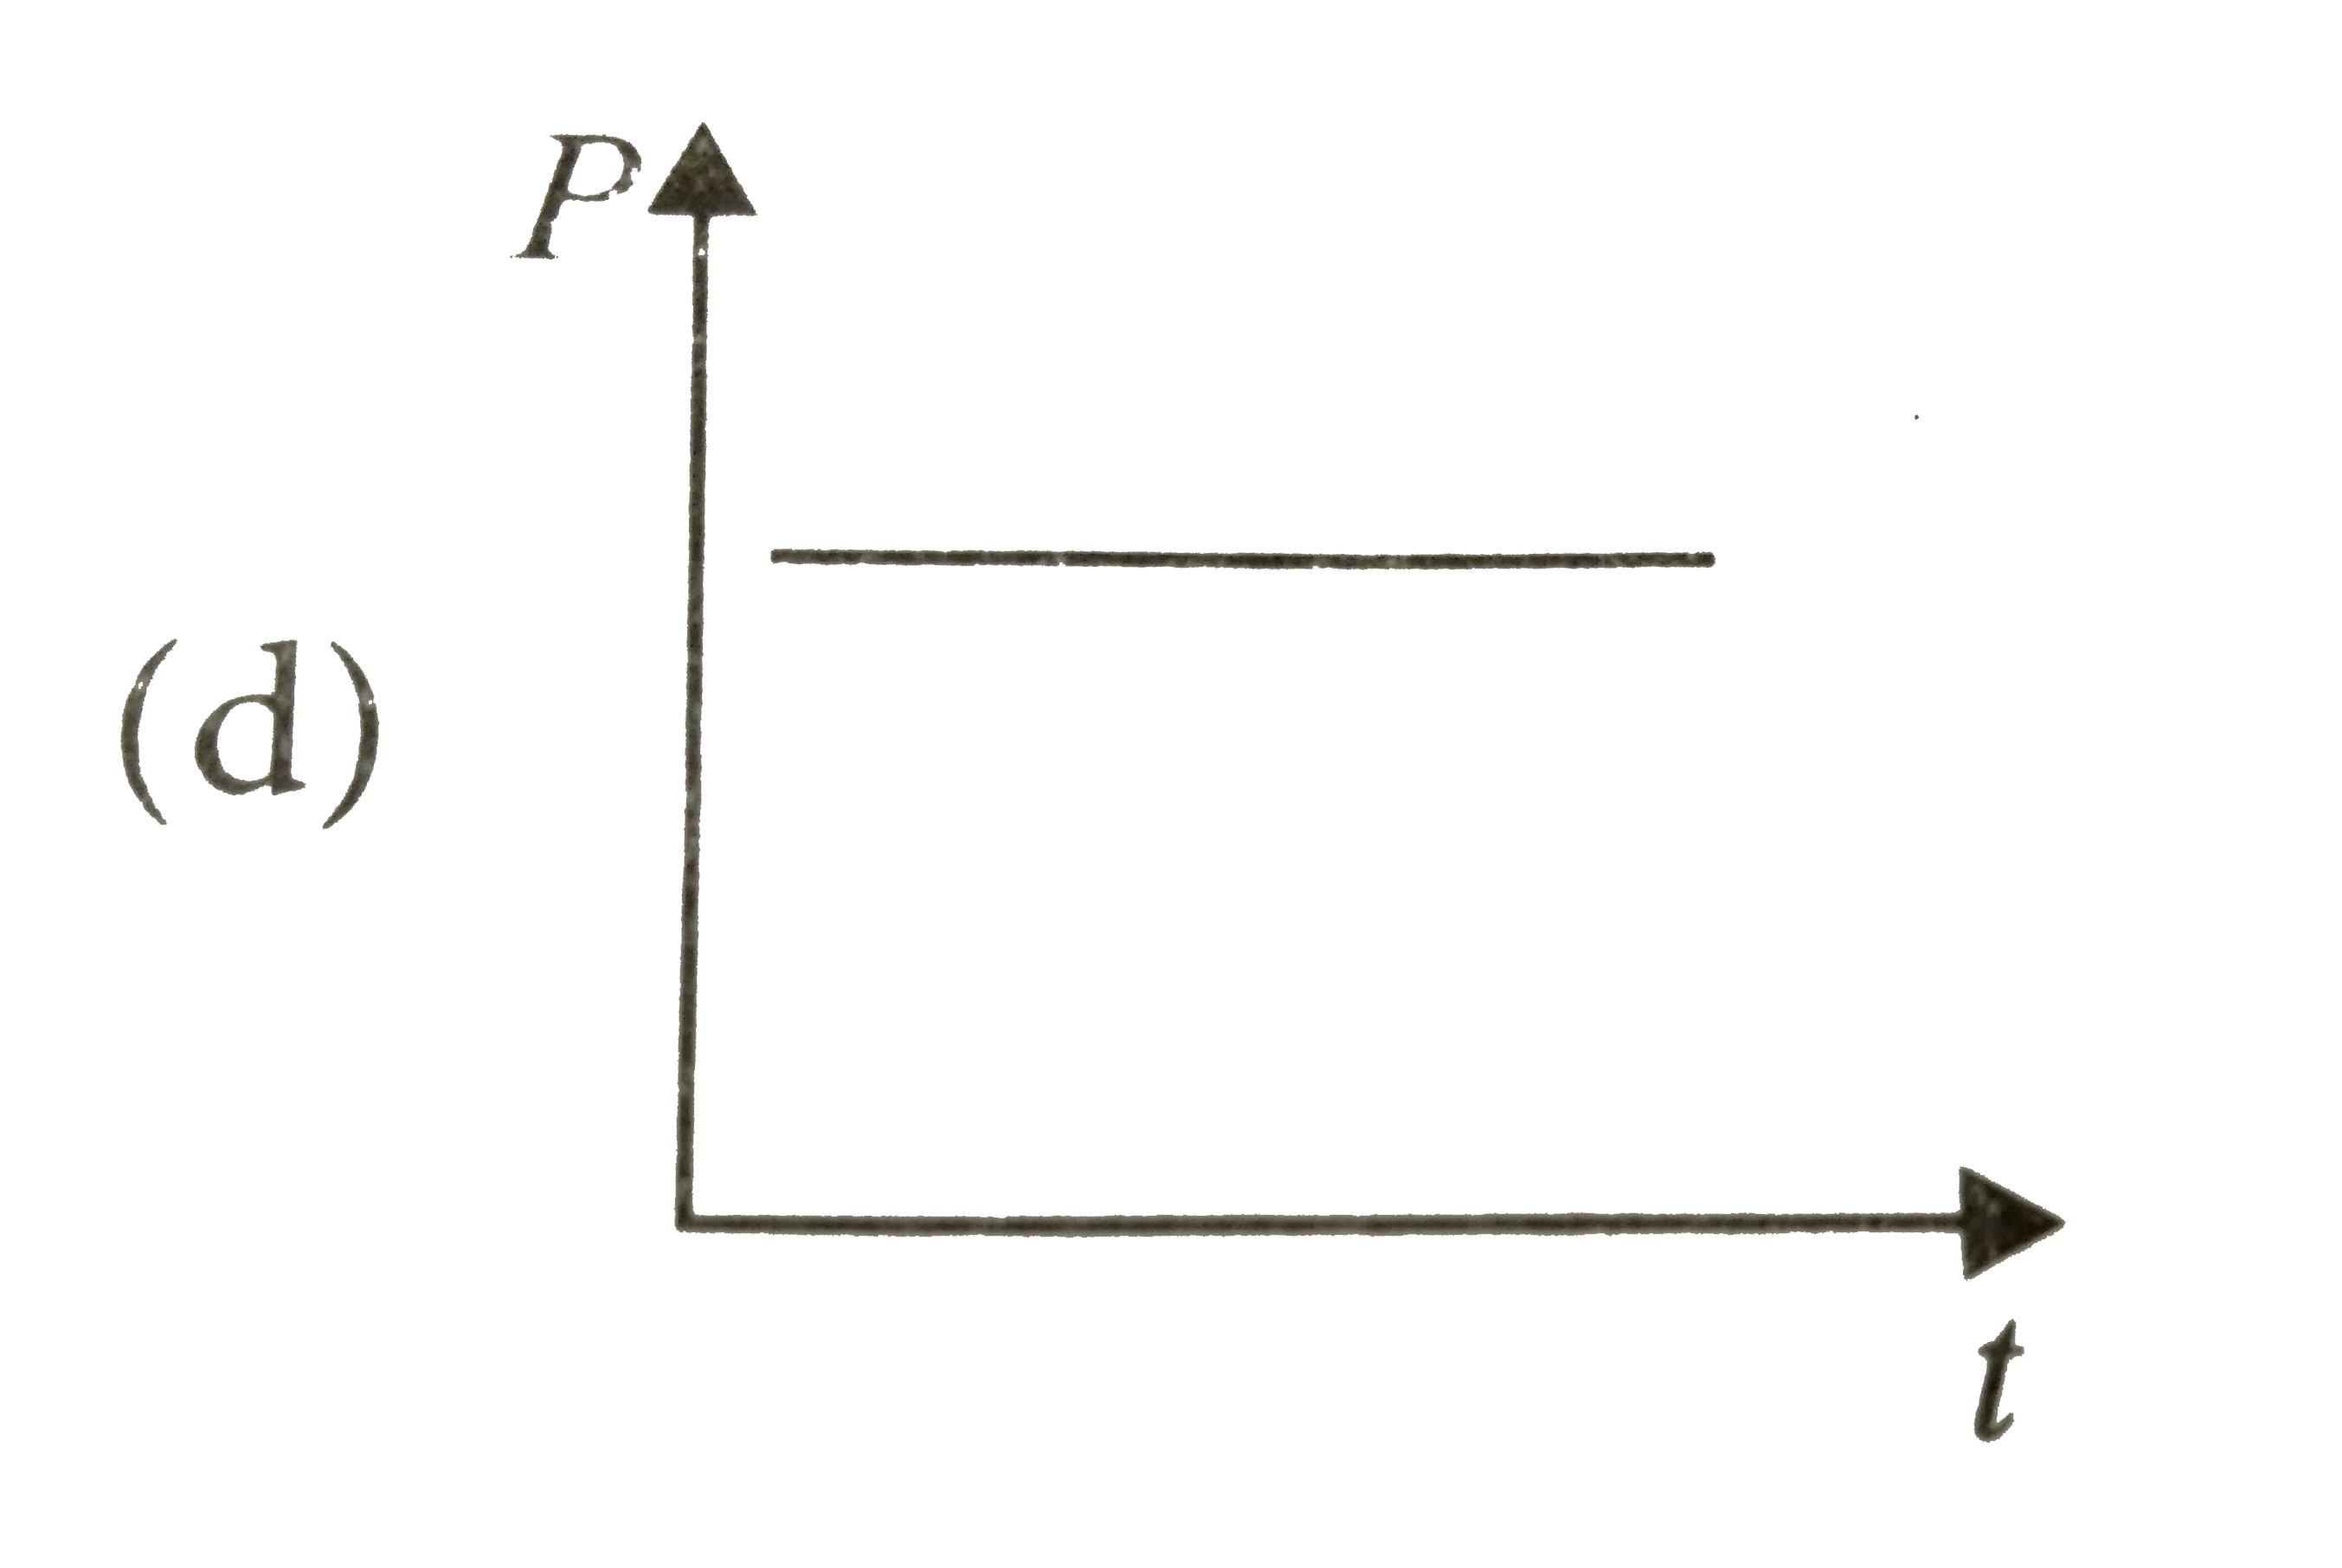
The soap bubble formed at the end of the tube is blown very slowly. Draw the graph between excess of pressure inside the bubble with time.
A

B

C

D

Video Solution
Text Solution
The correct Answer is:B
As excess pressure inside the soap bubble of radius r, is
or
Therefore as r increases with time, P decreases
So the variation of P with time t will be a parabolic curve as shown is option (b)
|
Topper's Solved these Questions
- MECHANICAL PROPERTIES OF FLUIDSBook:NCERT FINGERTIPSChapter:MECHANICAL PROPERTIES OF FLUIDSExercise:Higher Order Thinking Skills
Explore 8 Videos
- MECHANICAL PROPERTIES OF FLUIDSBook:NCERT FINGERTIPSChapter:MECHANICAL PROPERTIES OF FLUIDSExercise:NCERT Exemplar
Explore 5 Videos
- MECHANICAL PROPERTIES OF FLUIDSBook:NCERT FINGERTIPSChapter:MECHANICAL PROPERTIES OF FLUIDSExercise:Reynolds Number
Explore 4 Videos
- LAWS OF MOTIONBook:NCERT FINGERTIPSChapter:LAWS OF MOTIONExercise:Assertion And Reason
Explore 15 Videos
- MECHANICAL PROPERTIES OF SOLIDSBook:NCERT FINGERTIPSChapter:MECHANICAL PROPERTIES OF SOLIDSExercise:Assertion And Reason
Explore 15 Videos
Similar Questions
Knowledge Check
Excess of pressure inside a soap bubble is
Ainversely proportional to its radiusBdirectly proportional to its radiusCdirectly proportional to square root of its radiusDindependent of its radiusThe excess pressure inside a soap bubble is
Ainversely proportional to the surface tensionBinversely proportional to its radiusCdirectly proportional to square of its radiusDinversely proportional to square of its radiusThe pressure inside a soap bubble is
Aequal to atmospheric pressure,Bless then atmospheric pressure,Cgreater than atmospheric pressure,Djust double of atmospheric pressure.
Which of the following expressions represents the excess of pressure inside the soap bubble?
View SolutionThe excess pressure inside a soap bubble is
View SolutionThe excess of pressure inside a drop or bubble is :
View SolutionAn air bubble just inside a soap solution and a soap bubble blown using the same solution have the same radii. The ratio of the excess pressure inside the air bubble to that inside the soap bubble is
View SolutionA soap bubble of radius 10−2 m is formed . The surface tension of the soap bubble is 0.04 N/m The excess of pressure inside the bubble is
View Solution

