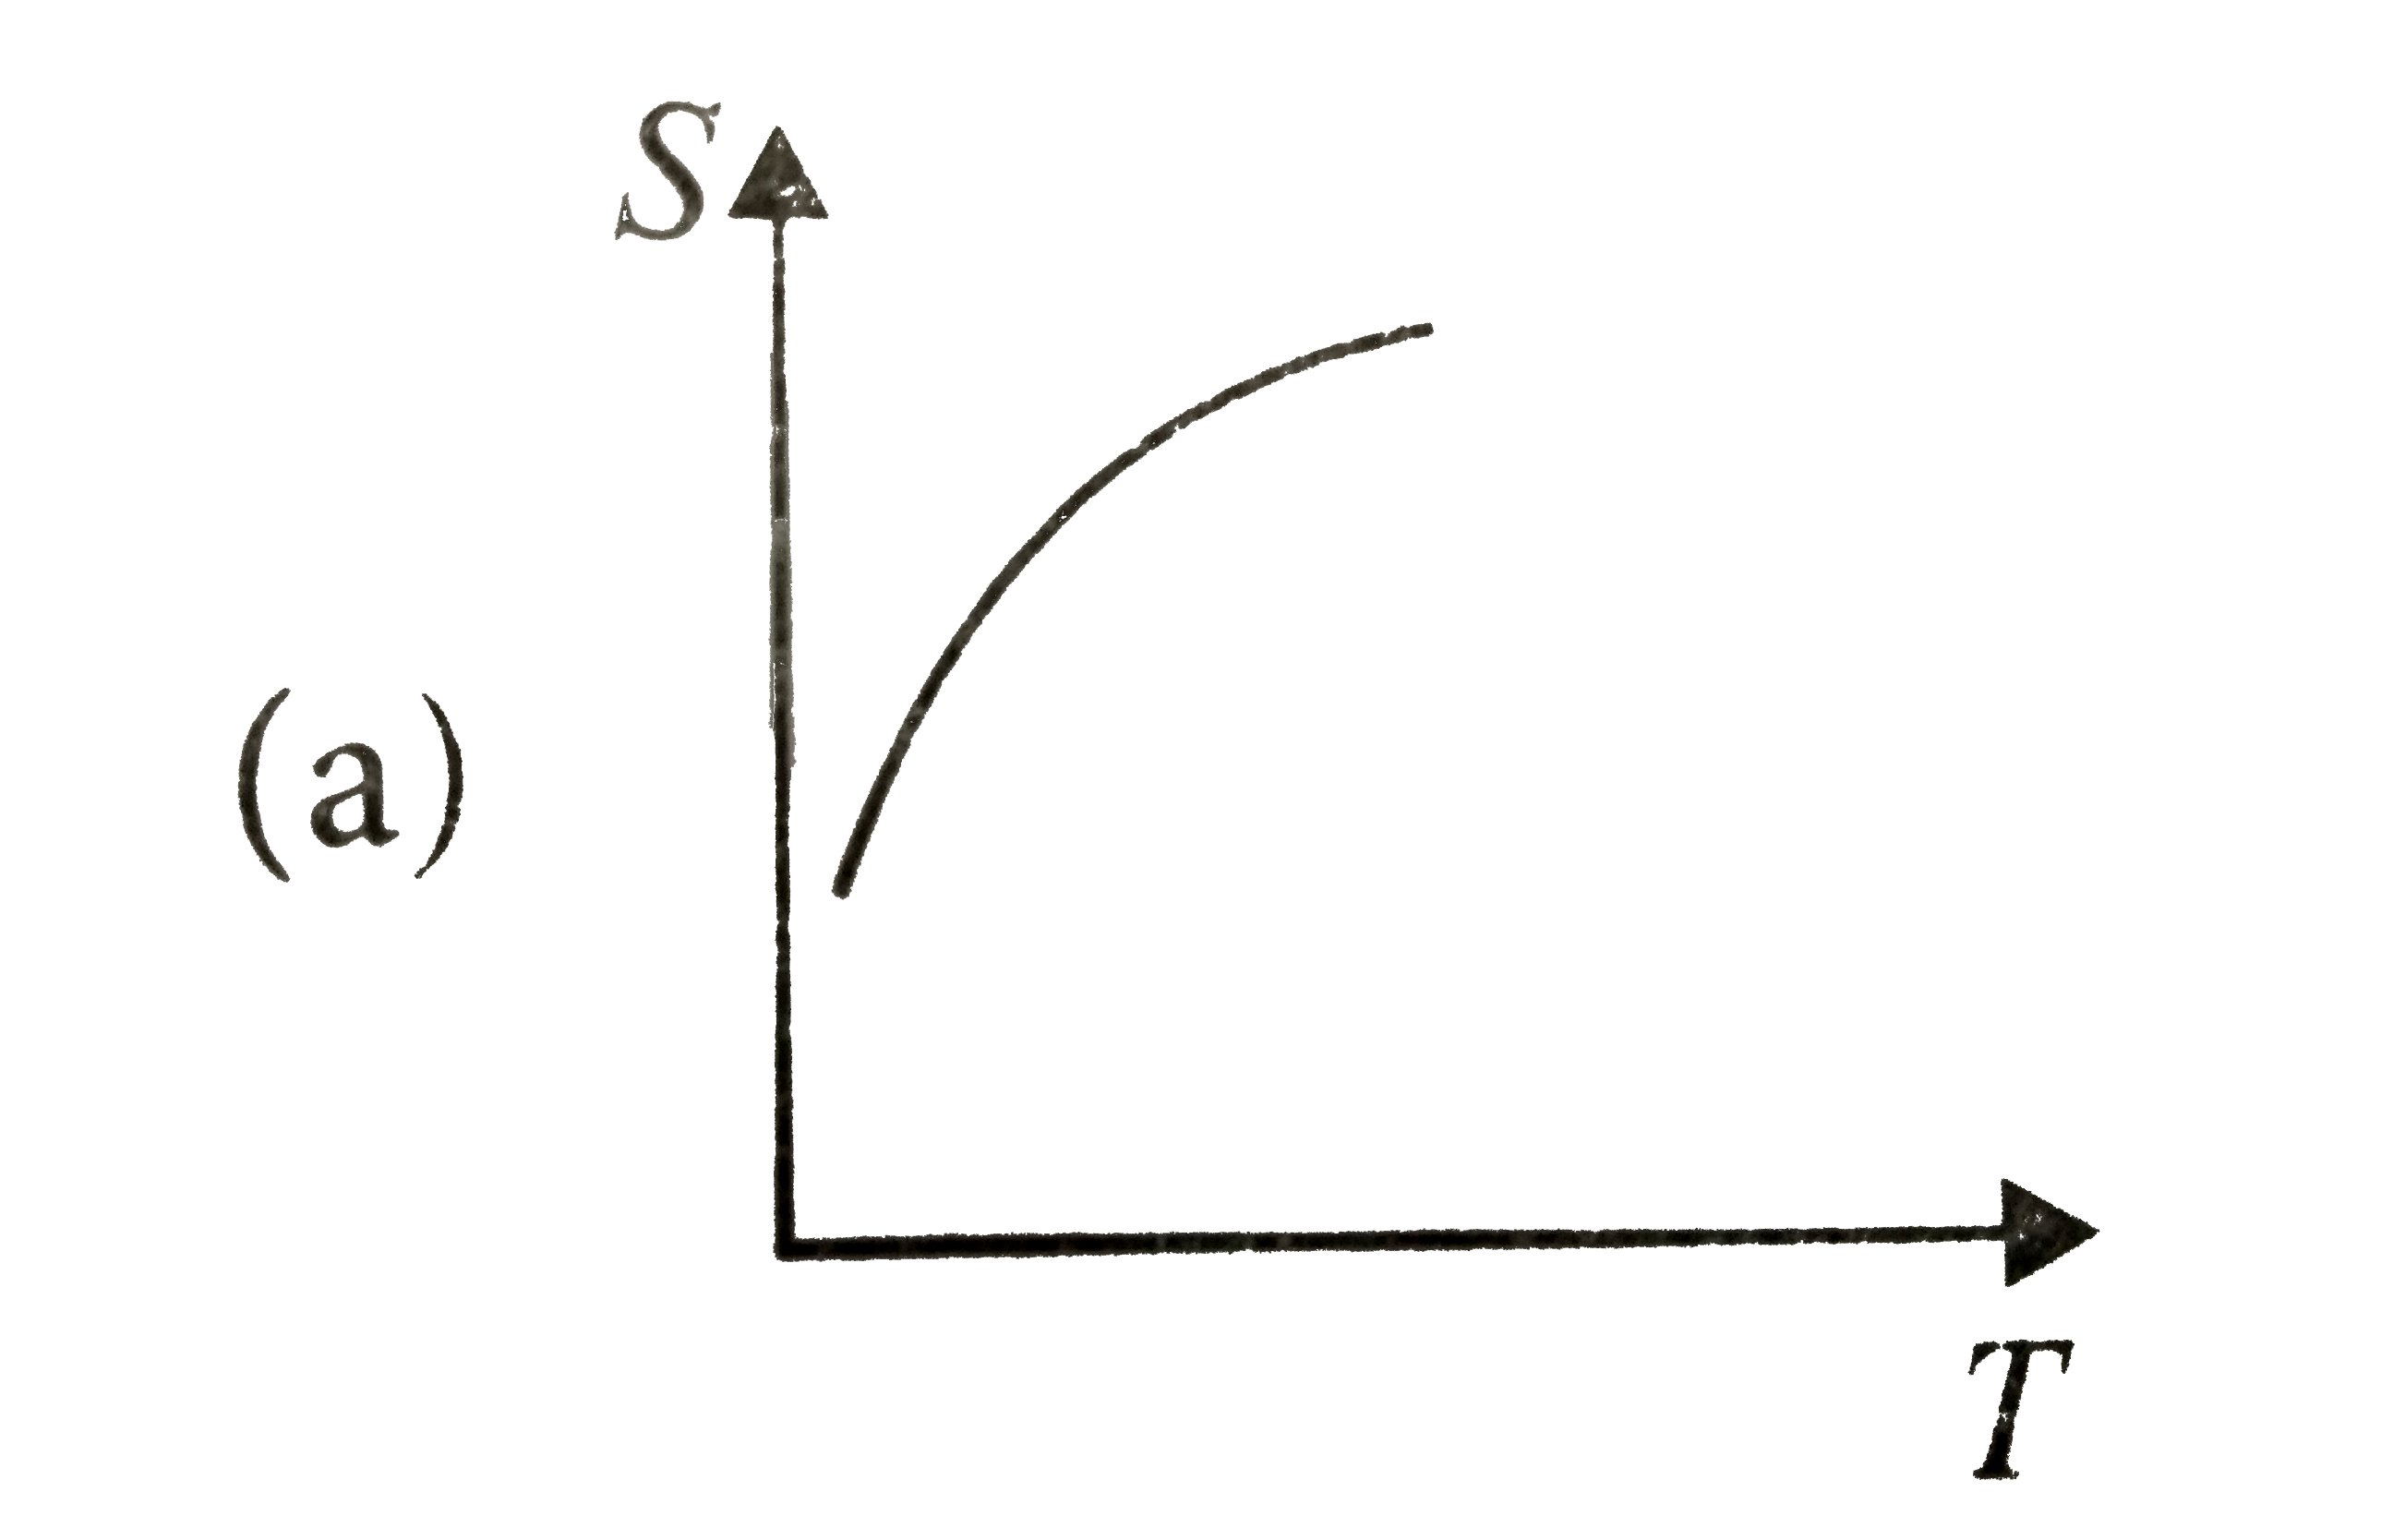
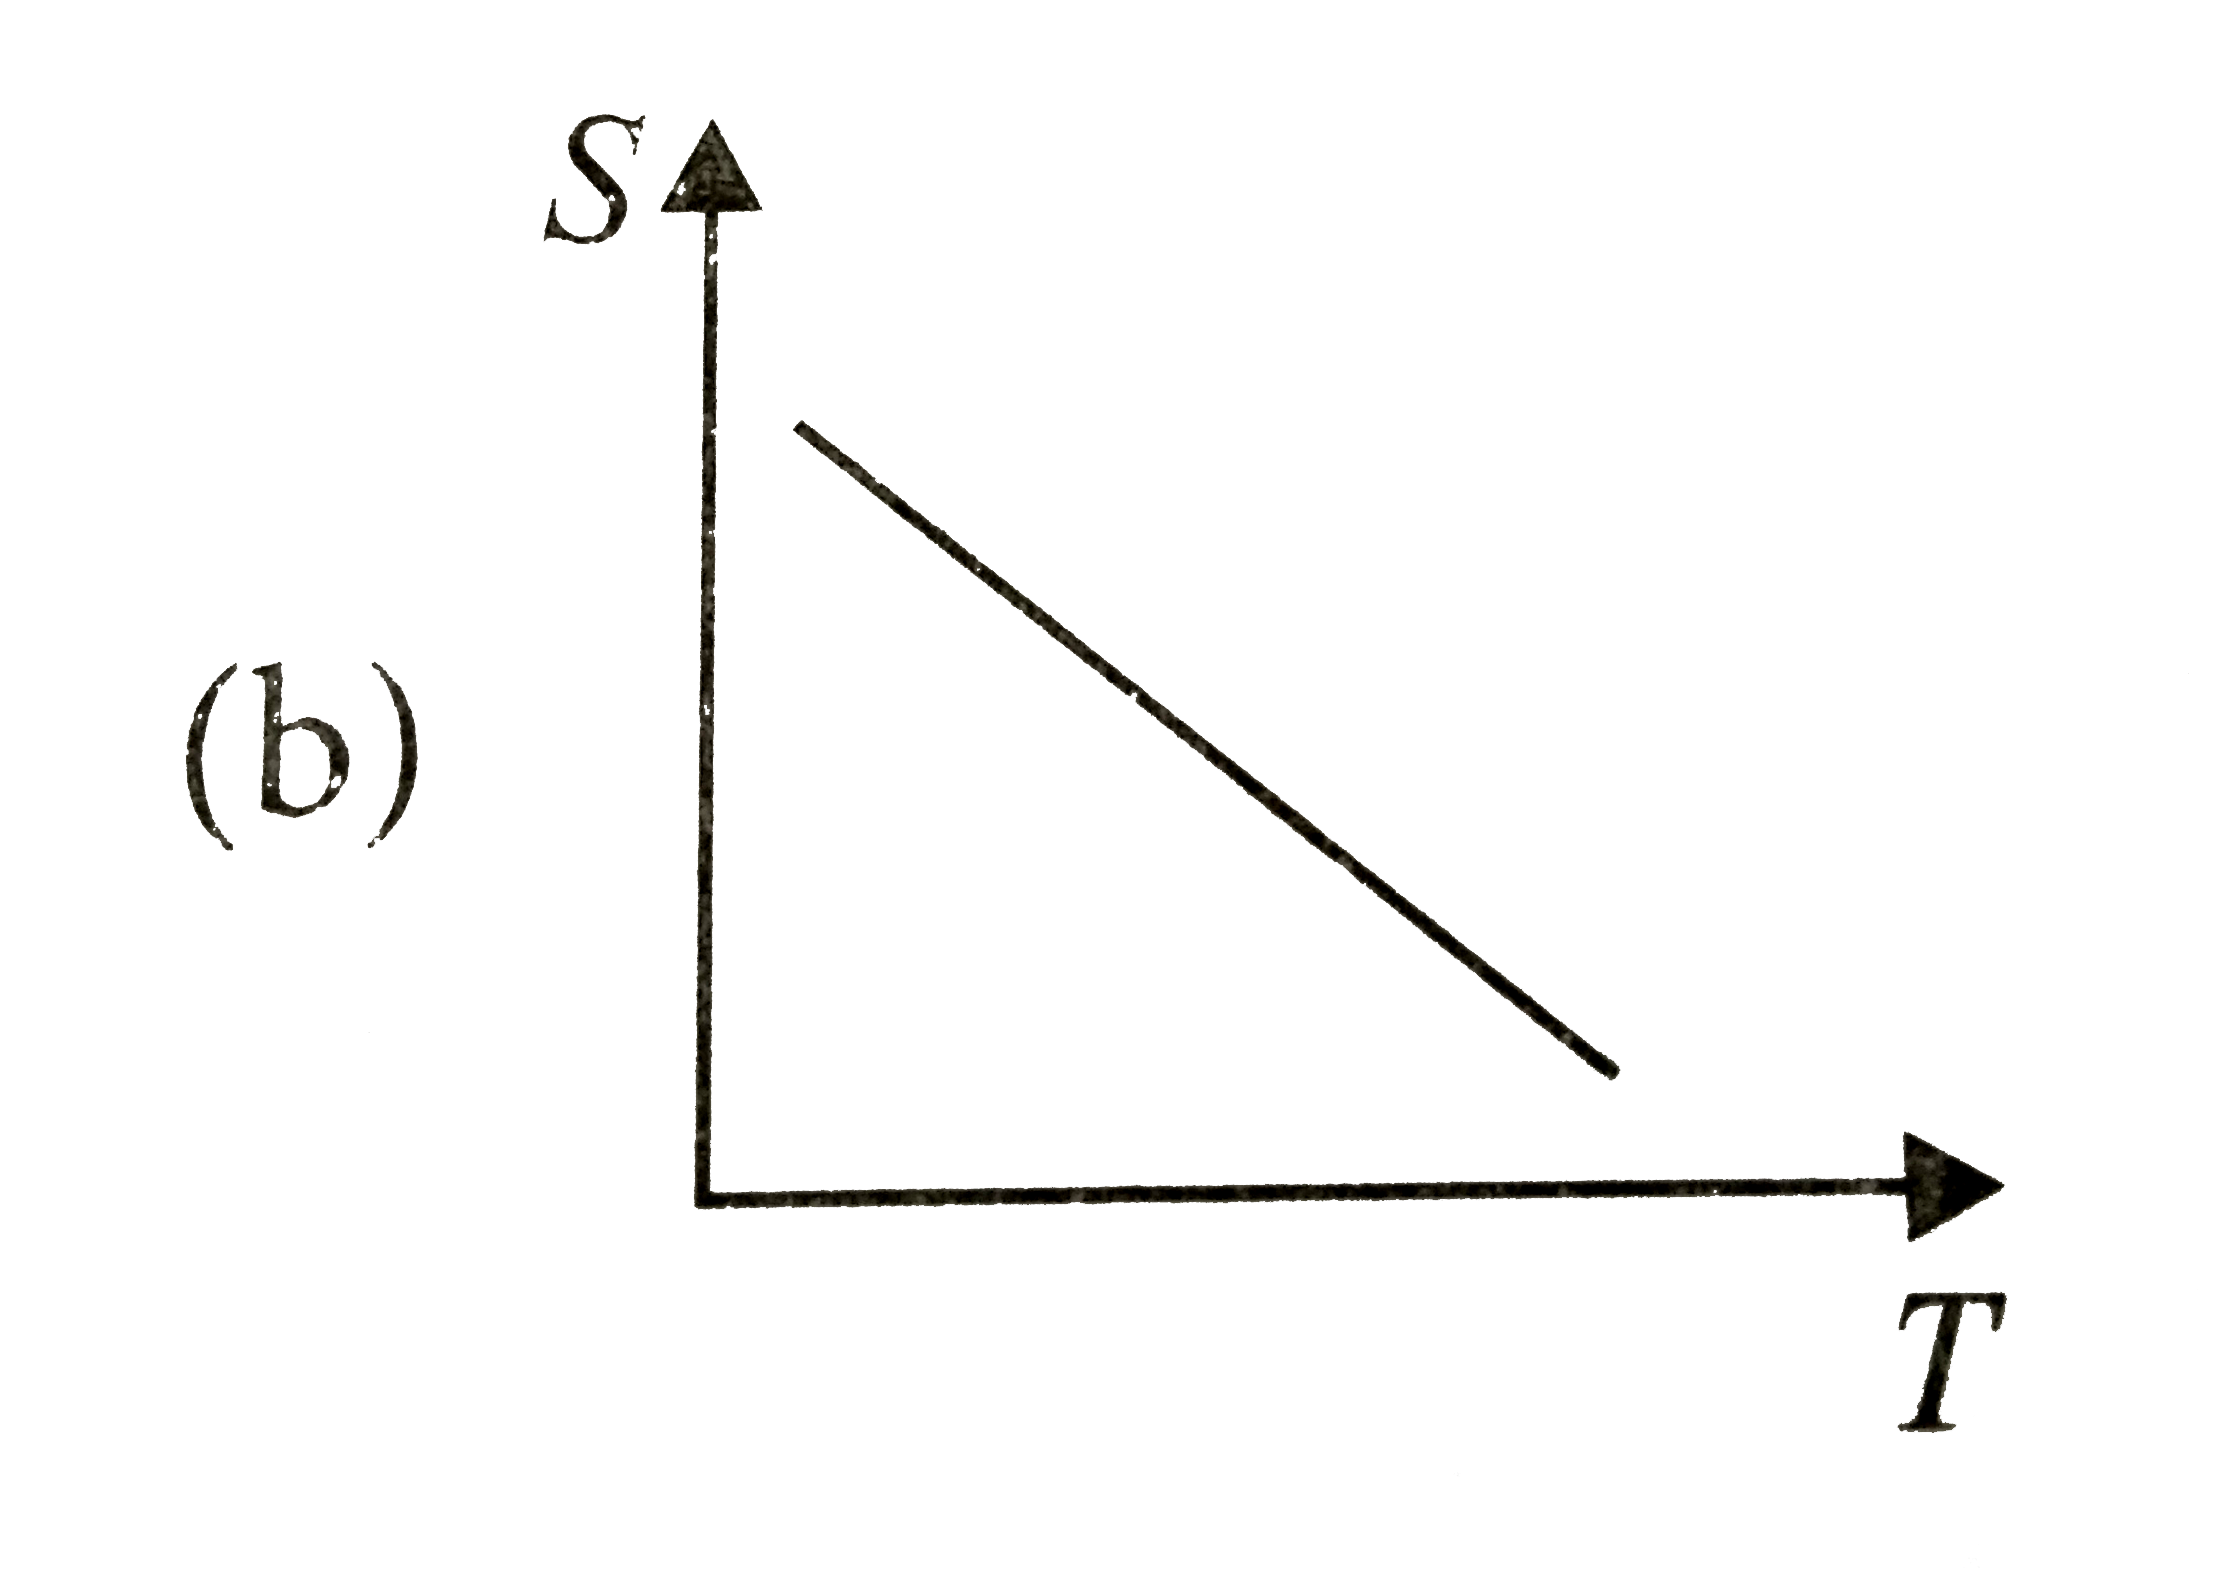
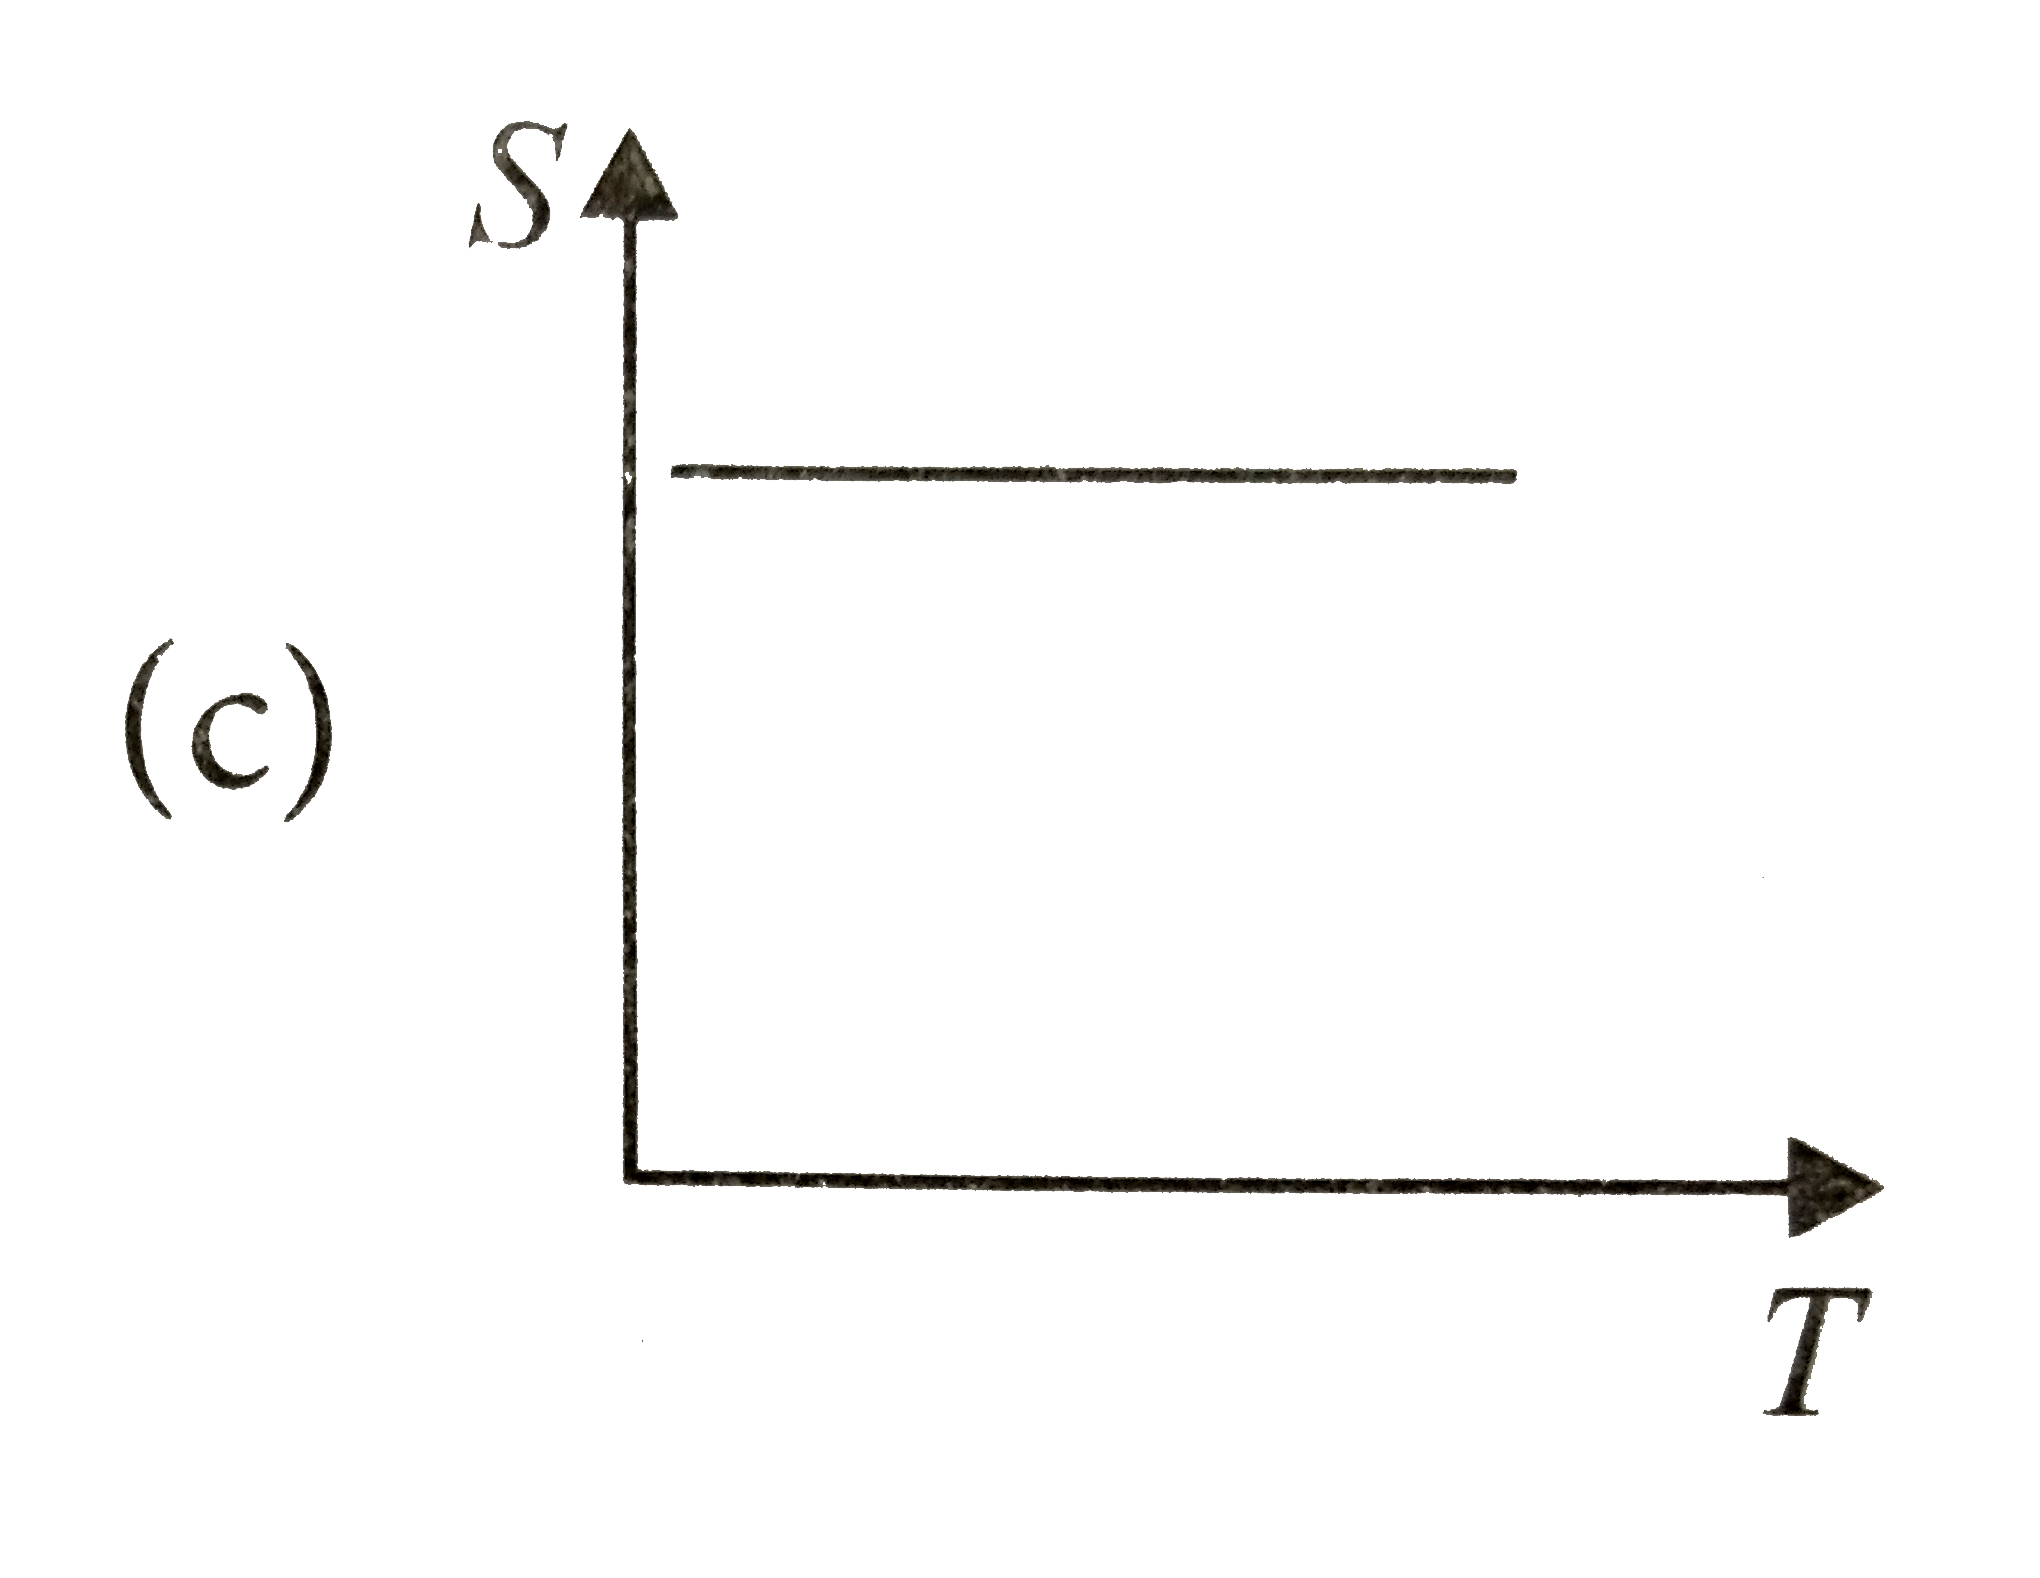
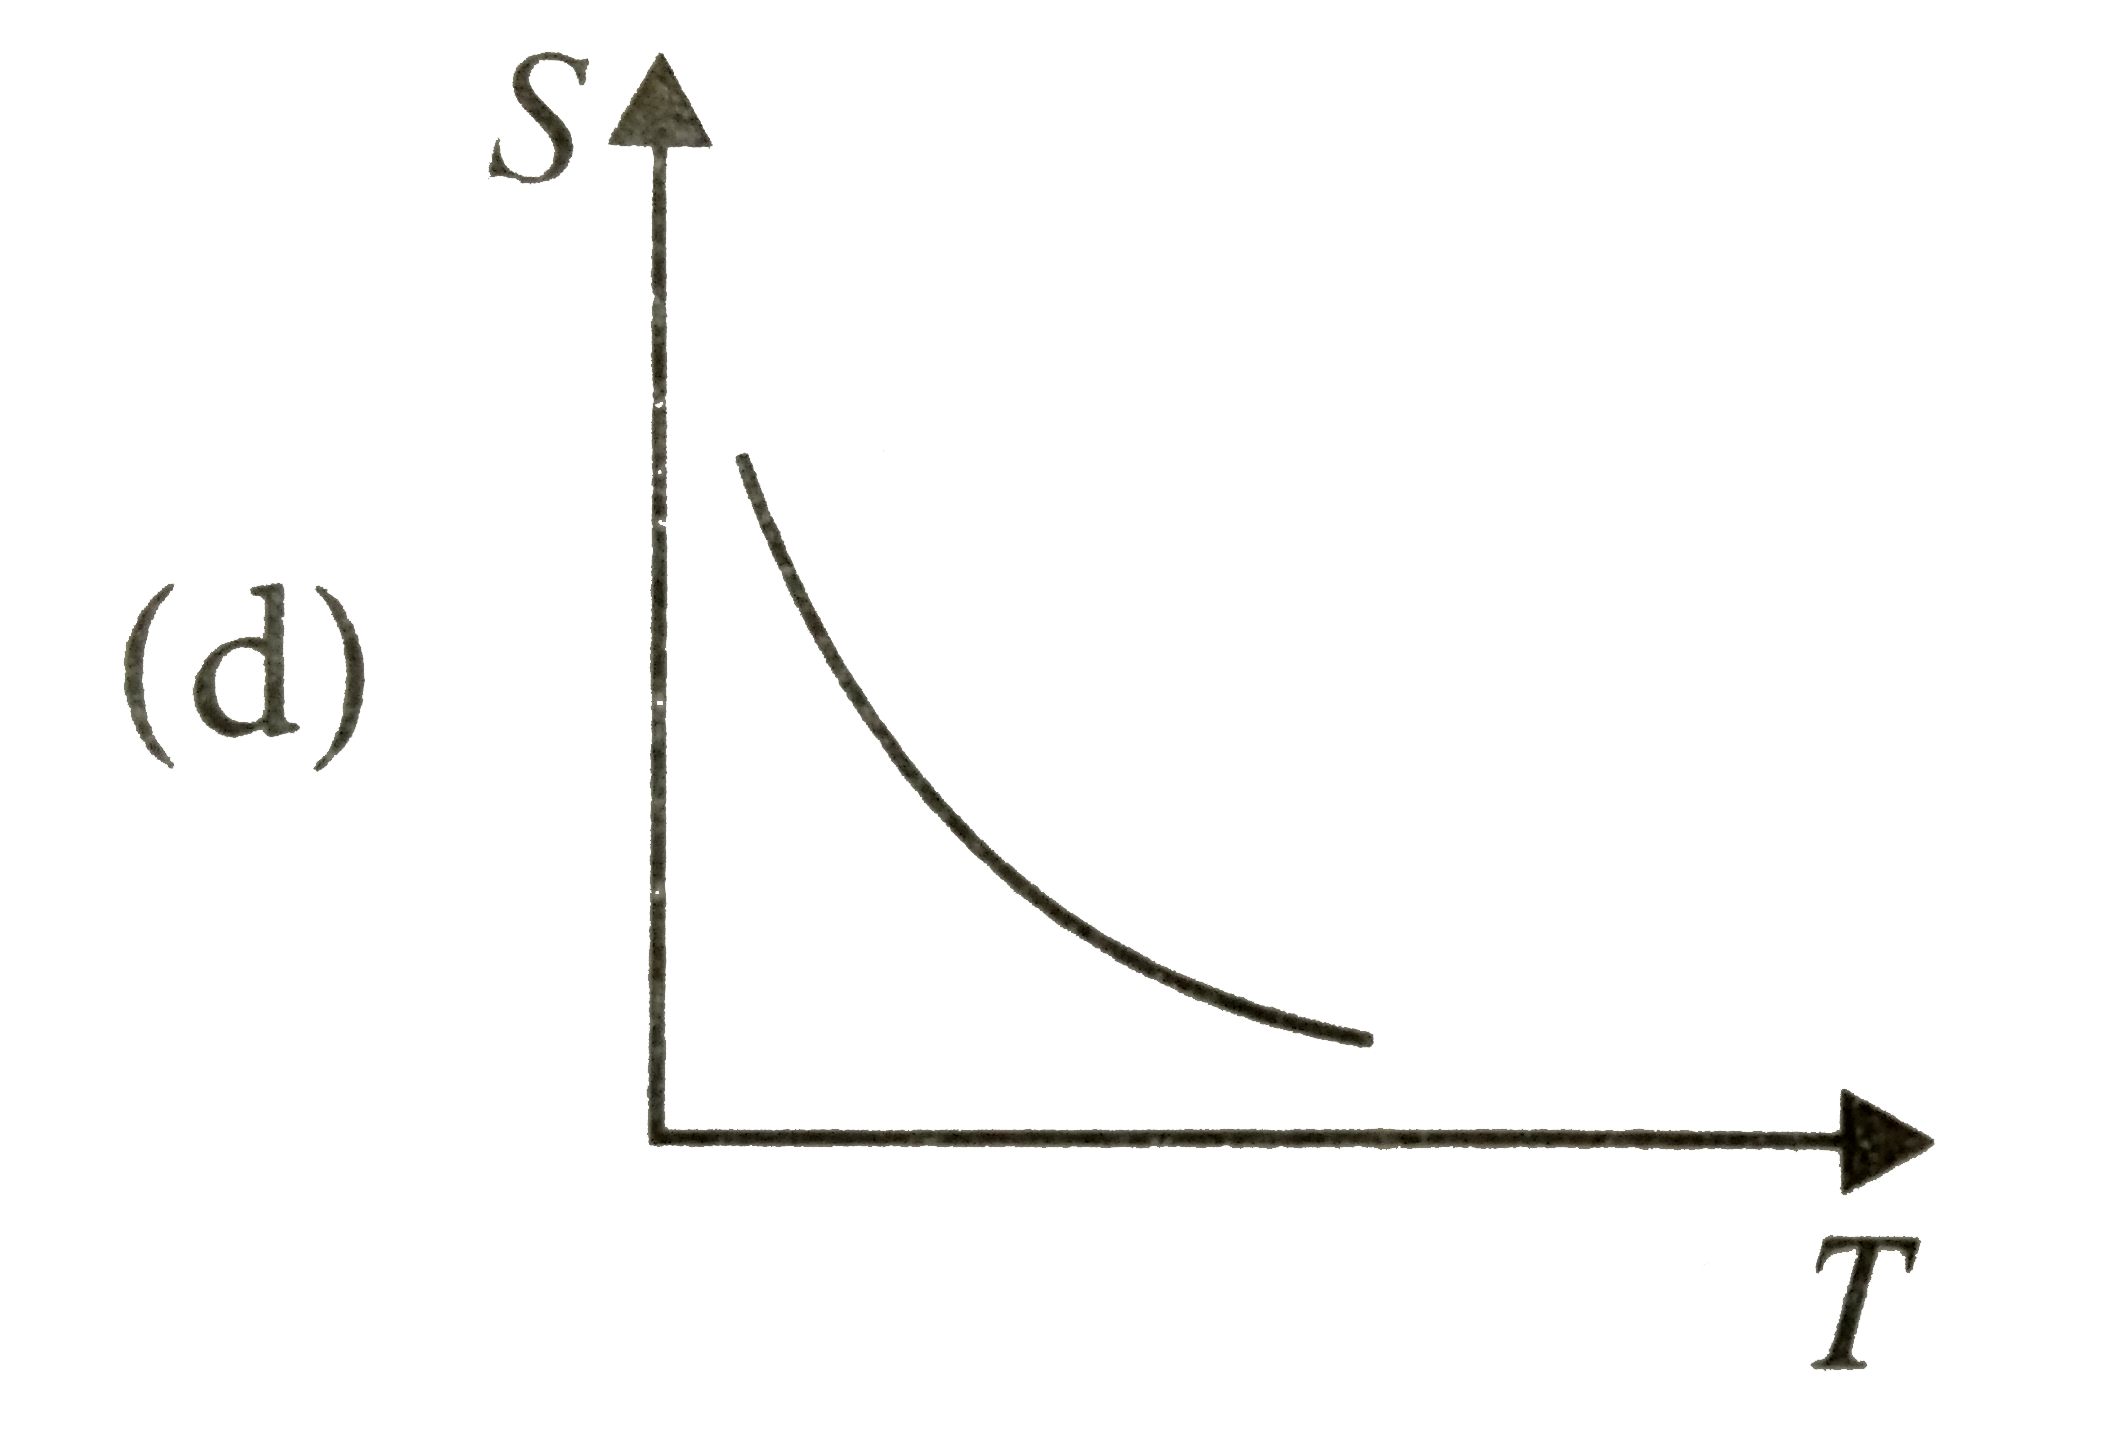
Which graph represents the variation of surface tension with temperature over small temperature ranges for water?


The correct Answer is:B
Step by step video, text & image solution for Which graph represents the variation of surface tension with temperature over small temperature ranges for water? by Physics experts to help you in doubts & scoring excellent marks in Class 11 exams.
Updated on:21/07/2023Topper's Solved these Questions
- MECHANICAL PROPERTIES OF FLUIDSBOOK - NCERT FINGERTIPSCHAPTER - MECHANICAL PROPERTIES OF FLUIDSEXERCISE - Higher Order Thinking Skills
8 Videos
- MECHANICAL PROPERTIES OF FLUIDSBOOK - NCERT FINGERTIPSCHAPTER - MECHANICAL PROPERTIES OF FLUIDSEXERCISE - NCERT Exemplar
5 Videos
- MECHANICAL PROPERTIES OF FLUIDSBOOK - NCERT FINGERTIPSCHAPTER - MECHANICAL PROPERTIES OF FLUIDSEXERCISE - Reynolds Number
4 Videos
- LAWS OF MOTIONBOOK - NCERT FINGERTIPSCHAPTER - LAWS OF MOTIONEXERCISE - Assertion And Reason
15 Videos
- MECHANICAL PROPERTIES OF SOLIDSBOOK - NCERT FINGERTIPSCHAPTER - MECHANICAL PROPERTIES OF SOLIDSEXERCISE - Assertion And Reason
15 Videos
Similar Questions
Knowledge Check
Which one of the following graphs represents the variation of surface tension of water with temperture for a small range of temperature ?
A B
B C
C D
D
Which one of the following represents correctly the variations of surface tension with temperature θ ?
AT∝θBT∝θ−1CT∝θ2DT∝θ−2The graph between surface tension and temperature T is
A B
B C
C D
D
Which one of the following given graphs represents the variation of rate constant (k) with temperature (t) for an endothermic reaction ?
View SolutionShow variation of resistivity of SI with temperature in a graph.
View SolutionArrhenius equation is :
k=Ae−E/RT
Which of the following graphs represents the variation of rate constant k against temperatureT ?
View Solutionwhich of the following graph represents the variation of resistivity (ρ) with temperature (T) for copper?
View SolutionWhich of the following curve represent variation of density of water with temperature best-
View Solution
