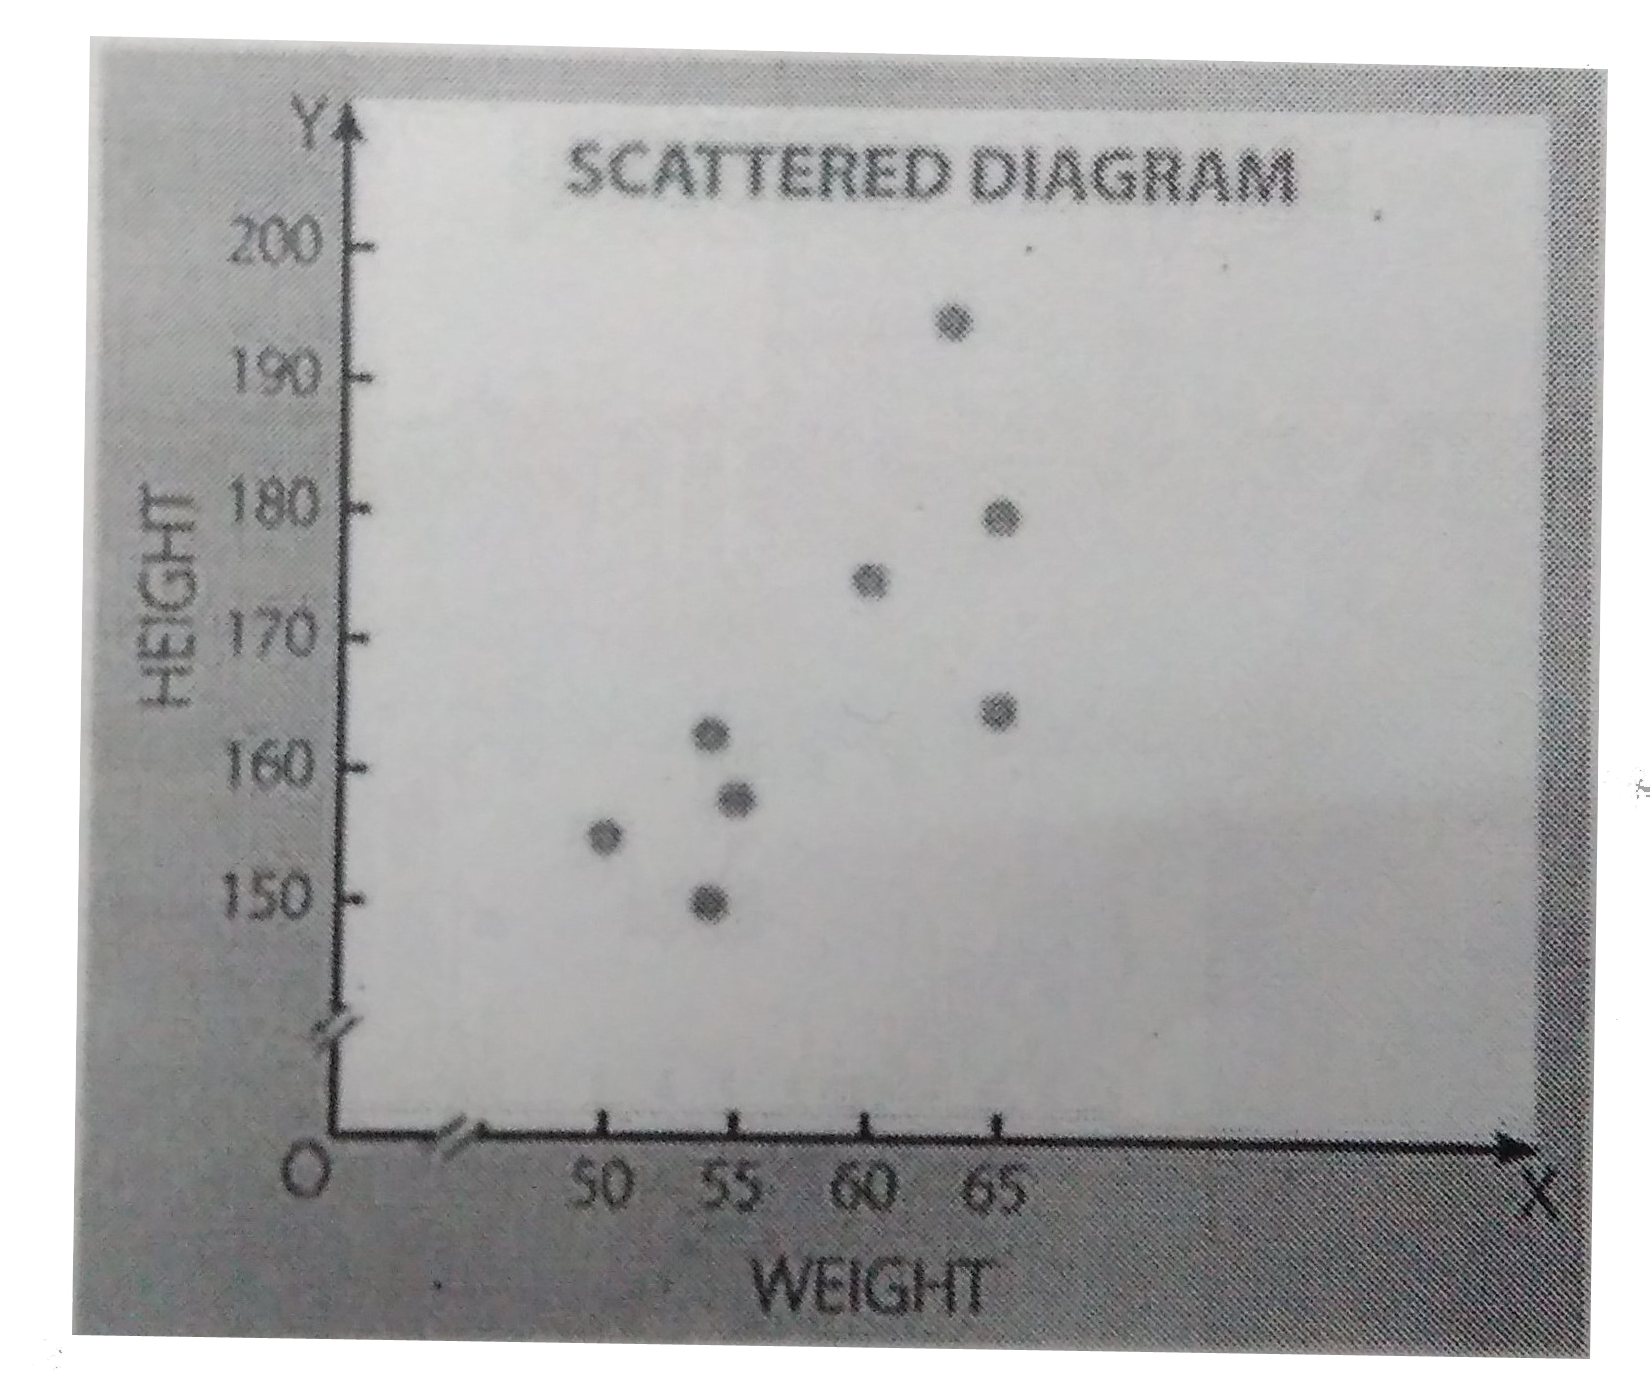
The following tables gives height nad weight of the students of a class. Make a scattered diagram to show if the relationship is positive or negative and if the relationship is strong or weak.

Text Solution

A glance at the above diagram shows that there is positive relationship between height and weight of the students. The dots are moving upward in a paticular course from left to right. It shows that with the increase in height, weight alos increase. However, this is a case of limited positvie correlation, because the dots do not make any straight line
|
Topper's Solved these Questions
- CORRELATIONBook:TARUN JAIN & VK OHRIChapter:CORRELATIONExercise:Learning by doing
Explore 5 Videos
- CORRELATIONBook:TARUN JAIN & VK OHRIChapter:CORRELATIONExercise:Objective type questions
Explore 9 Videos
- CONCEPT OF ECONOMICS AND SIGNIFICANCE OF STATISTICS IN ECONOMICSBook:TARUN JAIN & VK OHRIChapter:CONCEPT OF ECONOMICS AND SIGNIFICANCE OF STATISTICS IN ECONOMICSExercise:NCERT Questions
Explore 6 Videos
- DIAGRAMMATIC PRESENTATION OF DATA BAR DIAGRAMS AND PIE DIAGRAMSBook:TARUN JAIN & VK OHRIChapter:DIAGRAMMATIC PRESENTATION OF DATA BAR DIAGRAMS AND PIE DIAGRAMSExercise:NCERT Question (With Hints to Answers)
Explore 3 Videos
Similar Questions
Knowledge Check
Select the Venn diagram that best illustrates the relationship between the following classes. Teacher, writer and philosopher
A B
B C
C D
D
Which of the following diagram best depicts the relationship between student, college and school ?
A B
B C
C D
D
Following table shows the weights of 12 students: Find the mean weight.
View SolutionFollowing is the data showing weights of 40 students in a class . Find its median .

View SolutionShow the relationship between X and Y through a scattered diagram.

View SolutionThe weights of 25 students of a class are given in the following table:

Using short-cut method, find the mean weight.
View SolutionWhich one of the following diagrams best depicts the relationship among Boys, Students and Athletes?

View SolutionWhich of the following diagram best depicts the relationship between student, college and school?

View Solution


