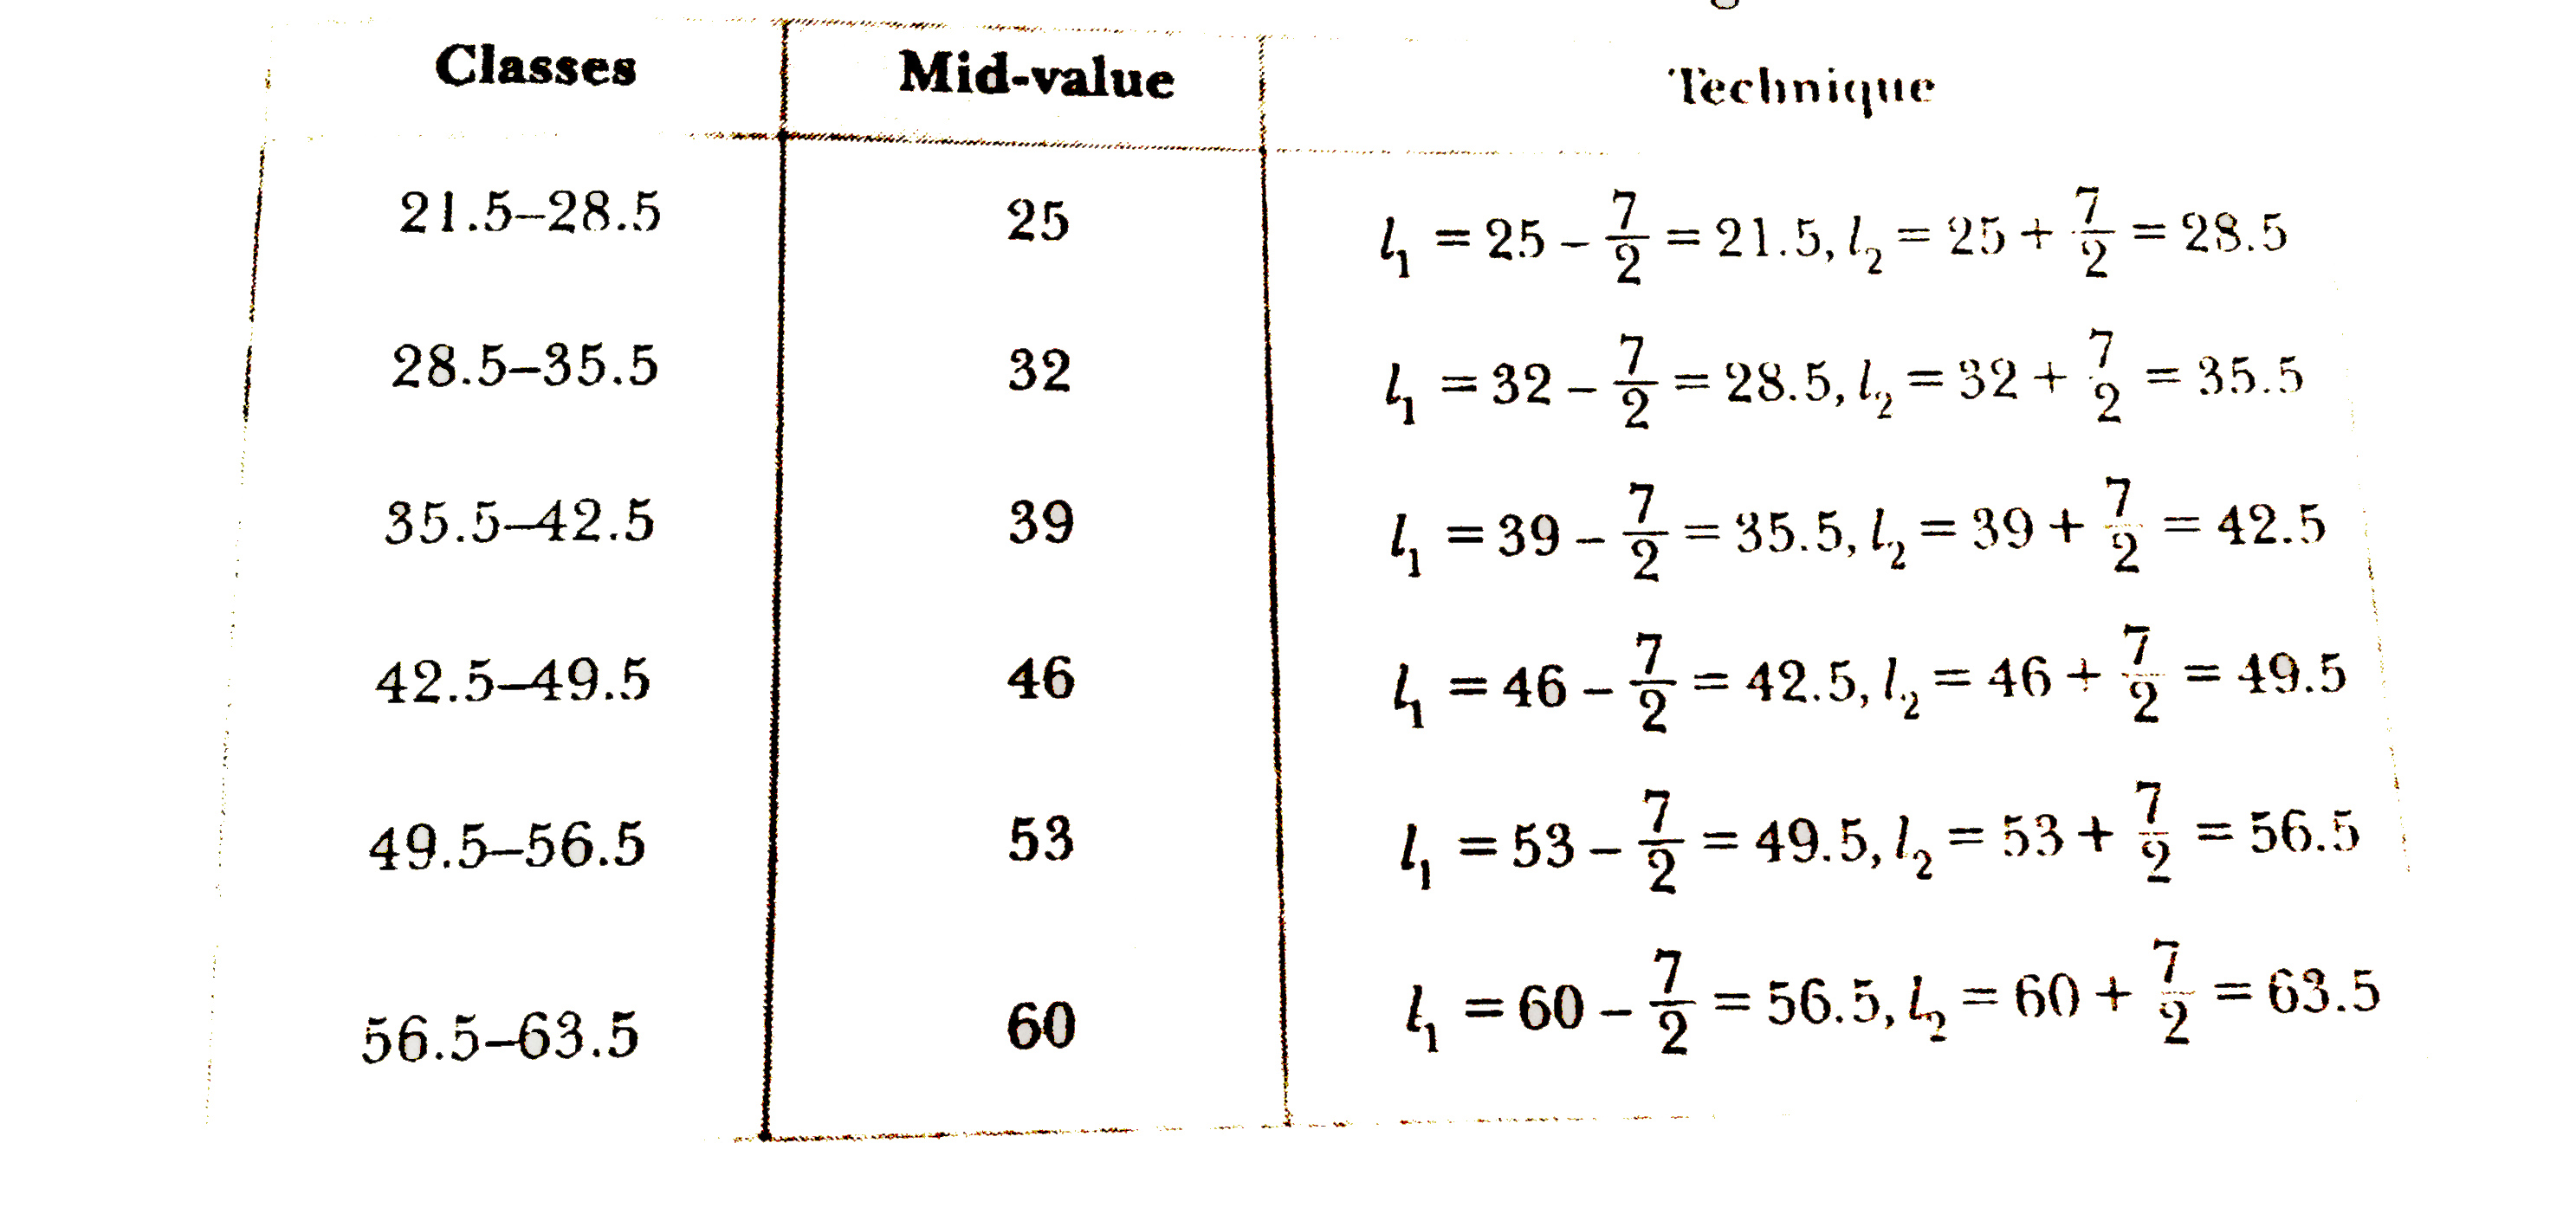
Class mid-values of a frequency distribution of marks in economics of a group of students in Class XI are given as 25,32,39,46,53 and 60.
Find the size of the class interval and class limits.
Video Solution
Text Solution
Size of class interval = Mutual difference between mid-values
=32-25=39-32 = 46-39= .....60-53
=7
Thus, the size of the class is 7.
Given the size of the class as 7 and mid-values of classes as 25, 32, 39, 46, 53 and 60, we can now obtain the class limits by using the following formulae:
Lower limit: l1=m−12i
Upper limit: l2=m+12i
where, m=mid-values, i = difference between mid-values or the size of class.
Accordingly, the class limits of the first class will be :
l1=25−12×7−25−3.5−21.5
l2=25+12×7=25+3.5=28.5
and so on.
Thus, the various classes with class limits are given as :

|
Topper's Solved these Questions
- ORGANISATION OF DATABook:TARUN JAIN & VK OHRIChapter:ORGANISATION OF DATAExercise:Miscellaneous Illustration
Explore 13 Videos
- ORGANISATION OF DATABook:TARUN JAIN & VK OHRIChapter:ORGANISATION OF DATAExercise:EXERCISE M.C.Q
Explore 10 Videos
- MEASURES OF DISPERSIONBook:TARUN JAIN & VK OHRIChapter:MEASURES OF DISPERSIONExercise:Learning by doing
Explore 30 Videos
- PRESENTATION OF DATA - TEXTUAL AND TABULAR PRESENTATIONBook:TARUN JAIN & VK OHRIChapter:PRESENTATION OF DATA - TEXTUAL AND TABULAR PRESENTATIONExercise:ESSENTIAL PRATICALS
Explore 8 Videos
Similar Questions
Knowledge Check
Class mark of class interval 60–70 is
A60B70C65D72Consider the frequency distribution.

The upper limit of median class isA17B17.5C18D18.5The class marks of a frequency distribution are 15, 20, 25, 30. The class corresponding to the class mark 20 is
A12.5-17.5B17.5-22.5C18.5-21.5D19.5 -20.5
The distribution given below show the marks of 100 students of a class:
then find Ogive medium of data
View SolutionThe frequency distribution of marks obtained by students in a class test is given below .
Draw frequency polygon and ogive.

View SolutionThe mid-value of a class interval is 25 and the class size is 8. The class interval is
View SolutionClass mark of a particular class is 6.5 and class size is 3, then class interval is:
View SolutionThe class marks of a frequency distribution are 15, 20, 25, 30, ..... The class corresponding to the class mark 25 is
View Solution