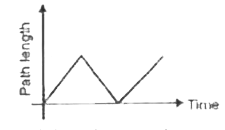
A : The following graph can't exist actually

R :Total path length never decreases with time.
If both Assertion & Reason are true and the reason is the correct explanation of the assertion, then mark (1).
If both Assertion & Reason are true but the reason is not the correct explanation of the assertion, then mark (2).
If Assertion is true statement but Reason is false, then mark (3).
If both Assertion and Reason are false statement, then mark (4).
The correct Answer is:1
Step by step video, text & image solution for A : The following graph can't exist actually R :Total path length never decreases with time. by Physics experts to help you in doubts & scoring excellent marks in Class 12 exams.
Updated on:21/07/2023Topper's Solved these Questions
- MOTION IN A STRAIGHT LINEBook:AAKASH INSTITUTEChapter:MOTION IN A STRAIGHT LINEExercise:ASSIGNMENT (SECTION - C)
Explore 37 Videos
- MOTION IN A PLANEBook:AAKASH INSTITUTEChapter:MOTION IN A PLANEExercise:Assignement section -J (Aakash Challengers Questions)
Explore 4 Videos
- MOTION IN STRAIGHT LINEBook:AAKASH INSTITUTEChapter:MOTION IN STRAIGHT LINEExercise:Assignment (SECTION - J)
Explore 2 Videos
Similar Questions
Knowledge Check
Which of the following pair can't exist in solution
ANaHCO3 and NaOHBNa2CO3 and NaOHCNa2CO3 and NaClDNaHCO3 and NaClIn which of the following velocity (v) - time (t) graphs, the instantaneous acceleration decreases with time?
A B
B C
C D
D
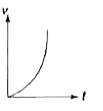
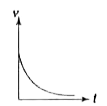
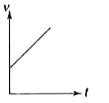
In which of the following velocity (v) - time (1) graphs, the instantaneous acceleration decreases with time?
A B
B C
C D
D
Which of the following can never dishonoured ?
View SolutionWhich of the following.v-t graph can be obtained in practice?

View SolutionA : for a moving particle distance can never be negative or zero.
R : Distance is a scalar quantity and never decreases with time for moving object.
View SolutionThe graph shown the variation with times t of the velocity v of an object . Which one of the following graphs best represents the variation of acceleration a of the object with time t?

View SolutionWhich of the following graphs represents the variation of activity (A) of a radioactive substance with time (t).
View Solution

