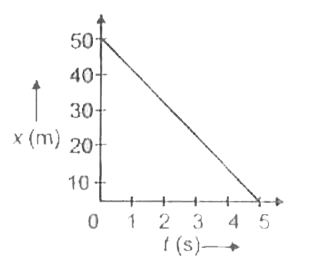
An object was at x = 50 m at t = 0, then it starts moving uniformly towards origin at time t = 5 s. It is at origin. Draw the position versus time (x-t) graph for the object under this situation.
From the given values we can draw the following position - time graph.

Topper's Solved these Questions
- MOTION IN A STRAIGHT LINEBOOK - AAKASH INSTITUTECHAPTER - MOTION IN A STRAIGHT LINEEXERCISE - TRY YOURSELF
40 Videos
- MOTION IN A STRAIGHT LINEBOOK - AAKASH INSTITUTECHAPTER - MOTION IN A STRAIGHT LINEEXERCISE - EXERCISE
30 Videos
- MOTION IN A PLANEBOOK - AAKASH INSTITUTECHAPTER - MOTION IN A PLANEEXERCISE - Assignement section -J (Aakash Challengers Questions)
4 Videos
- MOTION IN STRAIGHT LINEBOOK - AAKASH INSTITUTECHAPTER - MOTION IN STRAIGHT LINEEXERCISE - Assignment (SECTION - J)
2 Videos
Similar Questions
Knowledge Check
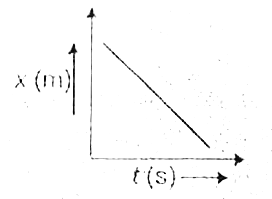
The position - time (x−t) graph of an object in uniform motion is shown below, the velocity of object is
 APositiveBNegativeCZeroDNone of these
Draw the position-time graph of a moving object, moving with zero acceleration.
View SolutionDraw the velocity-time graph of an object moving with uniform positive acceleration.
View SolutionThere are two cars on a straight road, marked as x axis. Car A is travelling at a constant speed of VA=9m/s. Let the position of the Car A, at time t=0, be the origin. Another car B is L=40m ahead of car A at t=0 and starts moving at a constant acceleration of a=1m/s2 (at t = 0). Consider the length of the two cars to be negligible and treat them as point objects.

(a) Plot the position–time (x–t) graph for the two cars on the same graph. The two graphs intersect at two points. Draw conclusion from this.
(b) Determine the maximum lead that car A can have.
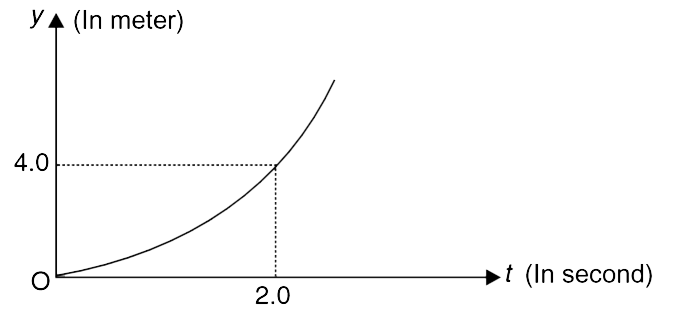
View SolutionAn elevator starts moving upward with constant acceleration. The position time graph for the floor of the elevator is as shown in the figure. The ceiling to floor distance of the elevator is 1.5 m. At t=2.0s, a bolt breaks loose and drops from the ceiling.
(a) At what time t0 does the bolt hit the floor?
(b) Draw the position time graph for the bolt starting from time t=0. [take g=10m/s2]

View SolutionParticle A is moving with a constant velocity of VA=50ms–1 in positive x direction. It crossed the origin at time t=10s. Another particle B started at t=0 from the origin and moved with a uniform acceleration of aB=2ms–2 in positive x direction.
(a) For how long was A ahead of B during the subsequent journey?
(b) Draw the position (x) time (t) graph for the two particles and mark the interval for which A was ahead of B.
View SolutionPosition (x) versus time (t) graph of a particle is as shown. The velocity is zero at?
View SolutionObtain the formulae for the position of an object moving with uniform velcity v at any time t in terms of its position at t = 0
View Solution
