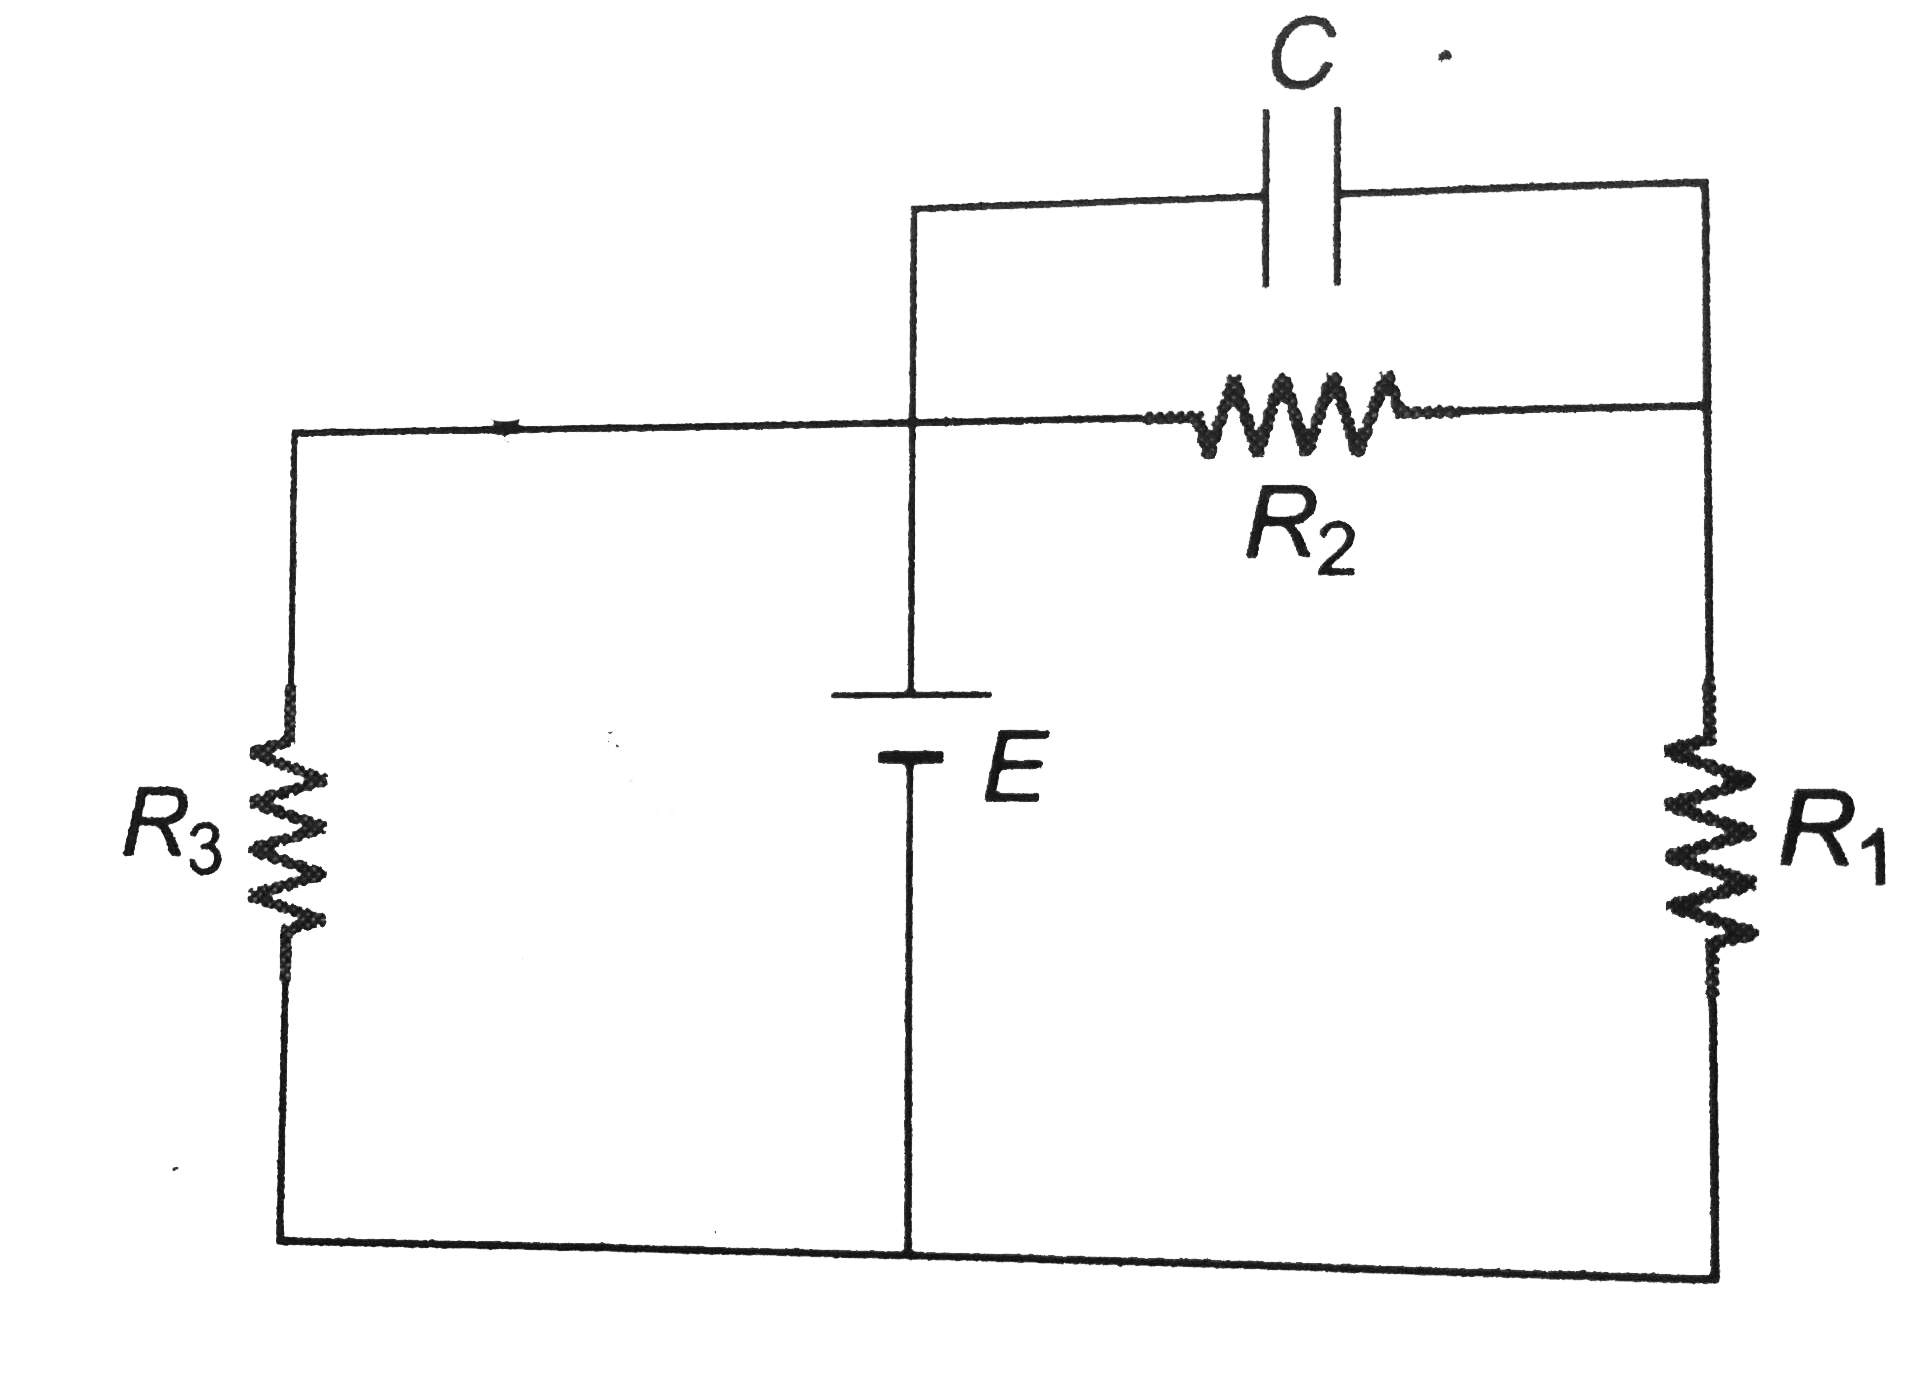
In the figure shown below, find out the current as function of time and charge on capacitor C1and also plot the graph of charge on plate A and B of capacitor C2 as a function of time.
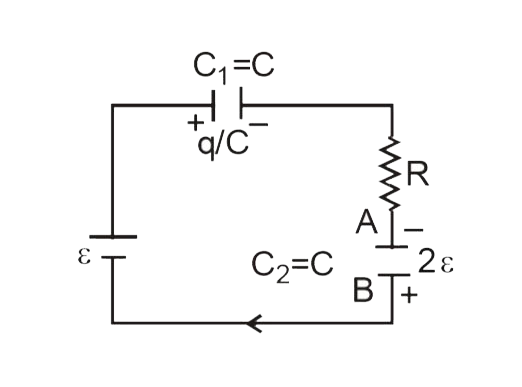
Let at any time charge on C1=q
Now apply, K.V.L. −IR−qc−(q−2εC)C+ε=0
3e=2qc+iR⇒3eC=2q+iRC
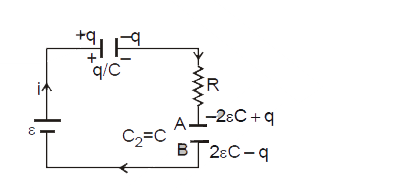
3eC=2q+iRCraRq∫0dq3eC−2q=t∫0dtRC
=ln(3eC−2q)2q∫0=tRC
3eC−2q=3eCe−2t/RC
⇒q=3eC2(1−e−2t/RC
i=dqdt=3eRe−2/RC
At plate A, Charge qA=q−2eC=32eC(1−e−2t/RC−2eC
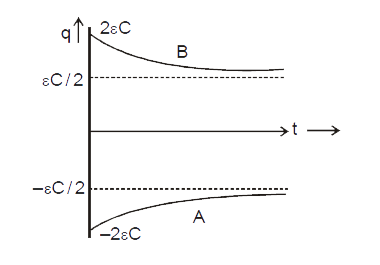
=−ec2−3ec2e−2t/RC
qA=−ec2(1+3e−2t/RC)
qB=ec2(1+3e−2t/RC
Topper's Solved these Questions
Similar Questions
Knowledge Check
In the LC circuit shown below, the current is in direction as shown and the charges on the capacitor plates have the sign as shown. At this instant
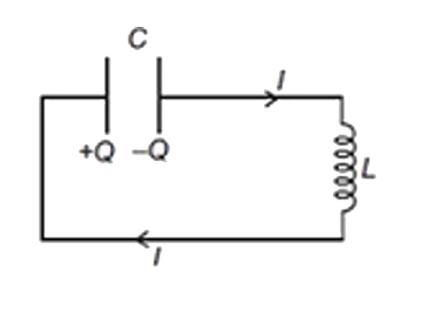 AI is increasing Q is increasingBI is increasing Q is decreasingCI is decreasing Q is increasingDI is decreasing and Q is decreasing
In the circuit shown in the adjacent figure, the batteries are ideal. The charge on the capacitor C is
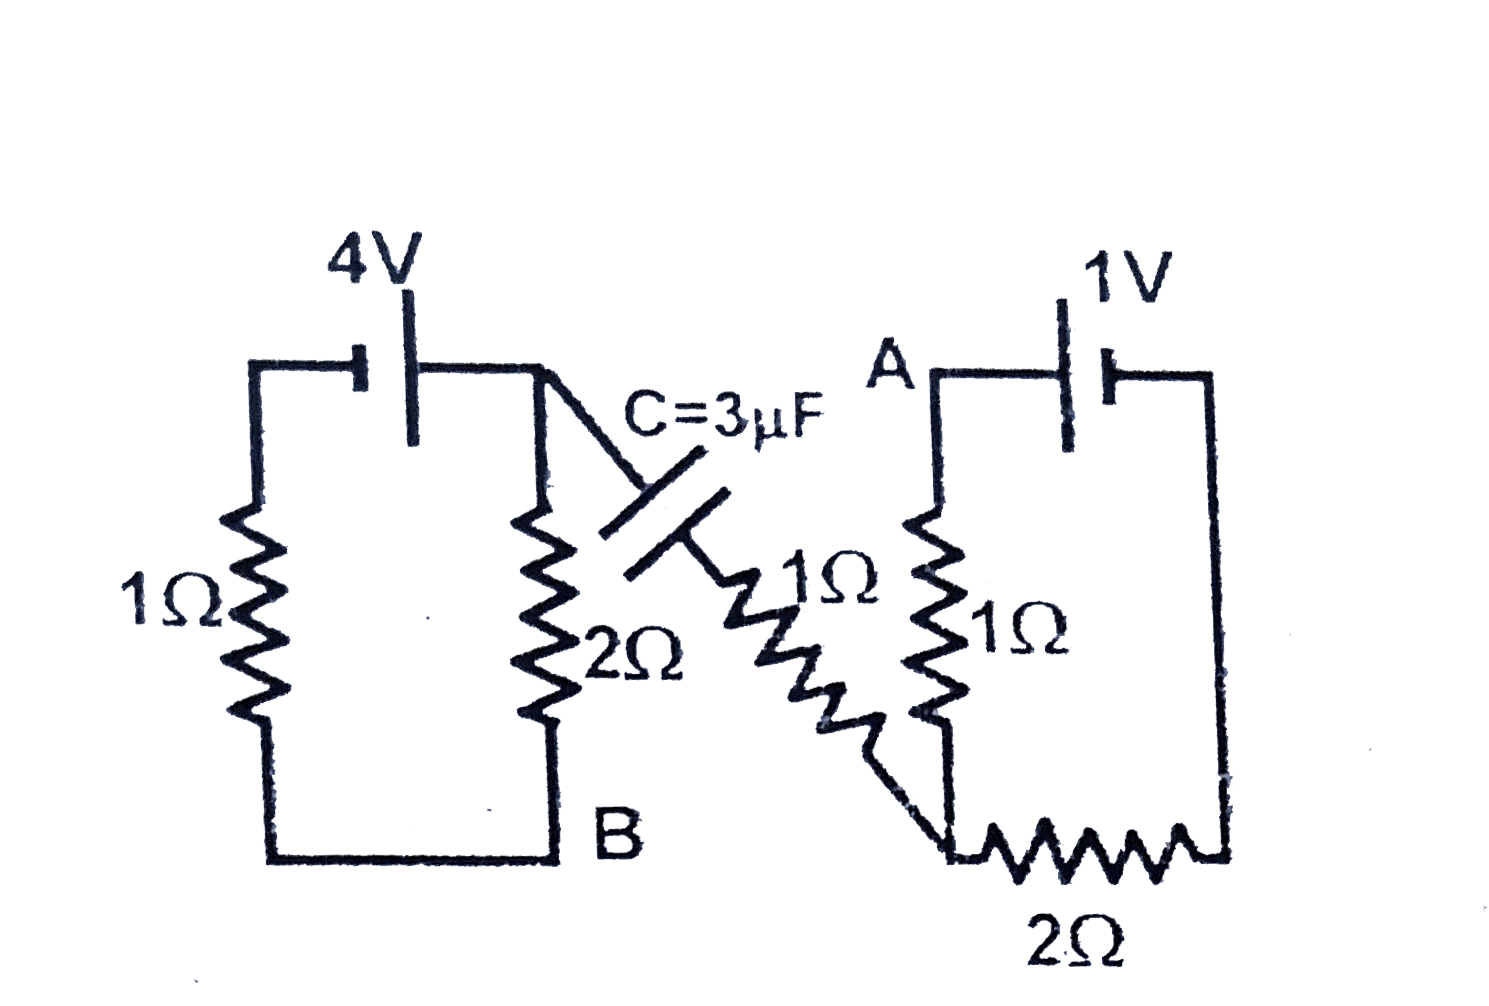 A10μCB20μCC30μCDzeo
The switch shown n the figure is closed at t=0. The charge on the capacitor as a function of time is given by
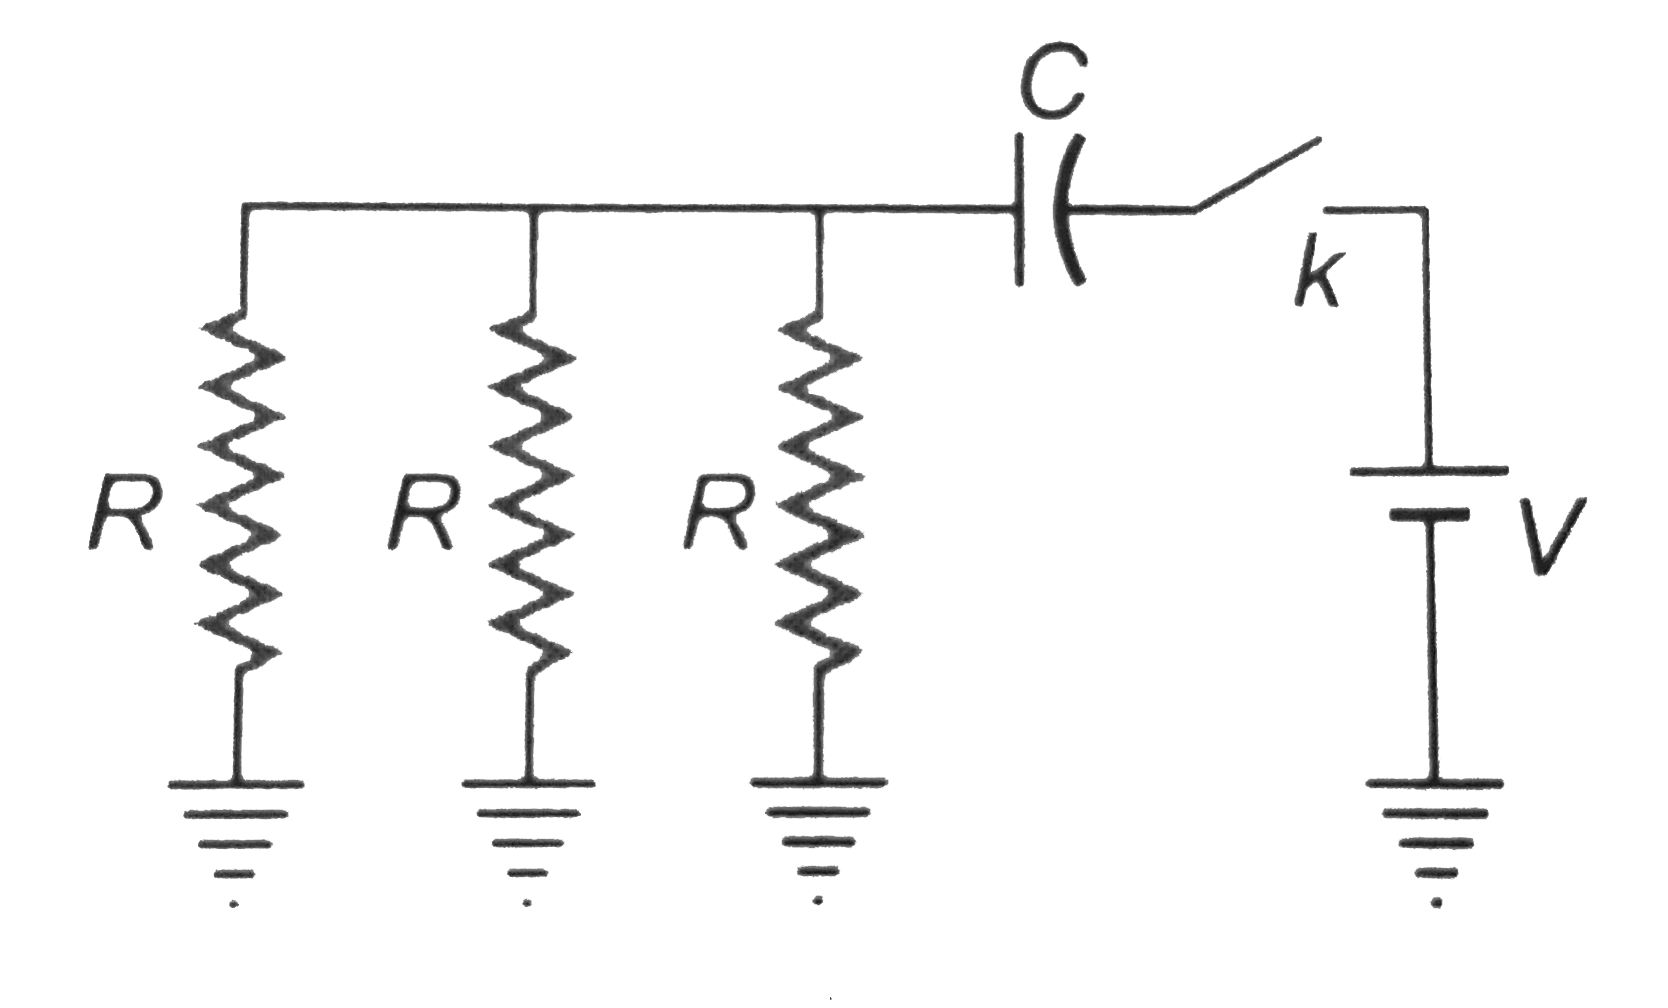 ACV(1−e−tRC)B3CV(1−e−tRC)CCV(1−e−3tRC)DCV(1−e−t3RC)
Find the current as a function of time in case of
(a) charging and
(b) discharging of a capacitor in a simple RC circuit
View Solution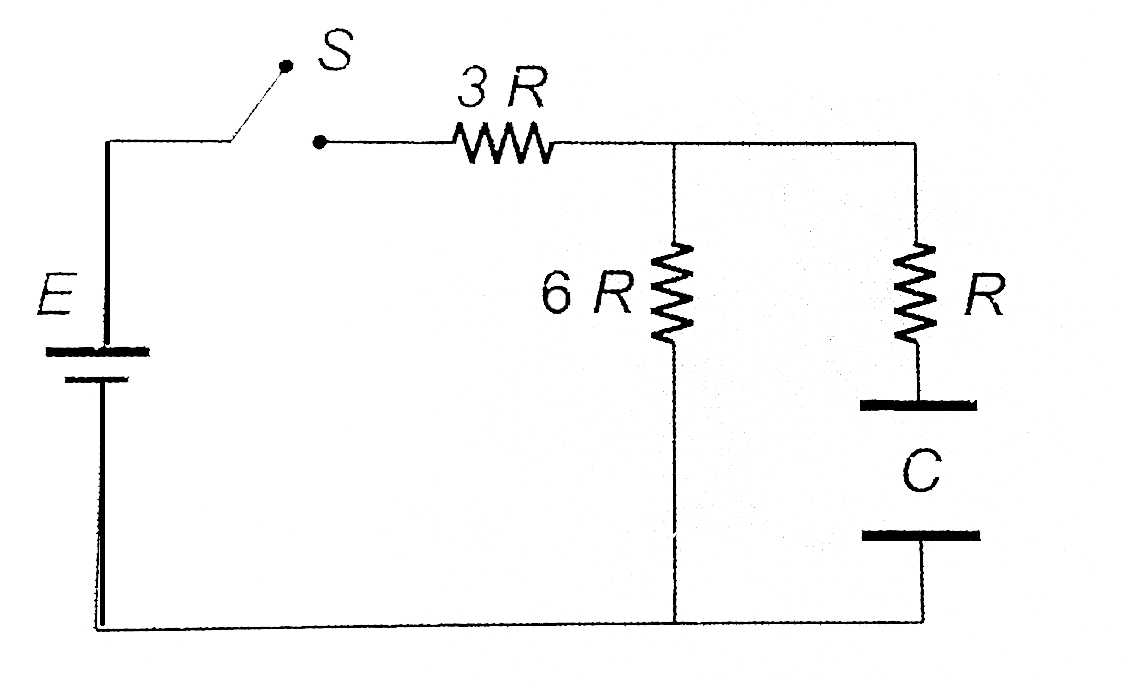
Find (a) equivalent time constant, (b) charge on capacitor in terms of time t.
View SolutionIf a capacitor of capacitance C is also connected in the larger loop as shows in Fig . , find the charge on the capactior as a function of time.
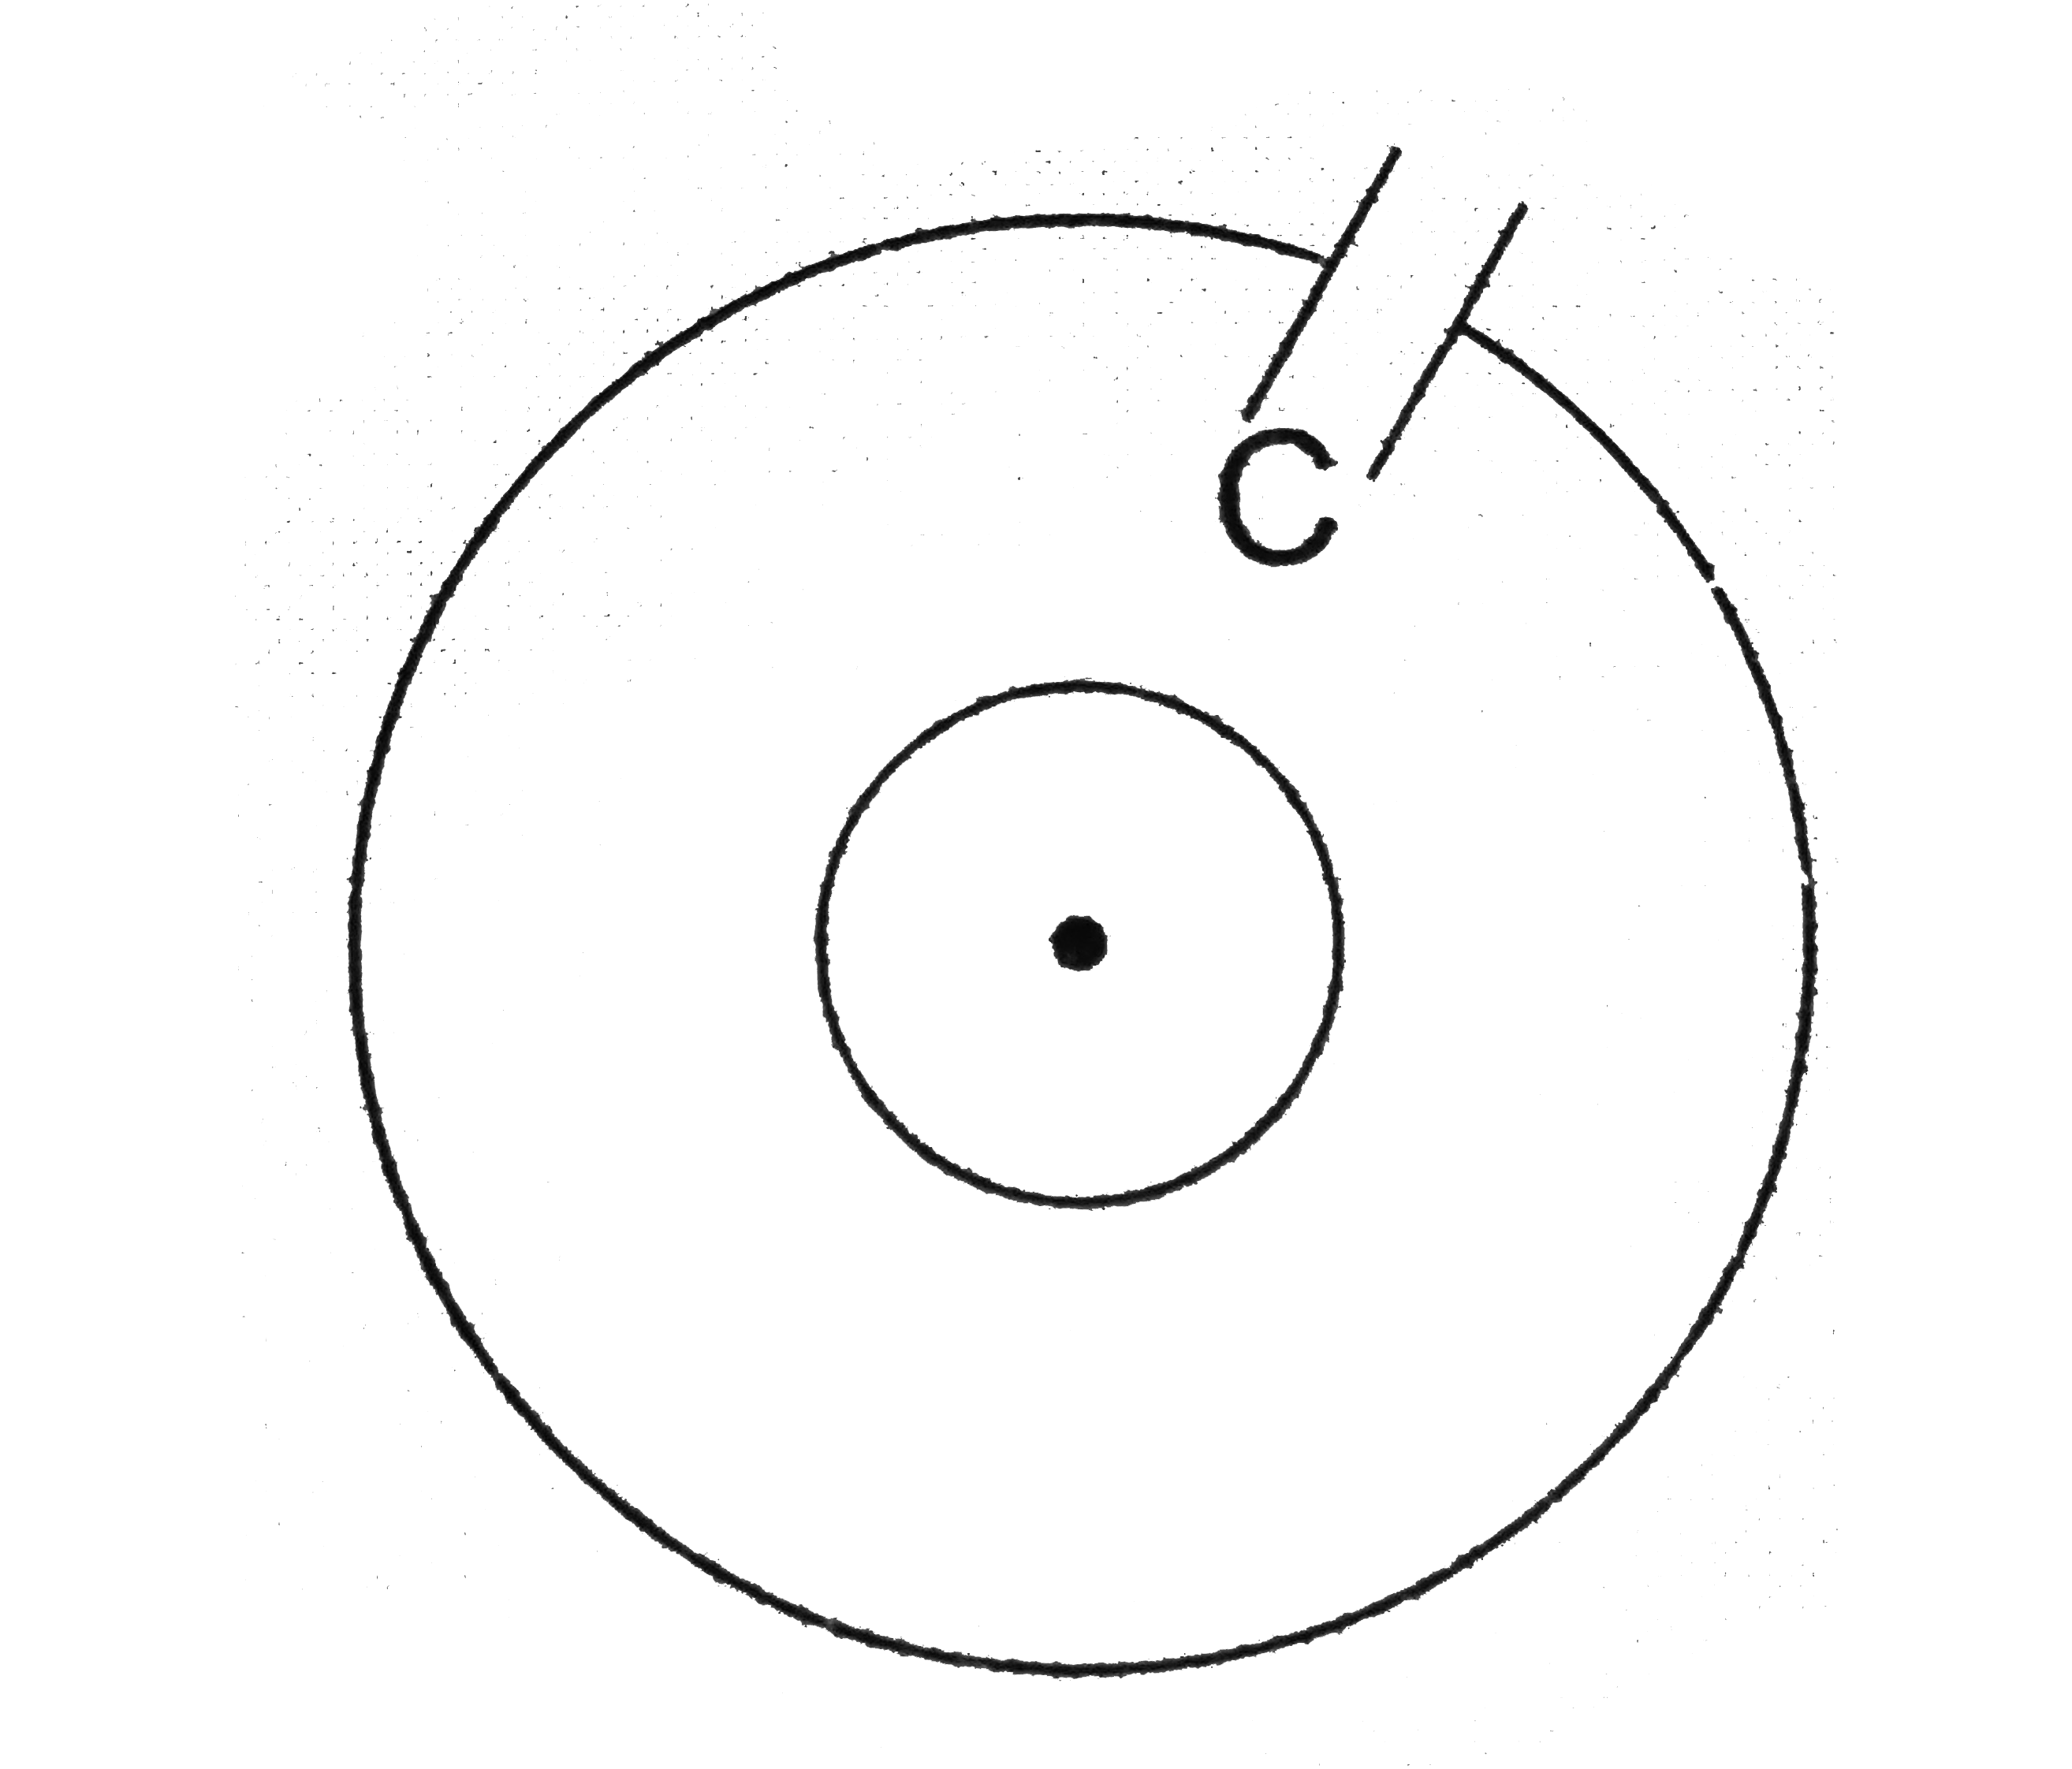
View SolutionThe charge on the capacitor is initially zero. Find the charge on the capacitor as a function of time t. All resistors are of equal value R.
View SolutionA capacitor of capacitance C is given a charge go. At time t=0 it is connected to an uncharged capacitor of equal capacitance through a resistance R. Find the charge on the first capacitor and the second capacitor as a function of time t. Also plot the corresponding q-t graphs.
View Solution

