The figure shows the graph of logarithmic reading of pressure and volume for two ideal gases A and B undergoing adiabatic process. From figure, it can be concluded that
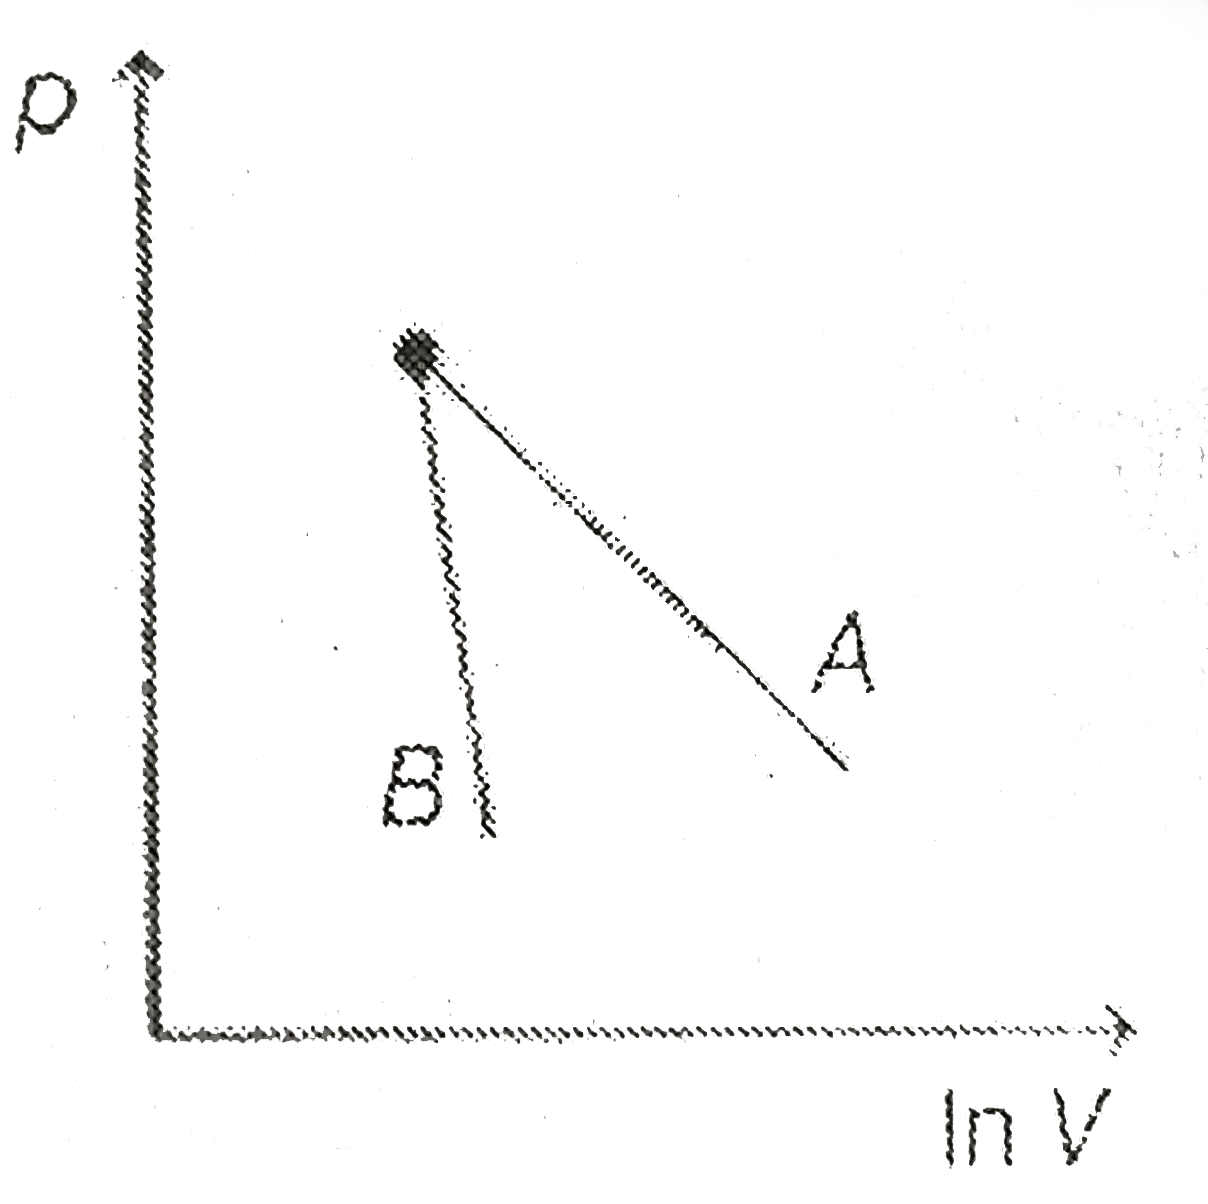
gas B is diatomic
gas A and B both are diatomic
gas A is monoatomic
gas B is monoatomic & gas A is diatomic
The correct Answer is:C
Step by step video, text & image solution for The figure shows the graph of logarithmic reading of pressure and volume for two ideal gases A and B undergoing adiabatic process. From figure, it can be concluded that by Physics experts to help you in doubts & scoring excellent marks in Class 12 exams.
Updated on:21/07/2023Topper's Solved these Questions
- ThermodynamicsBook:MOTIONChapter:ThermodynamicsExercise:EXERCISE - 3 SECTION - A
Explore 49 Videos
- ThermodynamicsBook:MOTIONChapter:ThermodynamicsExercise:EXERCISE - 3 SECTION
Explore 1 Video
- ThermodynamicsBook:MOTIONChapter:ThermodynamicsExercise:EXERCISE - 1
Explore 55 Videos
- SURFACE TENSION & VISCOSITY Book:MOTIONChapter:SURFACE TENSION & VISCOSITY Exercise:Exercise - 4 | Level-II Previous Year | JEE Advanced
Explore 12 Videos
- UNIT & DIMENSIONSBook:MOTIONChapter:UNIT & DIMENSIONSExercise:Exercise - 4 (Level - II) (PREVIOUS YEAR JEE ADVANCED)
Explore 10 Videos
Similar Questions
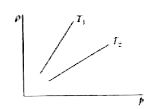
Figure shows graphs of pressure versus density for an ideal gas at two temperatures T1 and T2 Then
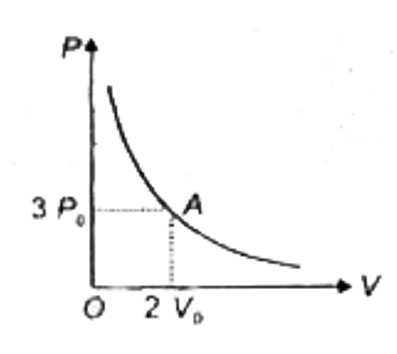
View SolutionThe variation of pressure P with volume V for an ideal monatomic gas during an adiabatic process is shown in figure . At point A the magnitude of rate of change of pressure with volume is
View Solution
Knowledge Check
The figure shows the graph of logarithmic reading of pressure and volume for two ideal gases A and B undergoing adiabatic process. From figure, it can be concluded that
 Agas B is diatomicBgas A and B both are diatomicCgas A is monoatomicDgas B is monoatomic & gas A is diatomic
Logarithms of readings of pressure and volume for an ideal gas were plotted on a graph as shown in Fig. By measuring the gradient, it can be shwon that the gas may be
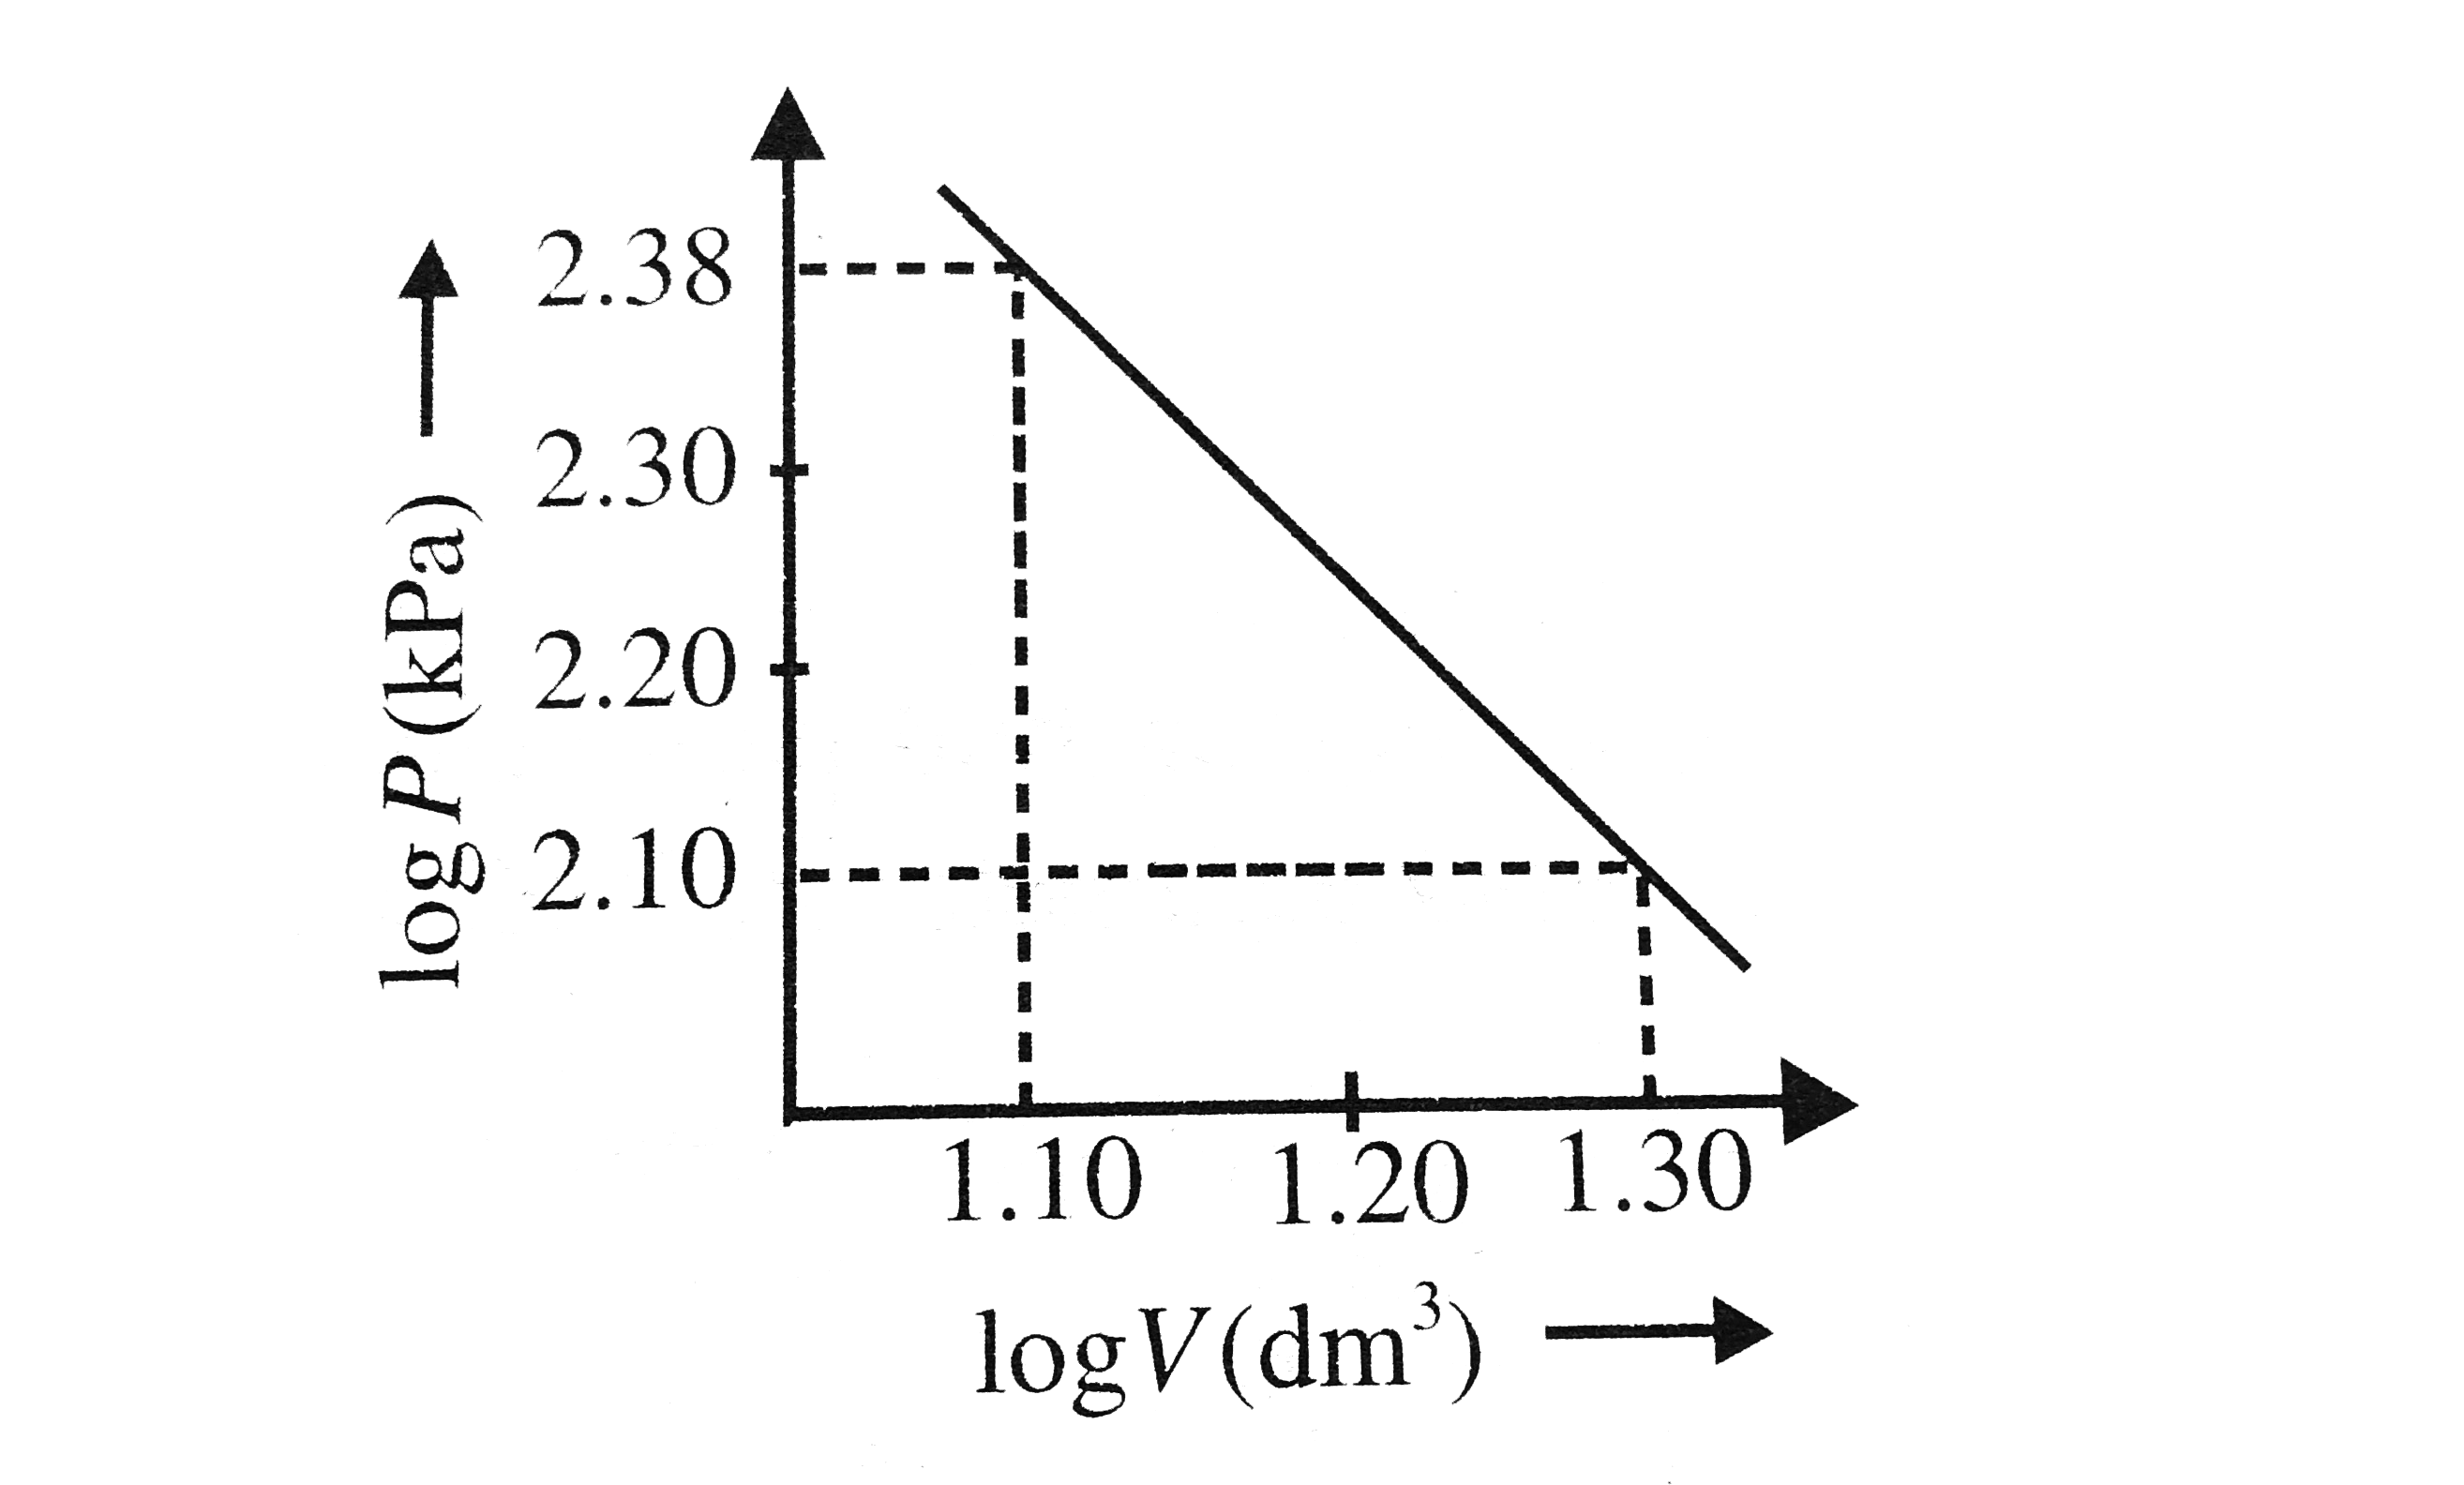 Amonatomic and undergoing an adiabatic changeBmonatomic and undergoing an isothermal changeCdiatomic and undergoing an adiabatic changeDtriatomic and undergoing an isothermal change
Figure shows graphs of pressure vs density for an ideal gas at two temperatures Tt and T2
AT1>T2BT1=T2CT1<T2Dany of the three is possible
P - V plots for two gases, undergoing adiabatic processes are as shown in the figure.
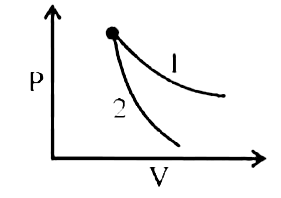
Plots 1 and 2 should correspond respectively to
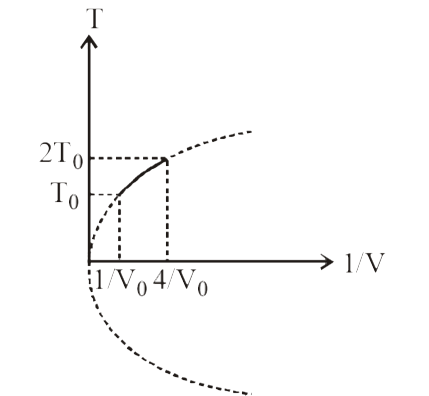
View SolutionFigure shows a parabolic graph between T and 1/V for a mixture of a gases undergoing an adiabatic process. What is the ratio of Vnms of molecules and speed of sound in mixture?
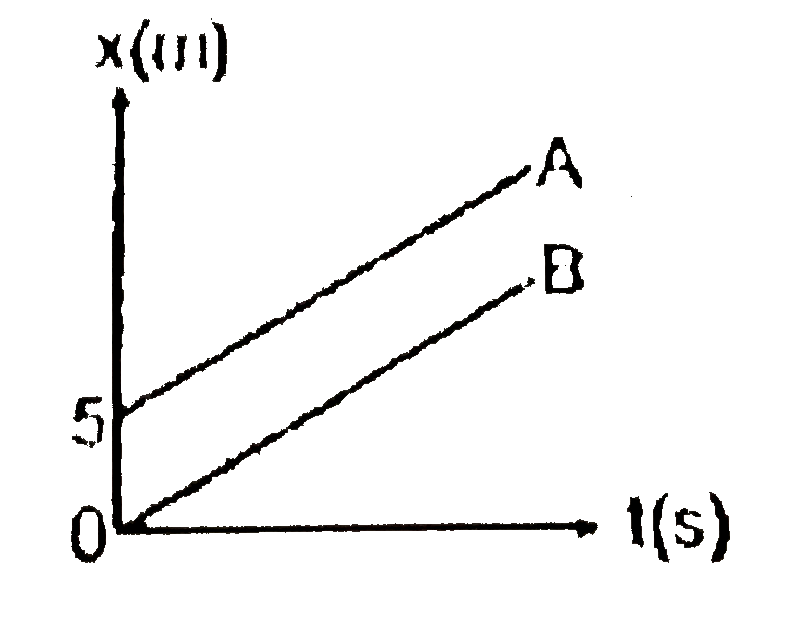
View SolutionFigure shows position-time graph of two cars A and B.
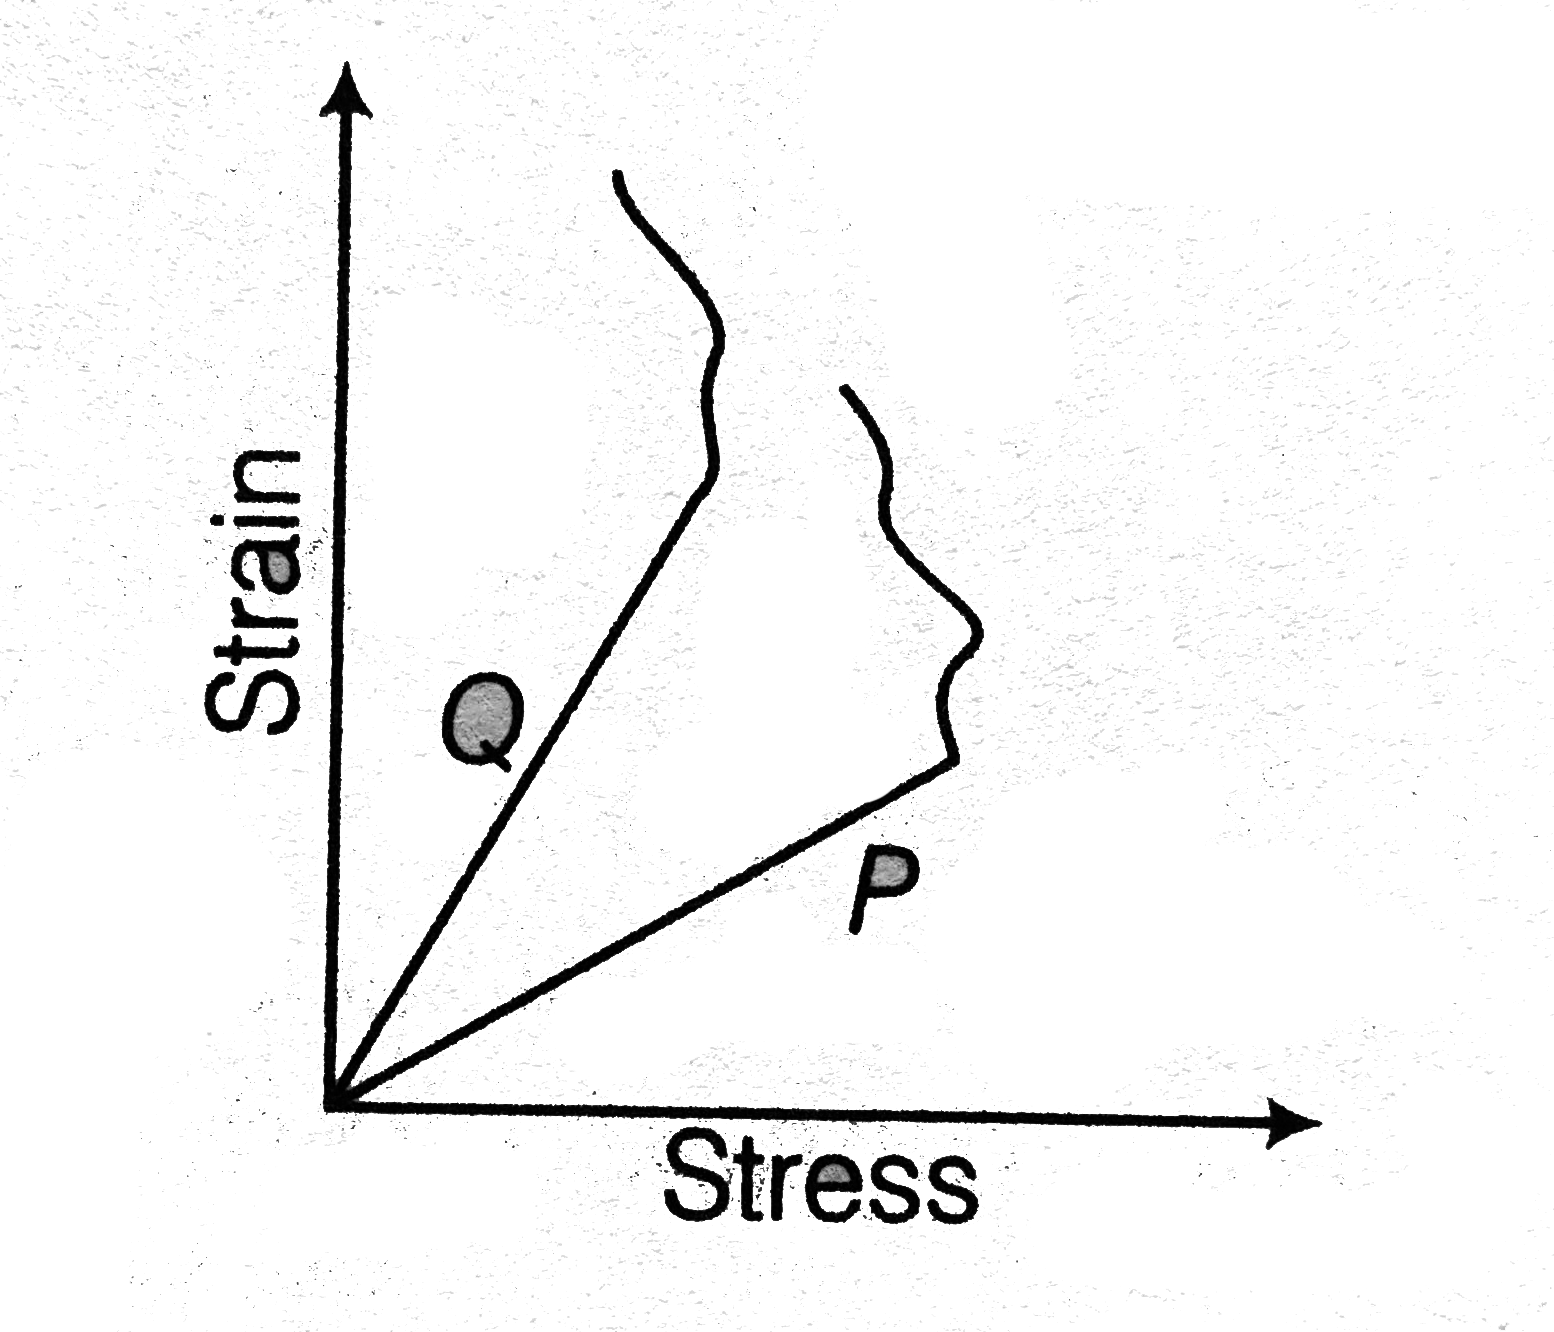
View SolutionFigure shows the stress-strain curve of two metals P and Q. From the graph, it can be concluded that
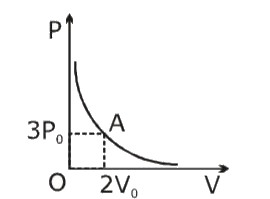
View SolutionThe variation of pressure P with volume V for an ideal monatomic gas during an adiabatic process is hown in figure. At the magnitude of rate of change of pressure with volume is-
View Solution

