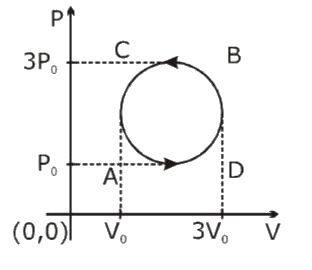
In the figure represent cyclic process. The corresponding PV graph is
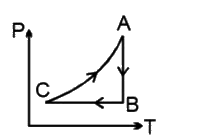
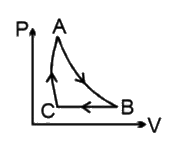
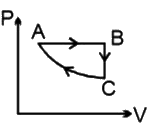
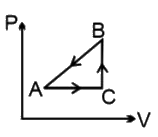
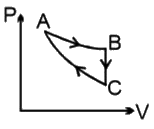
The correct Answer is:A
Step by step video, text & image solution for In the figure represent cyclic process. The corresponding PV graph is by Physics experts to help you in doubts & scoring excellent marks in Class 12 exams.
Updated on:21/07/2023Topper's Solved these Questions
- ThermodynamicsBook:MOTIONChapter:ThermodynamicsExercise:EXERCISE - 3 SECTION - A
Explore 49 Videos
- ThermodynamicsBook:MOTIONChapter:ThermodynamicsExercise:EXERCISE - 3 SECTION
Explore 1 Video
- ThermodynamicsBook:MOTIONChapter:ThermodynamicsExercise:EXERCISE - 1
Explore 55 Videos
- SURFACE TENSION & VISCOSITY Book:MOTIONChapter:SURFACE TENSION & VISCOSITY Exercise:Exercise - 4 | Level-II Previous Year | JEE Advanced
Explore 12 Videos
- UNIT & DIMENSIONSBook:MOTIONChapter:UNIT & DIMENSIONSExercise:Exercise - 4 (Level - II) (PREVIOUS YEAR JEE ADVANCED)
Explore 10 Videos
Similar Questions
Which of the following is an equivalent cyclic process corresponding to the thermodynamic cycle given in the figure? Where, 1→2 is adiabatic. (Graphs are schematic and are not to scale)
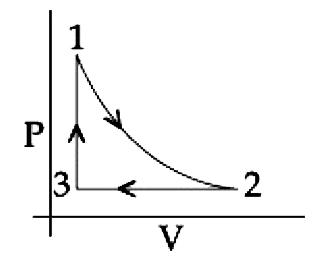
View SolutionWhich of the followingis an equivalent cyclic process corresponding to the thermodynamics cycl give in the figure ? Where1→2 is adiabatic
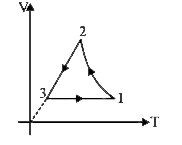
View Solution
Knowledge Check
The PT diagram for an ideal gas is shown in the figure, where AC is an adiabatic process, find the corresponding PV diagram.
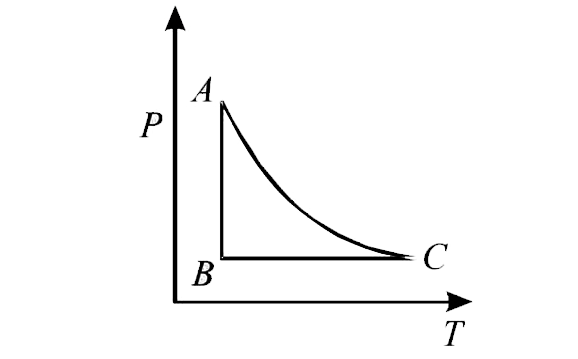 A
A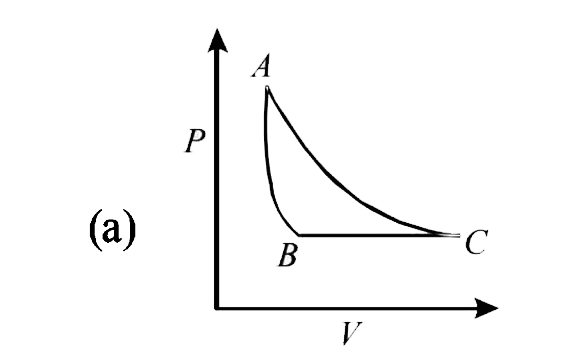 B
B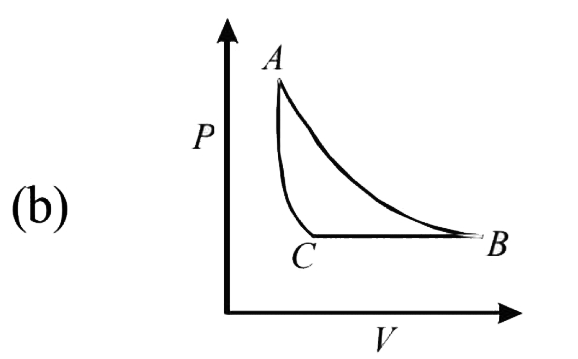 C
C D
D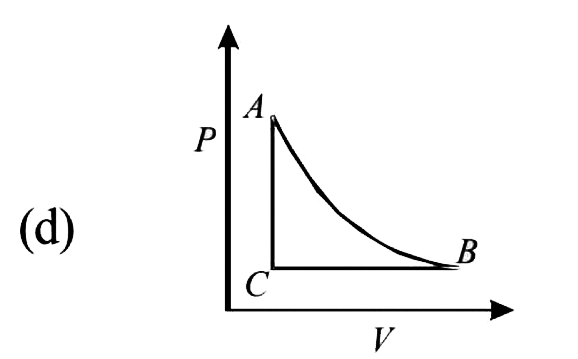
An ideal gas undergoes the cyclic process shown in a graph below :
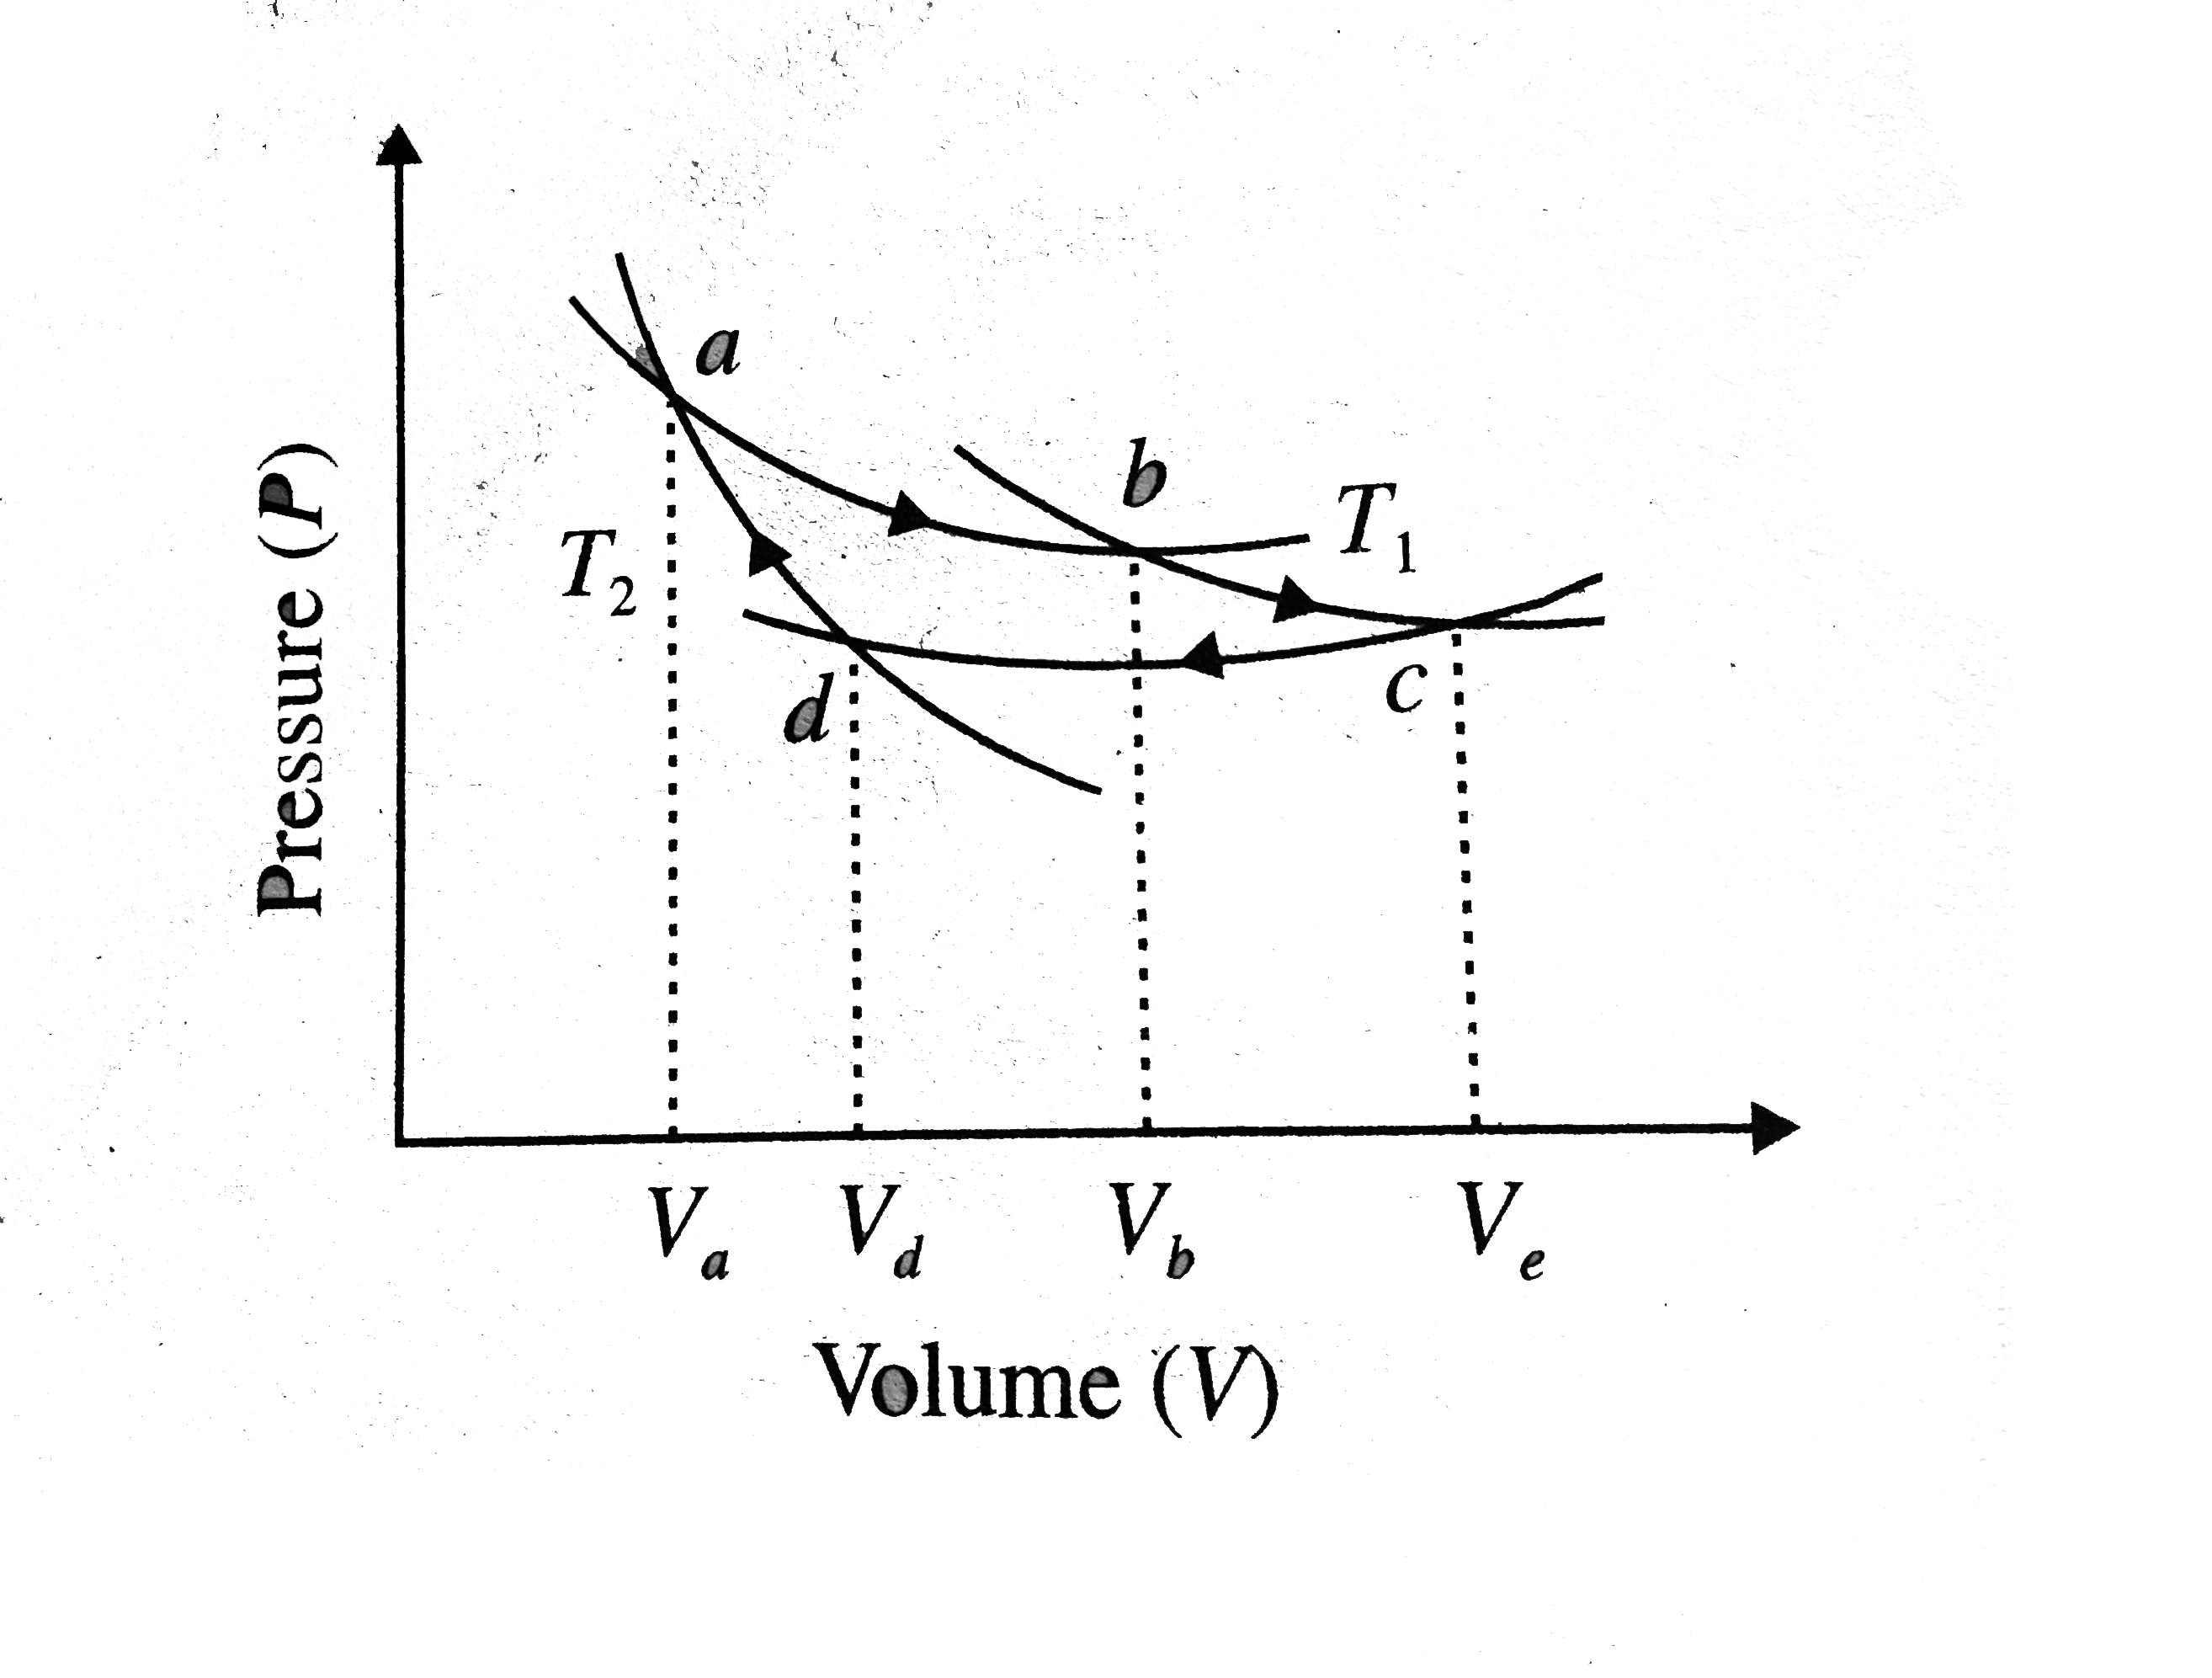 AT1=T2BT1>T2CVaVc=VbVdDVaVb=VcVd
A thermodynamic process is shown in the figure. The pressure and volumes corresponding to some points in the figure are
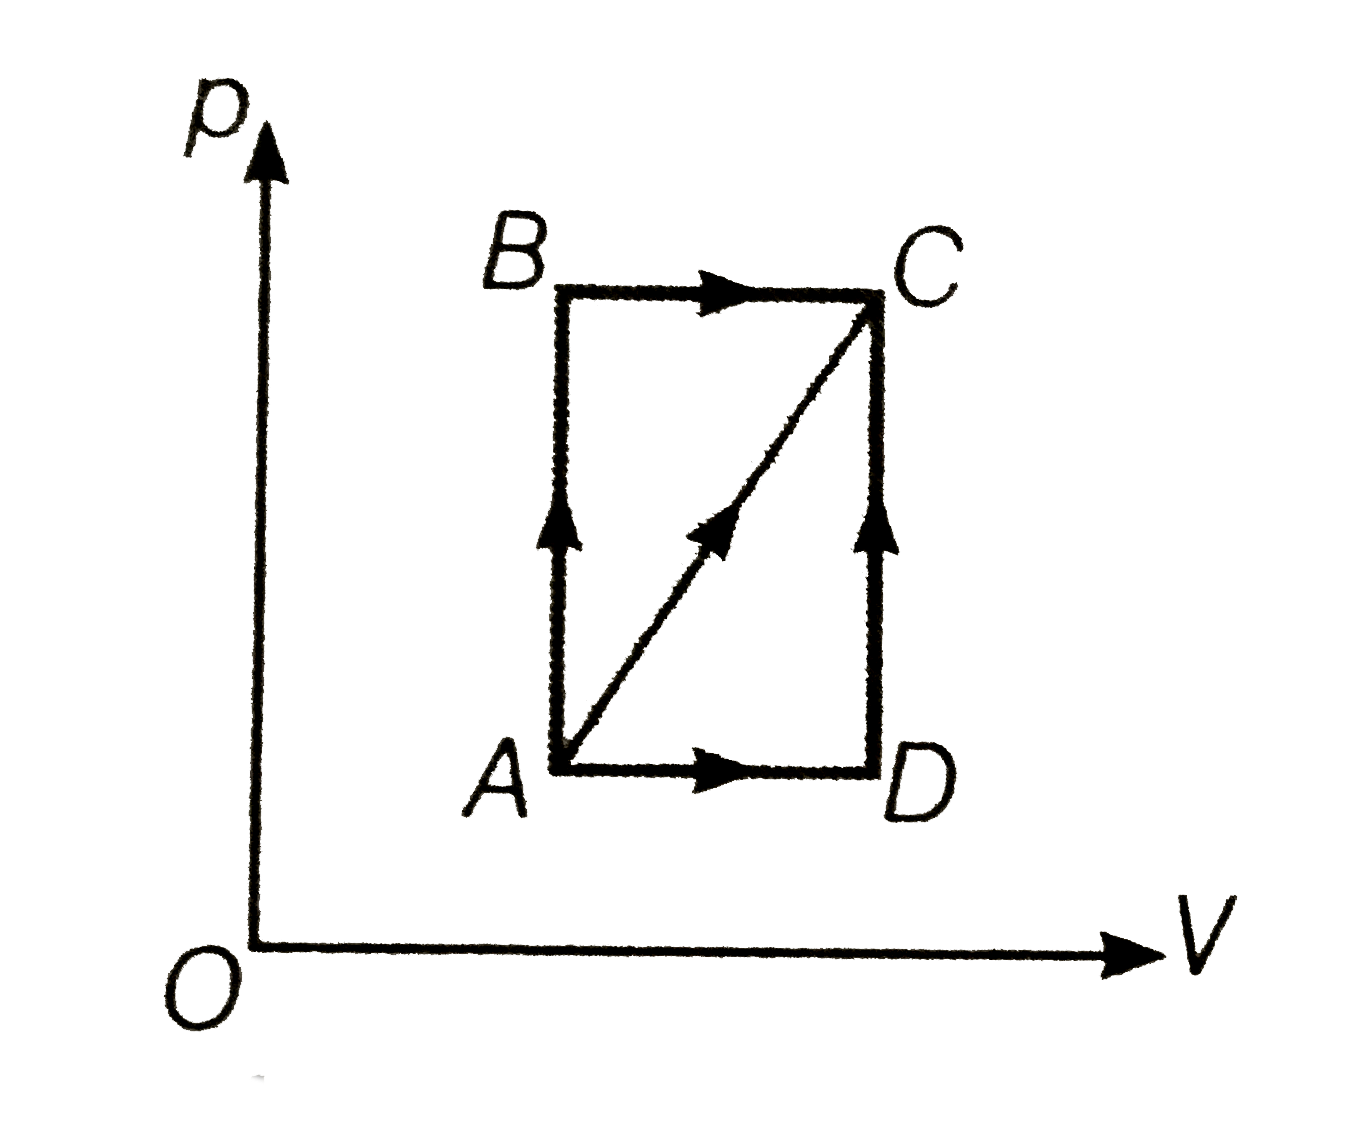 APA=3×10⁴ pa,BVA=2×10⁻³m3CPB=8×10⁴pa,DVB=5×10⁻³m3
Work done in the cyclic process shown in figure is :-

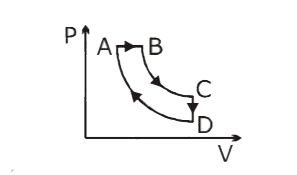
View SolutionFor P-V diagram of a thermodynamic cycle as shown in figure, process BC and DA are isothermal. Which of the corresponding graphs is correct?
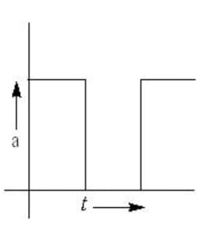
View SolutionFigure shows the acceleration-time graphs of a particle. Which of the following represents the corresponding velocity -time graph?
View SolutionThe graph below shws the velocity versus time graph for a body
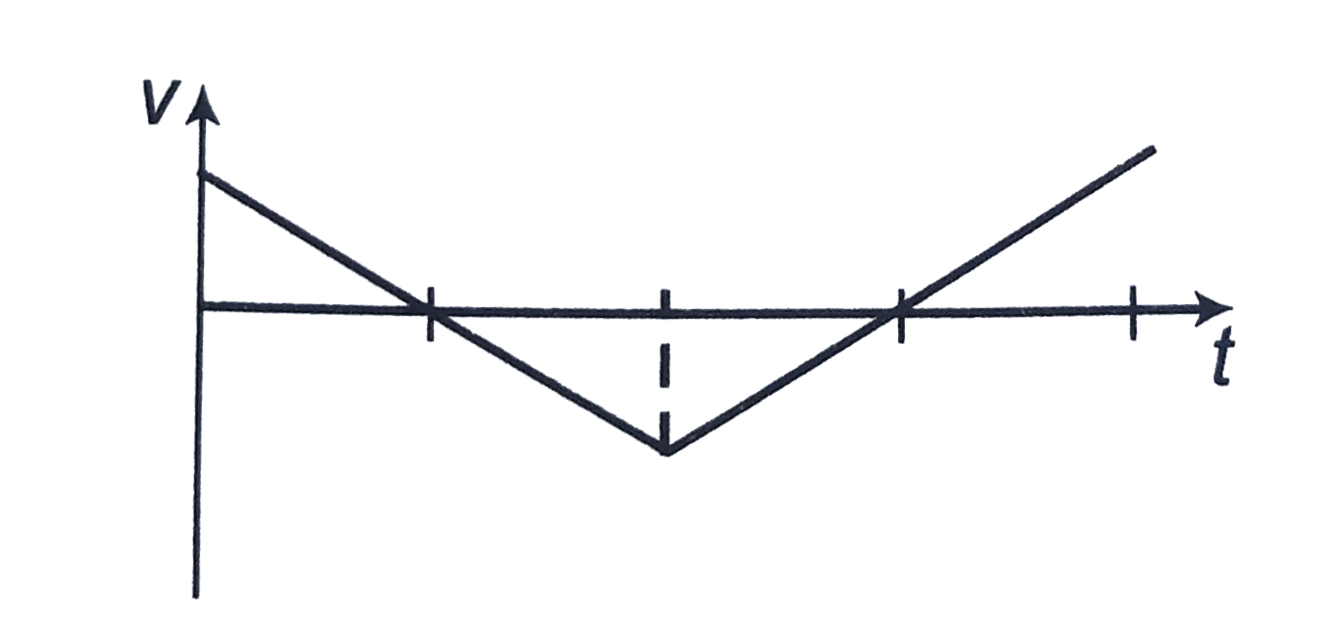
Which of the following graph represents the corresponding acceleration v//s time graph?
View SolutionWork done in the cyclic process shown in figure is-
View Solution

