Taking 0.5 cm as 1 unit, plot the following points on the graph paper A(1,3), B(-3,-1),C(1,-4),D(-2,3). E(0,-8) and F(1,0).
To plot the points A(1,3), B(-3,-1), C(1,-4), D(-2,3), E(0,-8), and F(1,0) on graph paper where 0.5 cm represents 1 unit, follow these steps:
1. Set Up the Axes:
- Draw the x-axis (horizontal) and the y-axis (vertical) on your graph paper.
- Mark the origin (0,0) where the two axes intersect.
2. Label the Axes:
- On the x-axis, mark units to the right as positive (1, 2, 3, 4, etc.) and to the left as negative (-1, -2, -3, -4, etc.).
- On the y-axis, mark units upwards as positive (1, 2, 3, 4, etc.) and downwards as negative (-1, -2, -3, -4, etc.).
3. Plot Point A(1,3):
- From the origin (0,0), move 1 unit to the right (x = 1).
- Then move 3 units up (y = 3).
- Mark the point A at (1,3).
4. Plot Point B(-3,-1):
- From the origin, move 3 units to the left (x = -3).
- Then move 1 unit down (y = -1).
- Mark the point B at (-3,-1).
5. Plot Point C(1,-4):
- From the origin, move 1 unit to the right (x = 1).
- Then move 4 units down (y = -4).
- Mark the point C at (1,-4).
6. Plot Point D(-2,3):
- From the origin, move 2 units to the left (x = -2).
- Then move 3 units up (y = 3).
- Mark the point D at (-2,3).
7. Plot Point E(0,-8):
- From the origin, stay at x = 0.
- Move 8 units down (y = -8).
- Mark the point E at (0,-8).
8. Plot Point F(1,0):
- From the origin, move 1 unit to the right (x = 1).
- Stay at y = 0.
- Mark the point F at (1,0).
Final Check:
- Ensure all points are accurately plotted according to their coordinates.
- Draw the x-axis (horizontal) and the y-axis (vertical) on your graph paper.
- Mark the origin (0,0) where the two axes intersect.
- On the x-axis, mark units to the right as positive (1, 2, 3, 4, etc.) and to the left as negative (-1, -2, -3, -4, etc.).
- On the y-axis, mark units upwards as positive (1, 2, 3, 4, etc.) and downwards as negative (-1, -2, -3, -4, etc.).
- From the origin (0,0), move 1 unit to the right (x = 1).
- Then move 3 units up (y = 3).
- Mark the point A at (1,3).
- From the origin, move 3 units to the left (x = -3).
- Then move 1 unit down (y = -1).
- Mark the point B at (-3,-1).
- From the origin, move 1 unit to the right (x = 1).
- Then move 4 units down (y = -4).
- Mark the point C at (1,-4).
- From the origin, move 2 units to the left (x = -2).
- Then move 3 units up (y = 3).
- Mark the point D at (-2,3).
- From the origin, stay at x = 0.
- Move 8 units down (y = -8).
- Mark the point E at (0,-8).
- From the origin, move 1 unit to the right (x = 1).
- Stay at y = 0.
- Mark the point F at (1,0).
- Ensure all points are accurately plotted according to their coordinates.
Topper's Solved these Questions
Similar Questions
Plot the following points on the co-ordinate plane:
A(3,5),B(2,−4),C(−2,7),D(−3,−4),E(0,−5)andF(5,0)
View SolutionPlot the points on a graph paper.
A(3,6),B(−3,6),C(6,−3),D(−3,−6),E(0,−6),F(−6,0),G(−6,−6).
View SolutionPlot the points A(4,1),B(−3,2),C(2,−3),D(−4,1),E(−4,−4).
View SolutionWhich of the following point lies on Y-axis ? A(1,1),B(1,0),C(0,1),D(0,0),E(0,−1),G(0,5),H(−7,0) and I(3,3)
View SolutionDetermine whether the following points are collinear
D(−2,−3),E(1,0),F(2,1)
View Solution-Graph the points with the following coordinates. (1,2),(−1,3),(−2,−4),(3,−2),(2,0),(0,3)
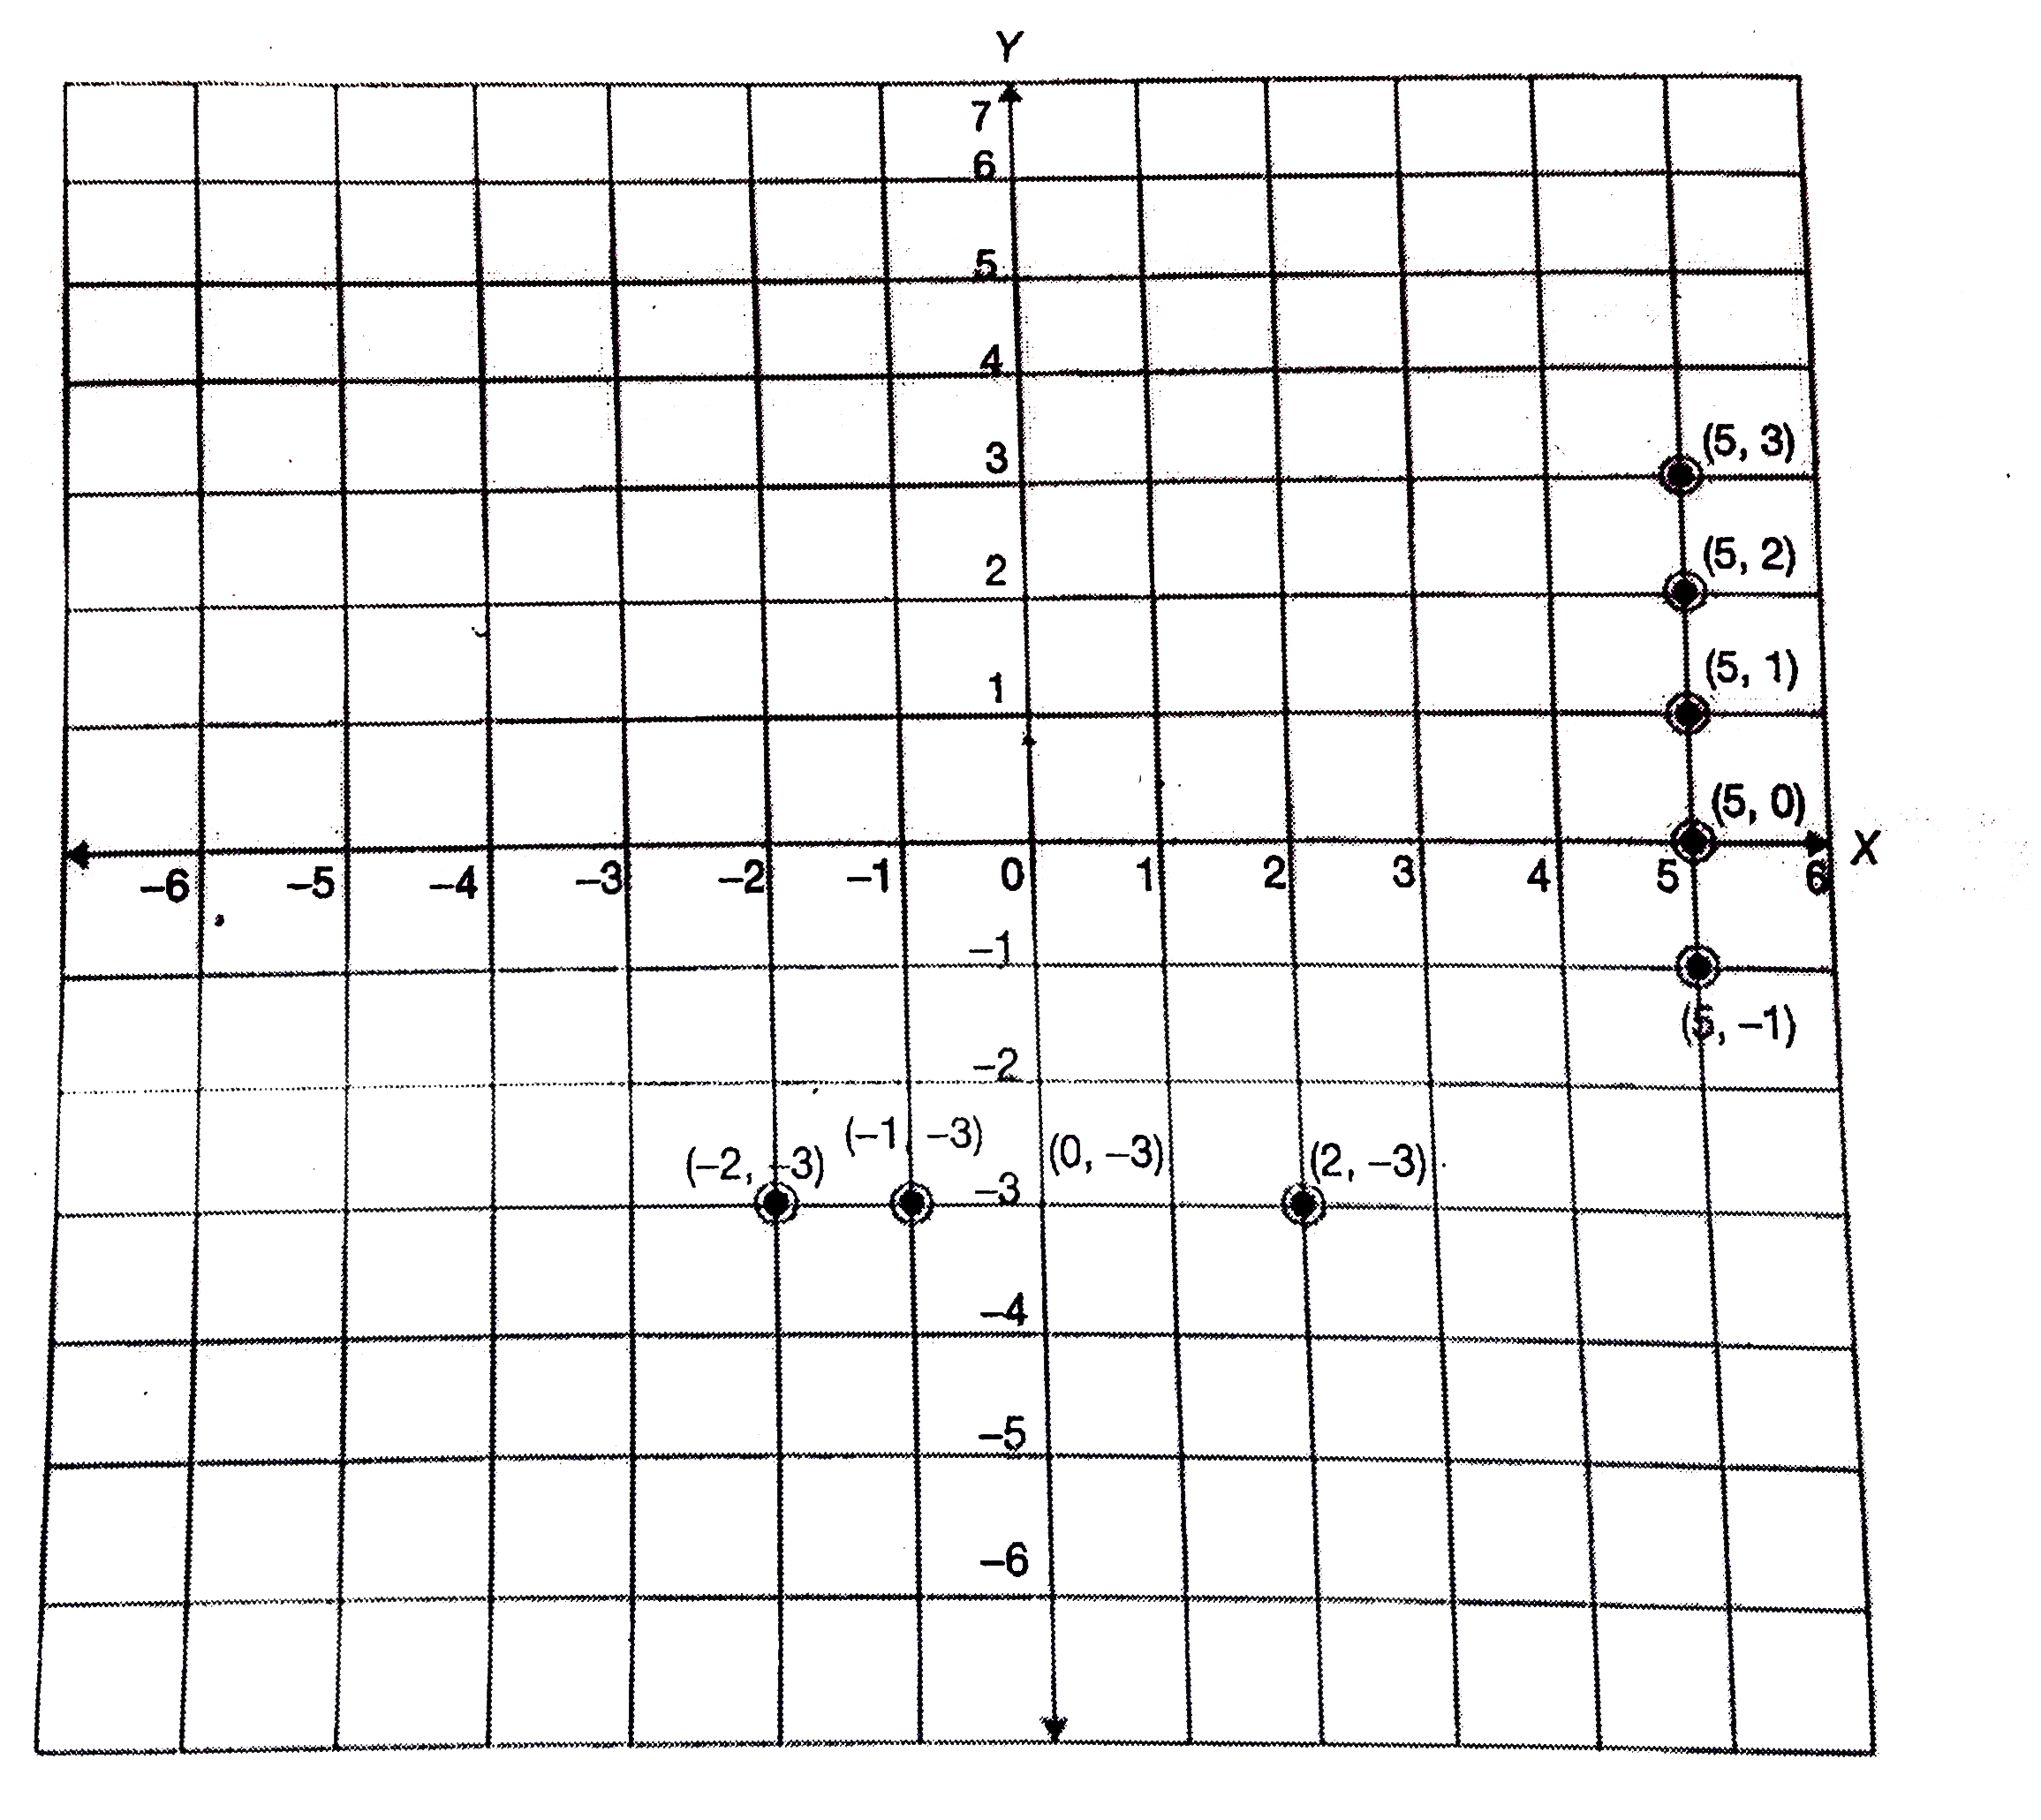
View SolutionPlot the following points on the coordinate plane. What do you observe ?
(a) (−2,−3),(−1,−3),(0,−3),(2,−3)
(b) (5,3),(5,2),(5,1),(5,0),(5,−1)

View SolutionPlot the given points on a graph sheet.
(i) (5,4)
(ii) (2,0)
(iii) (3,1)
(iv) (0,4)
(v) (4,5)
View SolutionBy plotting the following points check whether they are collinear or not
(i) (1,1),(2,2),(4,4)
(ii) (1,0),(−3,0),(0,0)
(iii) (2,−2),(0,0),(−3,4)
View SolutionWhich of the following points lie on the x-axis ?
(i) A(0, 8) (ii) B(4, 0) (iii) C(0,−3) (iv) D(−6,0)
(v) E(2, 1) (vi) F(−2,−1) (vii) G(−1,0) (viii) H(0,−2)
View Solution
