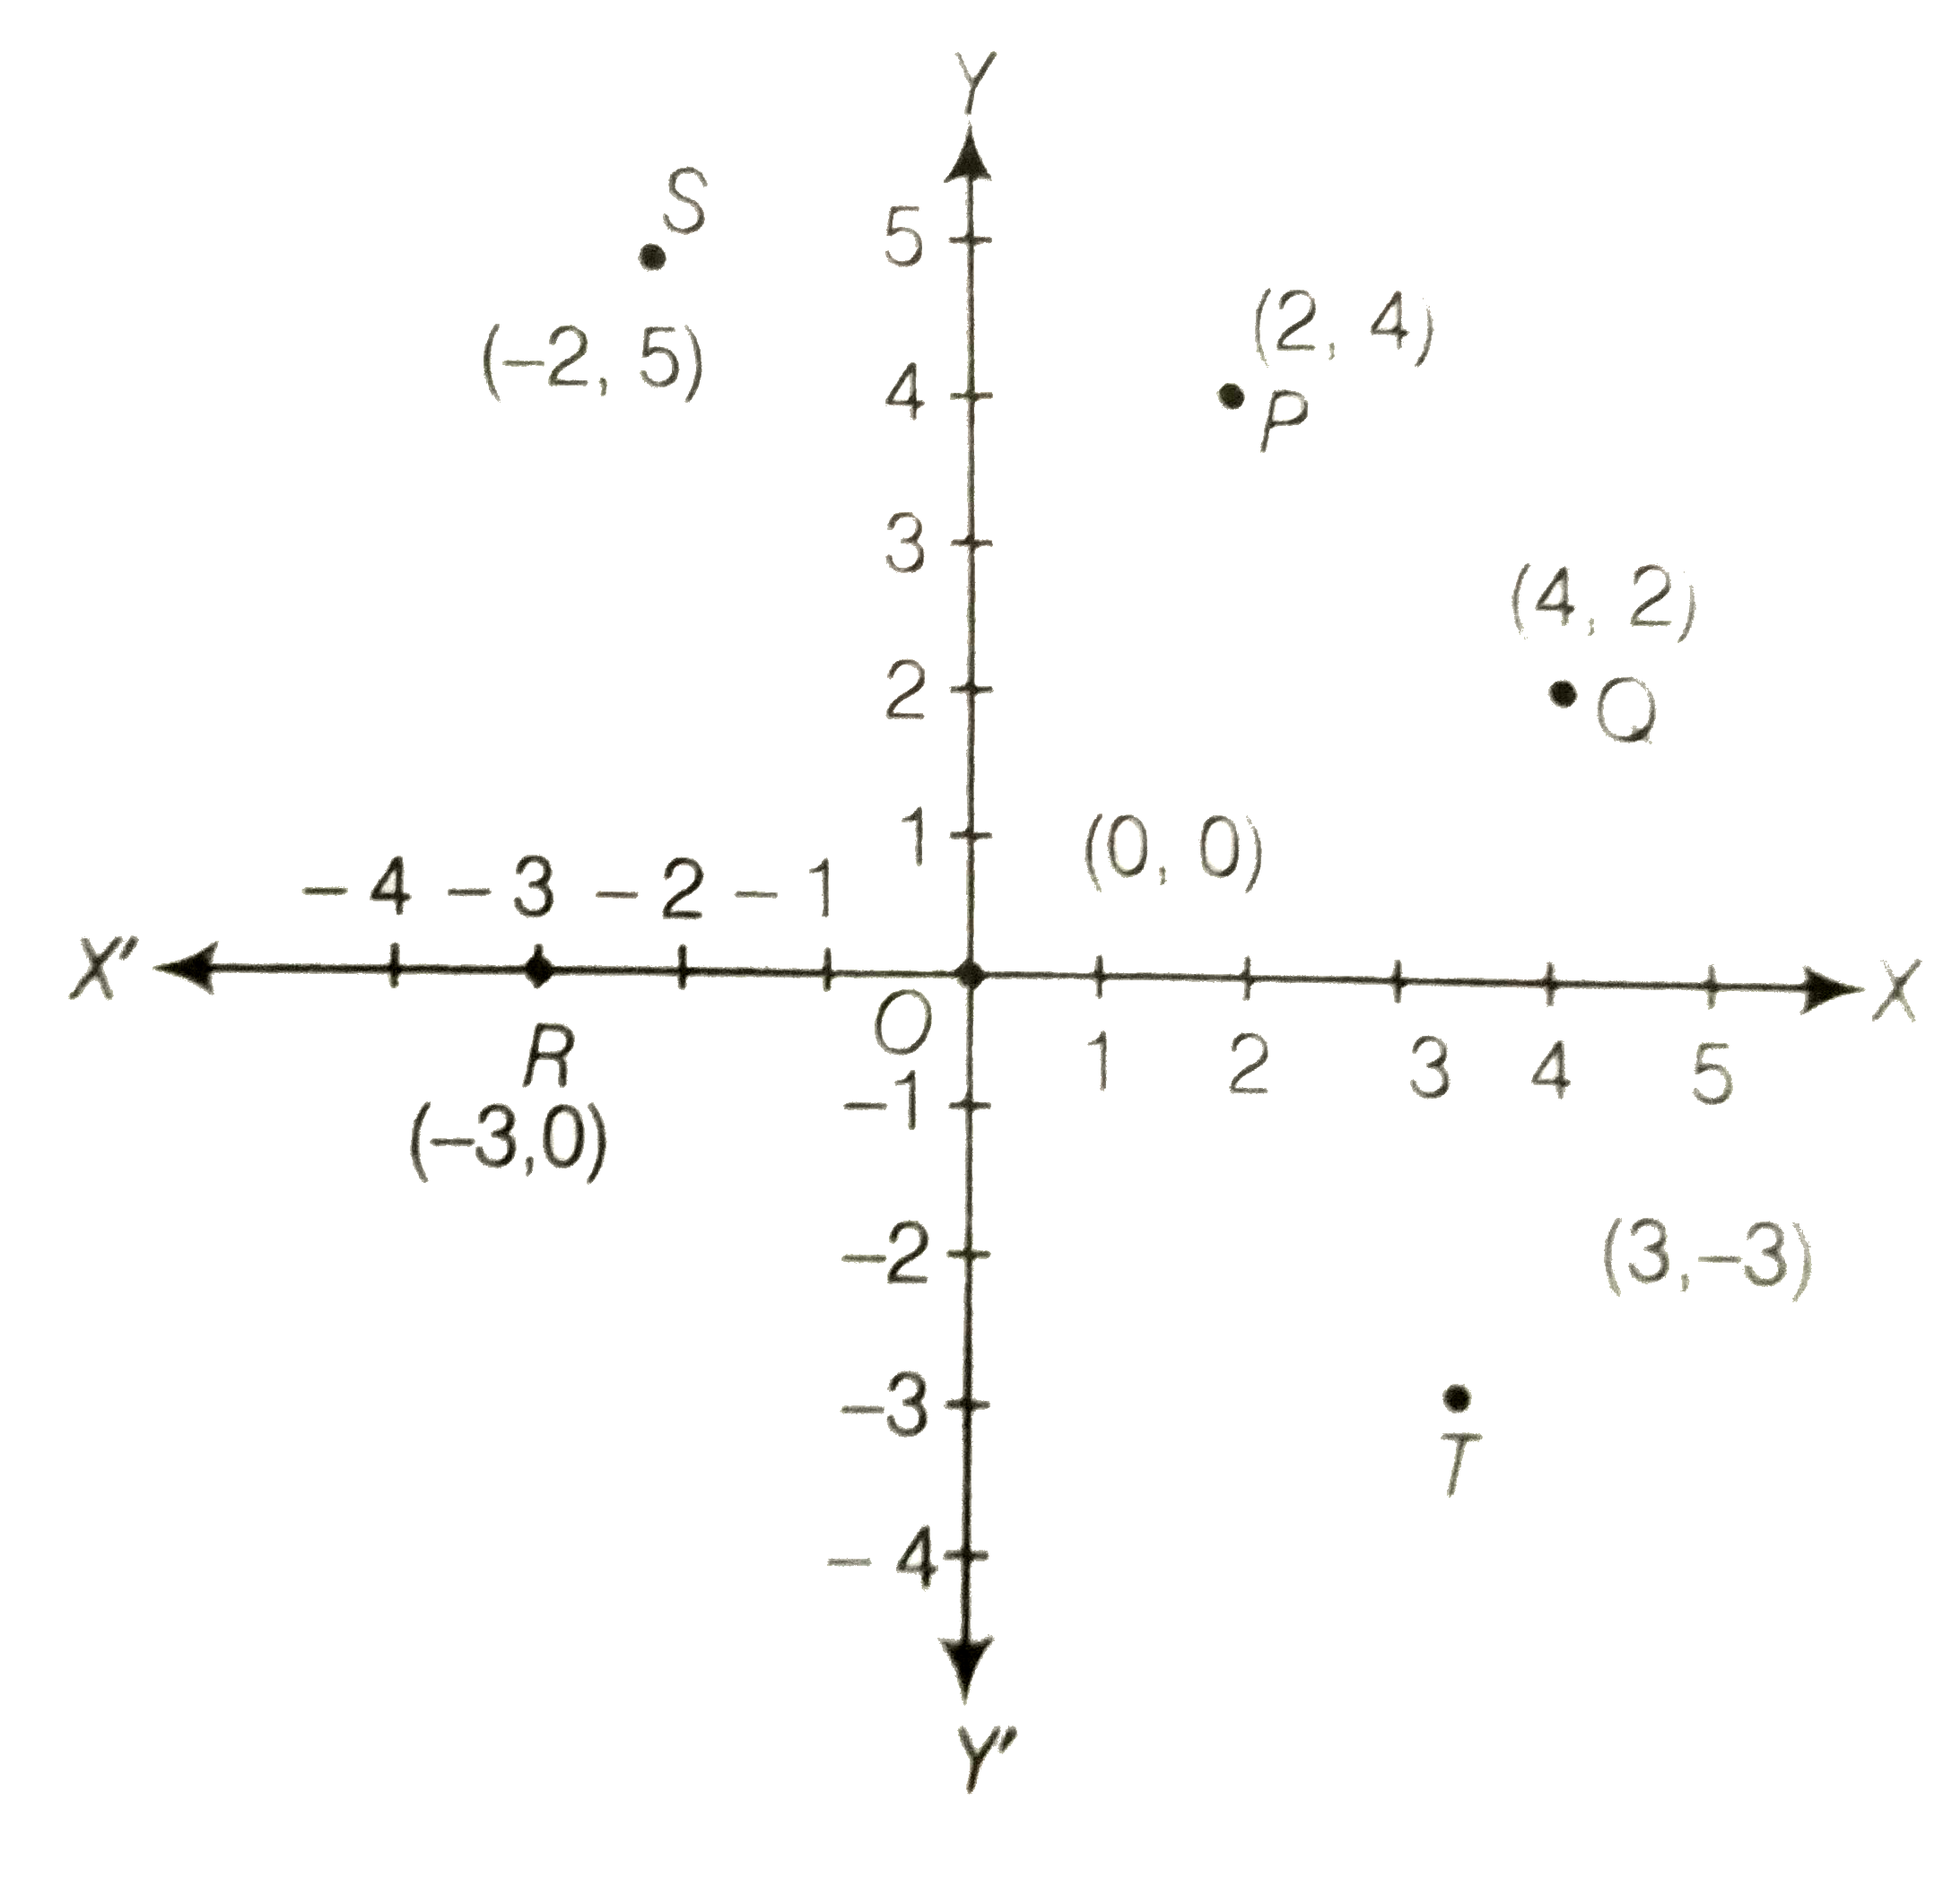
Plot the points (x,y) given by the following table.
x24−3−2 30y42 0 5−30
Video Solution
Text Solution
On plotting the given points on the graphs , we get the points P(2,4), Q(4,2), R(-3,0), S(-2,5), T(3,-3) and O(0,0).

|
Topper's Solved these Questions
Similar Questions
Knowledge Check
If point (x,y) satisfy the relation x2+4y2−4x+3=0 then
Ax∈[1,3],y∈[−13,13]Bx∈[1,3],y∈[1,3]Cx∈[1,3],y∈[−12,12]Dx∈[−2,2],y∈[−1,1]The point of intersection of the lines represented by (x−3)2+(x−3)(y−4)−2(y−4)2=0 is
A(4,3)B(−4,−3)C(3,4)D(−3,−4)
The lines x−y−2=0,x+y−4=0,x+3y=6 meet at the point
View SolutionFind the image of the point (0,2,3) in the line x+35=y−12=z+43.
View SolutionFind the point of intersection of the straight lines :
(i)2x+3y−6=0, 3x−2y−6=0
(ii)x=0, 2x−y+3=0
(iii)x3−y4=0, x2+y3=1
View SolutionIn the following cases, find the distance of each of the given points from the corresponding given plane. Point Plane
(a) (0,0,0) , 3x+4y+12z=3
(b) (3,2,1) , 2x+y+2z+3=0
(c) (2,3,−5) , x+2y±2z=9
(d) (6,0,0) , 2x−3y+6z−2=0
View SolutionSolve the following equations :
0.2x+0.3y=1.3
0.4x+0.5y=2.3
View SolutionSolve the following using determinates :
2x + 5y - 20 = 0
3x + 4y - 25 = 0
View Solution