The observation of the species-area relationship was given by Humboldt after his pioneering and extensive ex-plorations in the wilderness of
South American jungles
Noth American jungles
South African jungles
East African jungles
The correct Answer is:A
Step by step video & text solution for The observation of the species-area relationship was given by Humboldt after his pioneering and extensive ex-plorations in the wilderness of by Biology experts to help you in doubts & scoring excellent marks in Class 12 exams.
Updated on:21/07/2023Similar Questions
Knowledge Check
The hyperbolic equation for the species area relationship is
ALogC=logS+SlogABLogS=logC+ZlogACLogS=logA+ZlogCDS=CAzAccording to the concept of species-area relationship.
AThe number of species in an area increase with the size of the area.BThe value of Z lies in the range of 0.3 to 0.4, regardless of the taxonomic group or the region.CThe relationship is for a rectangular hyperbola curve is described by the equation logS=logC+ZlogA.DThe larger the area the greater the extinction rate.In the equation of the species - area relationship , the letter 'C' and 'Z' represent:
AC = Regression coefficient , Z = Y - interceptBC = Slope of the line, Z = Regression coefficientCC = Y - intercept , Z = Slope of the line (regression coefficient)DBoth (B) and (C)
The species-area relationships among very large areas like entire continents
View SolutionIn the equation of species-area relationship, the letter 'C' and 'Z' represent
View SolutionA species restricted to a given area is
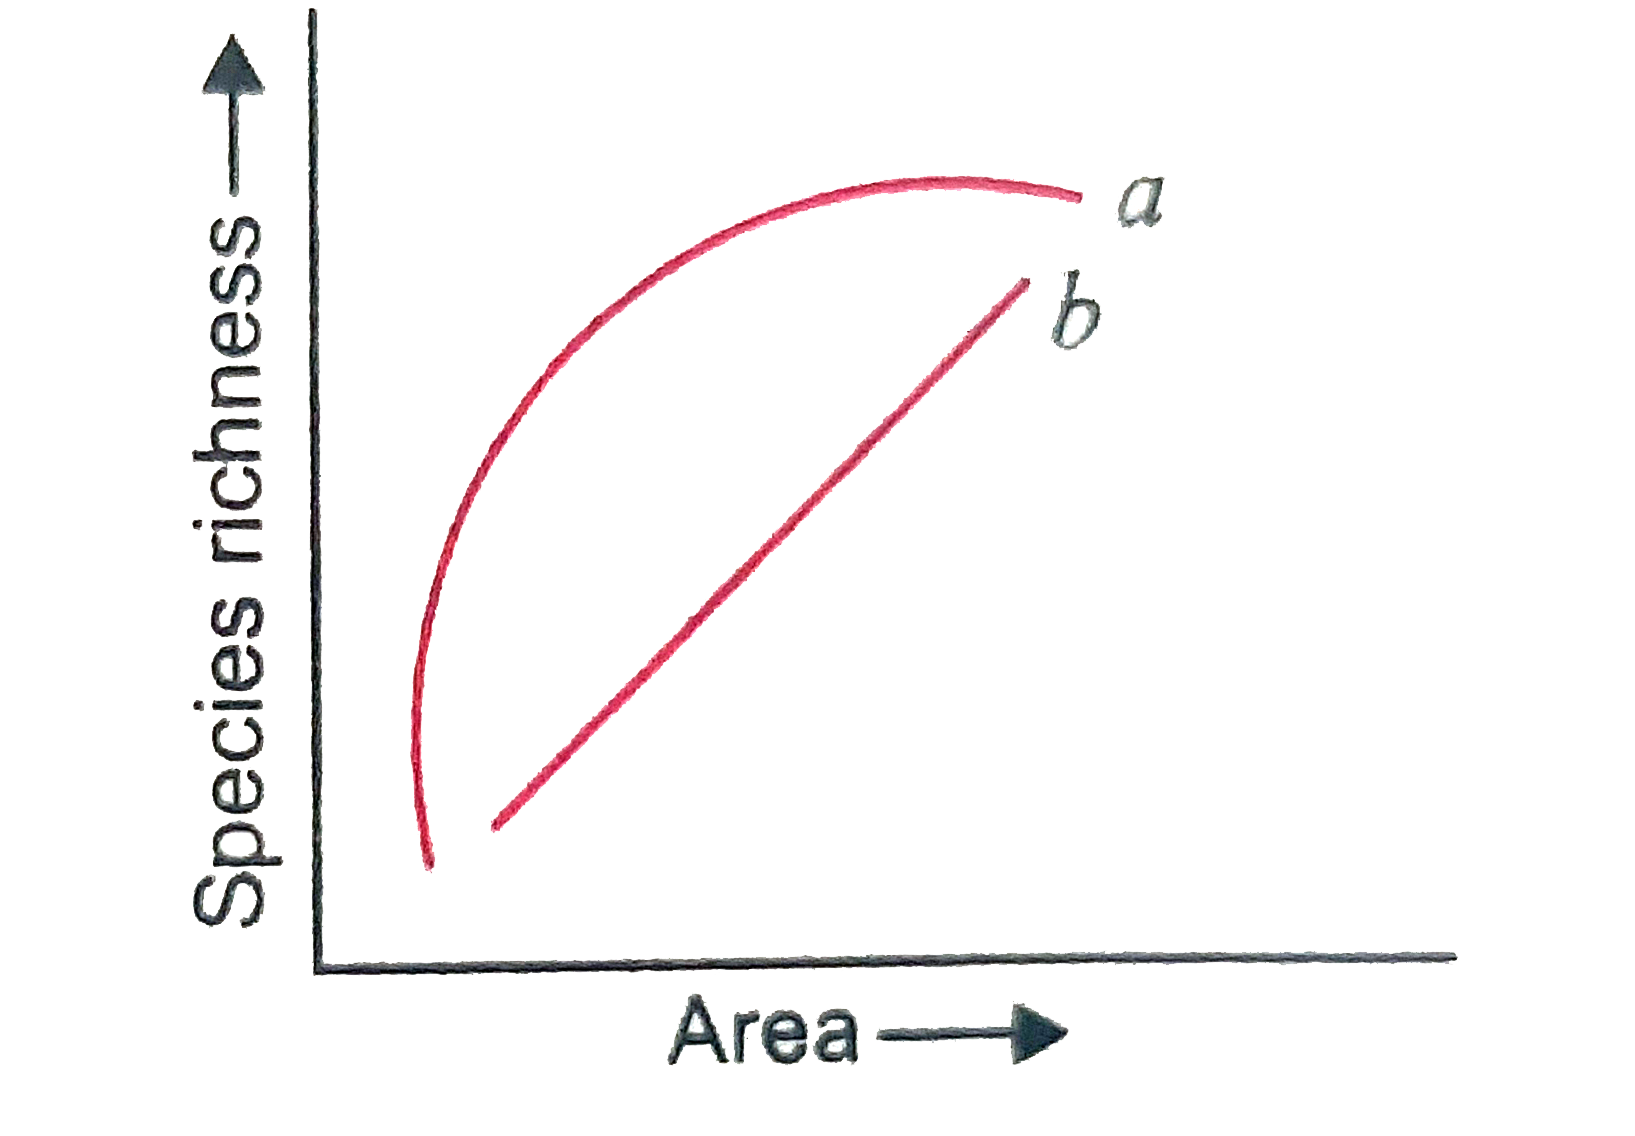
View SolutionIn the polt of the species - area relationship for the co-efficient z, the axis X and Y, represents
View SolutionAssertion : If the species-area relationship are analysed among very large areas like the entire continents, the value of Z, i.e., slope of line in the range of 0.1 to 0.2.
Reason : The value of Z, i.e., slope of line of species area relationship lies in the range of 0.6 to 1.2 when analysis is done among small areas.
View Solution


