Whenever a>0 , which of the following number line graphs represents the solutions for x to the inequality |x−a|≤3 ?
A

B

C

D

Video Solution
Text Solution
The correct Answer is:D
|
Answer
Step by step video, text & image solution for Whenever a gt 0 , which of the following number line graphs represents the solutions for x to the inequality |x-a| le 3 ? by Maths experts to help you in doubts & scoring excellent marks in Class 12 exams.
Updated on:21/07/2023Topper's Solved these Questions
Similar Questions
Knowledge Check
Which of the following inequalities represents the graph shown below on the real number line ?
 A0<x<5B0<x≤4C−2<x≤4D1≤x≤4
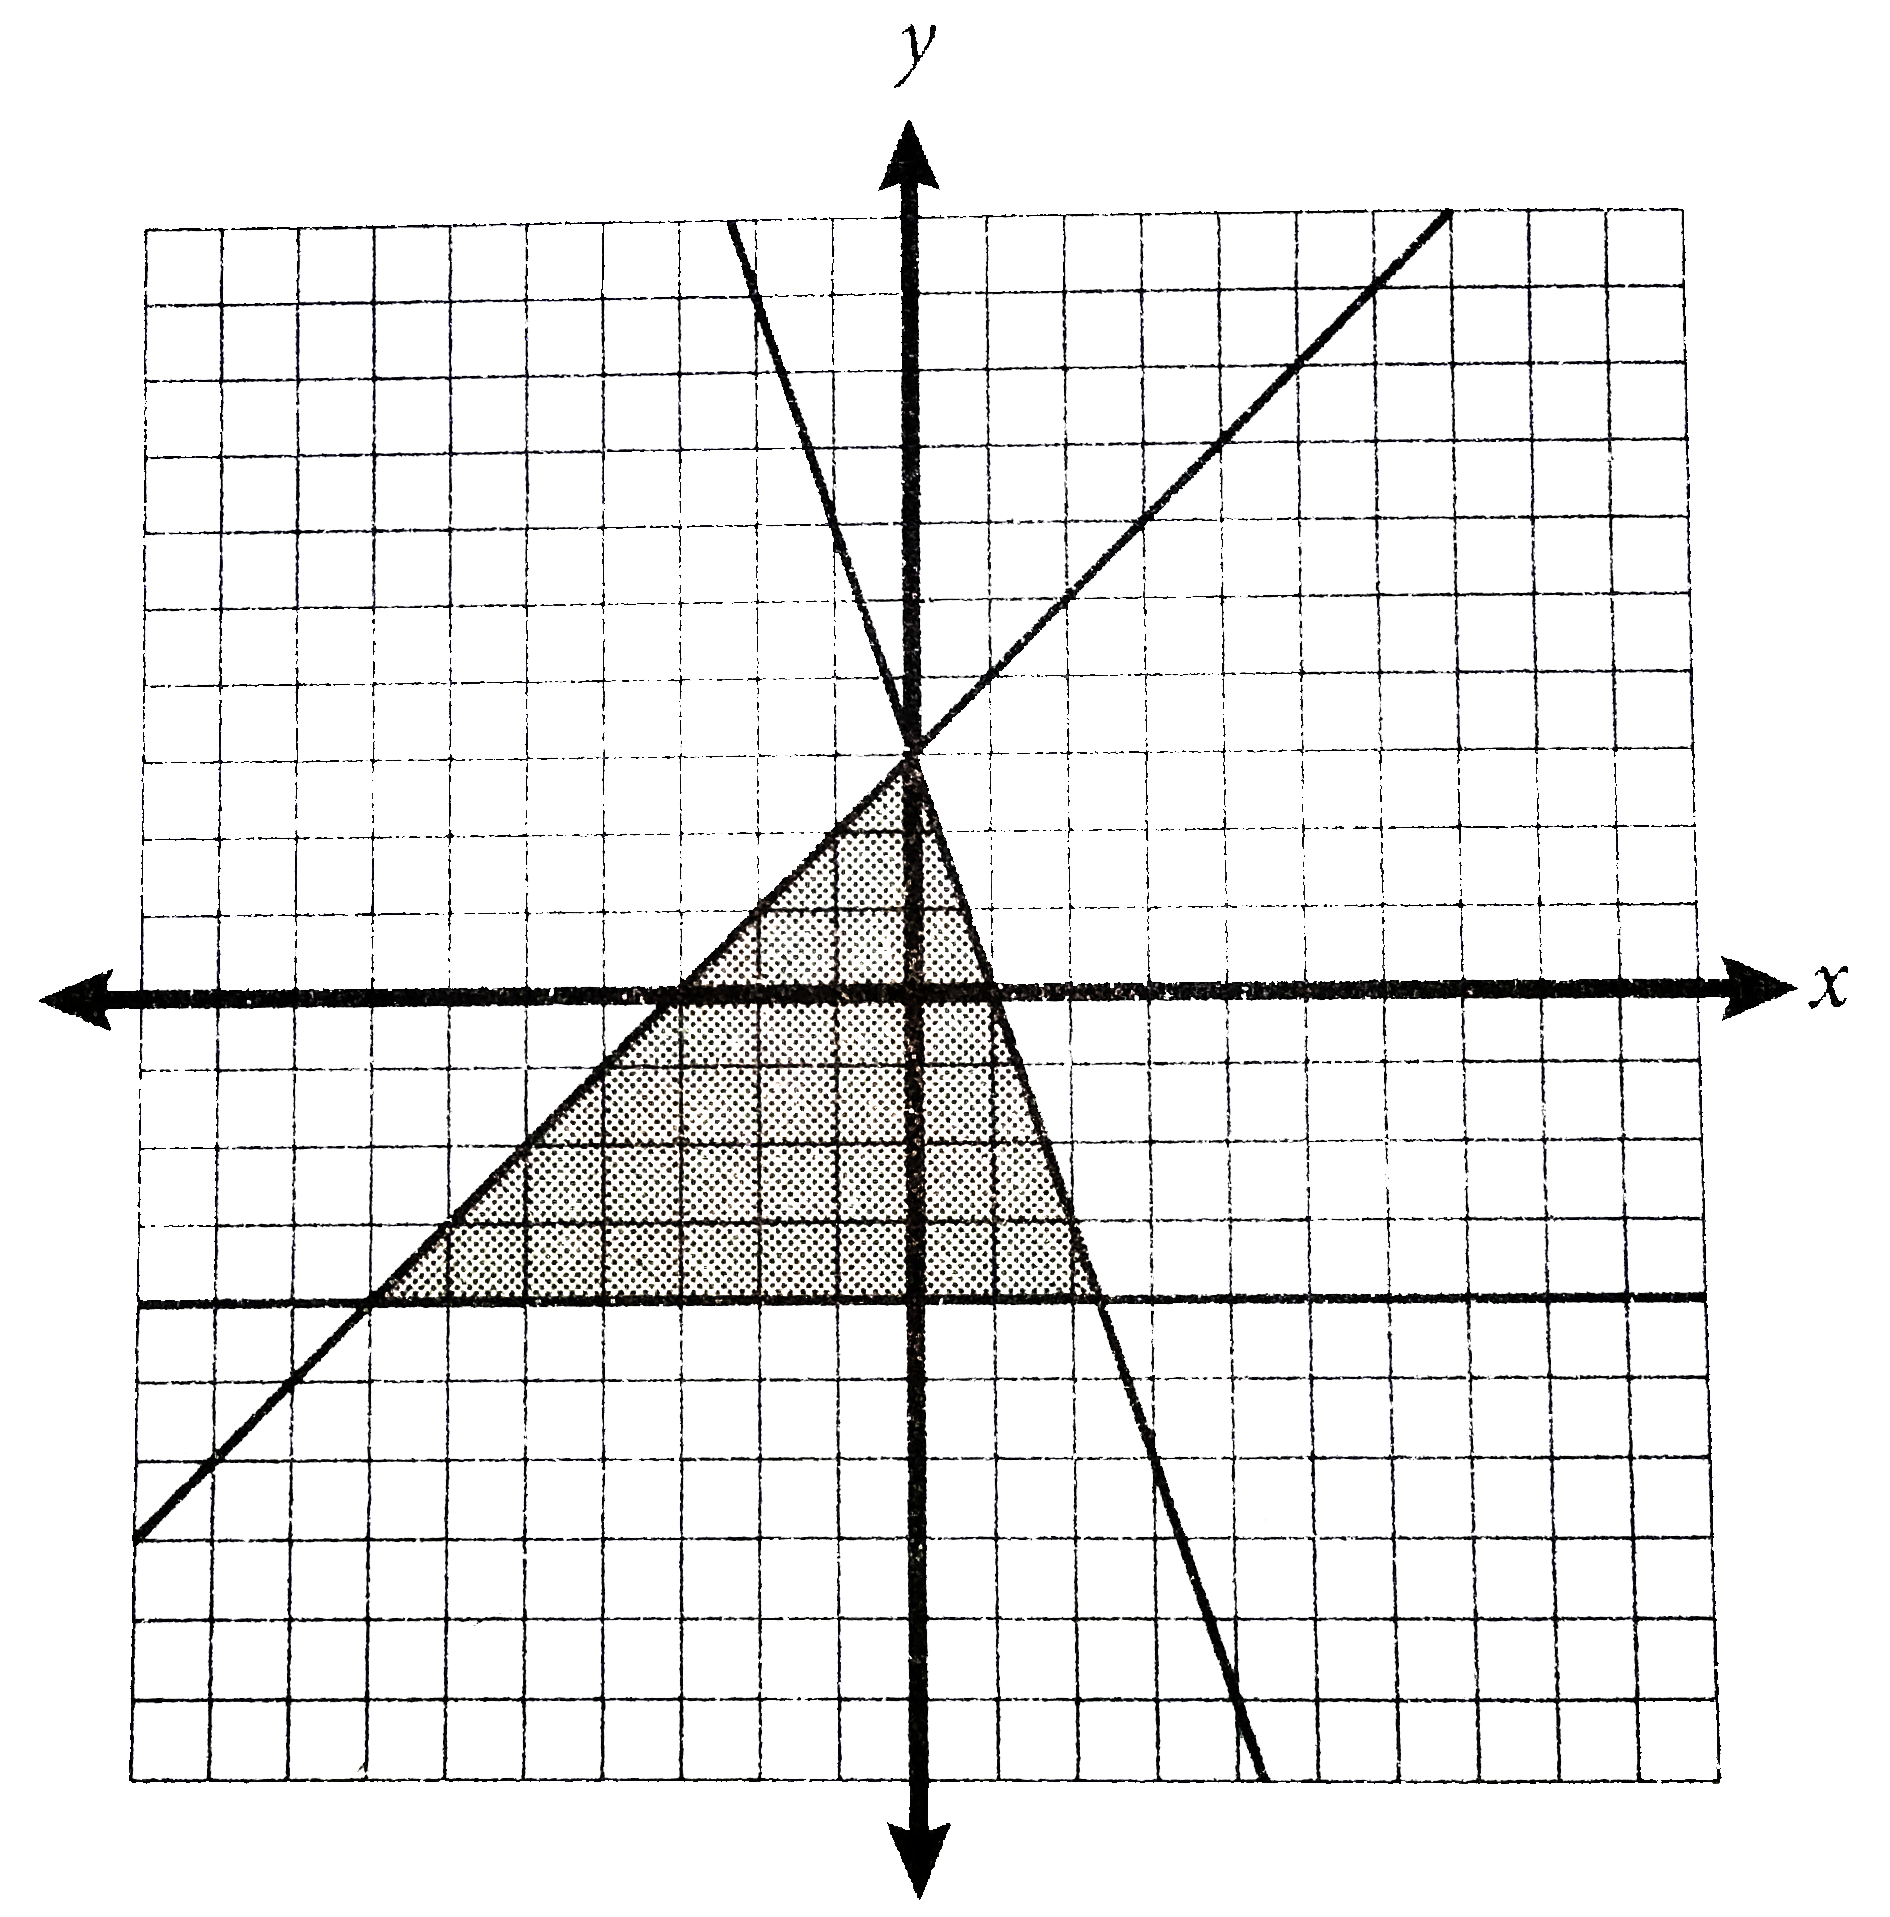
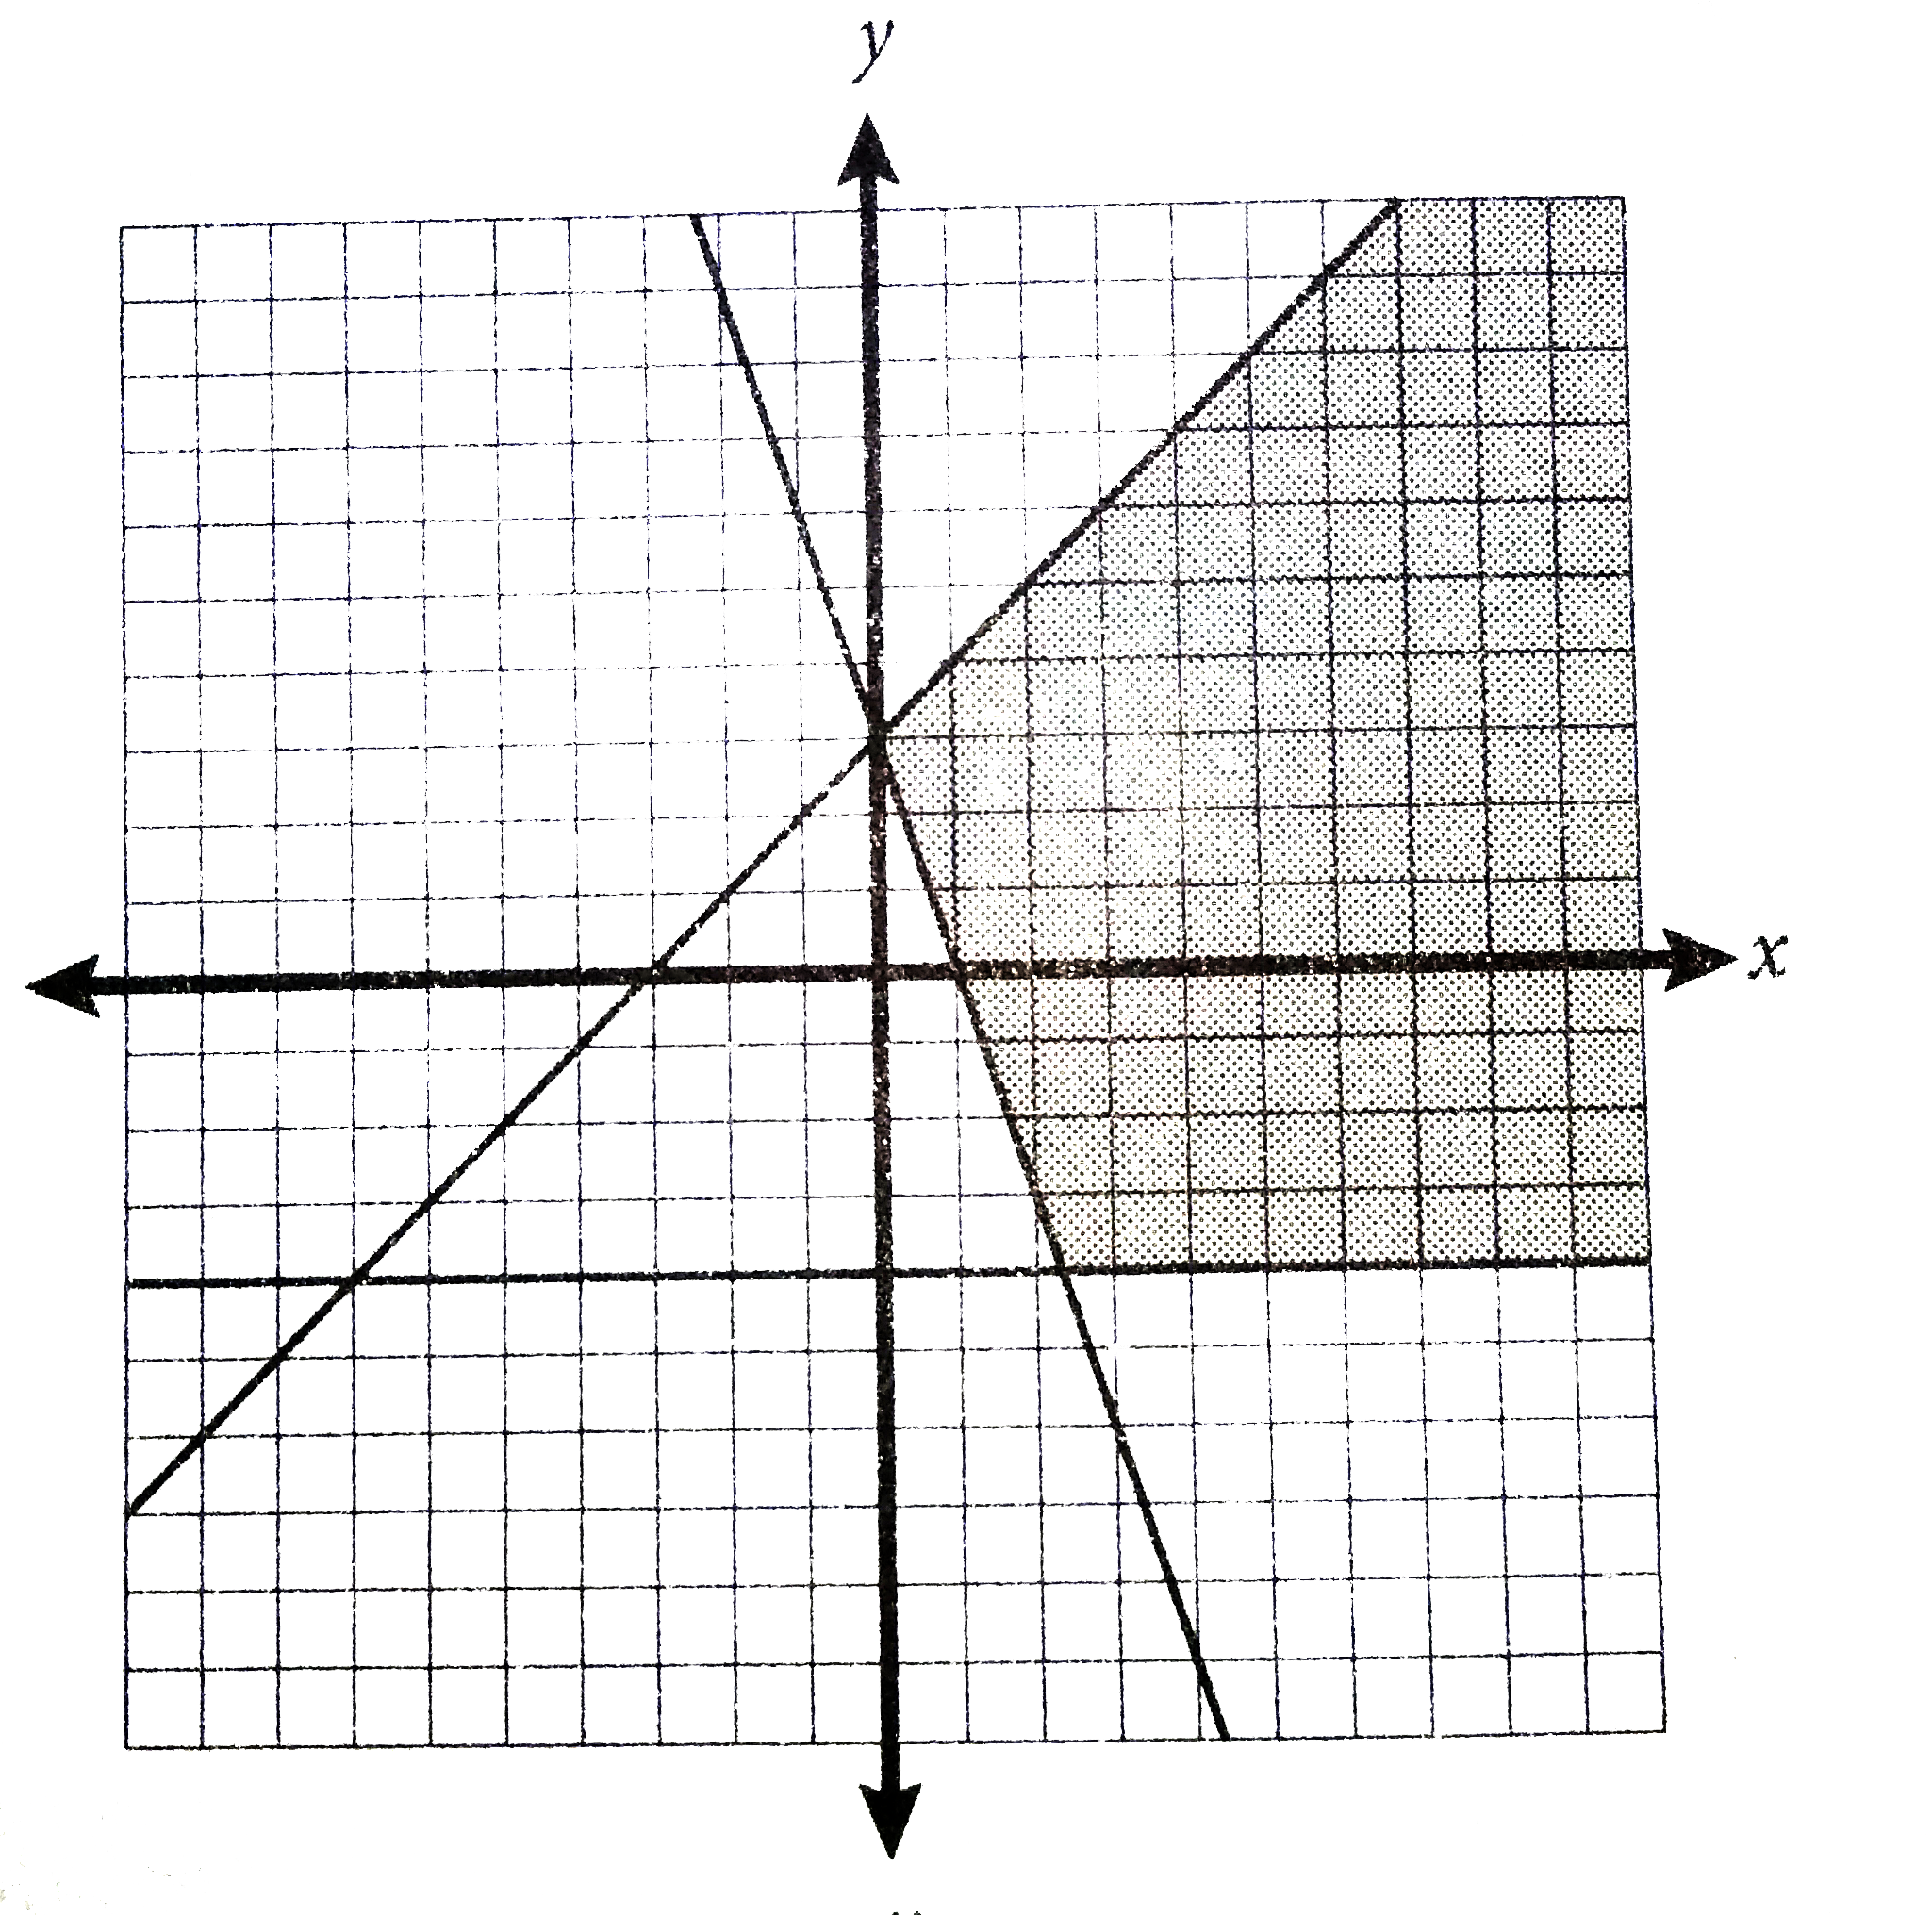
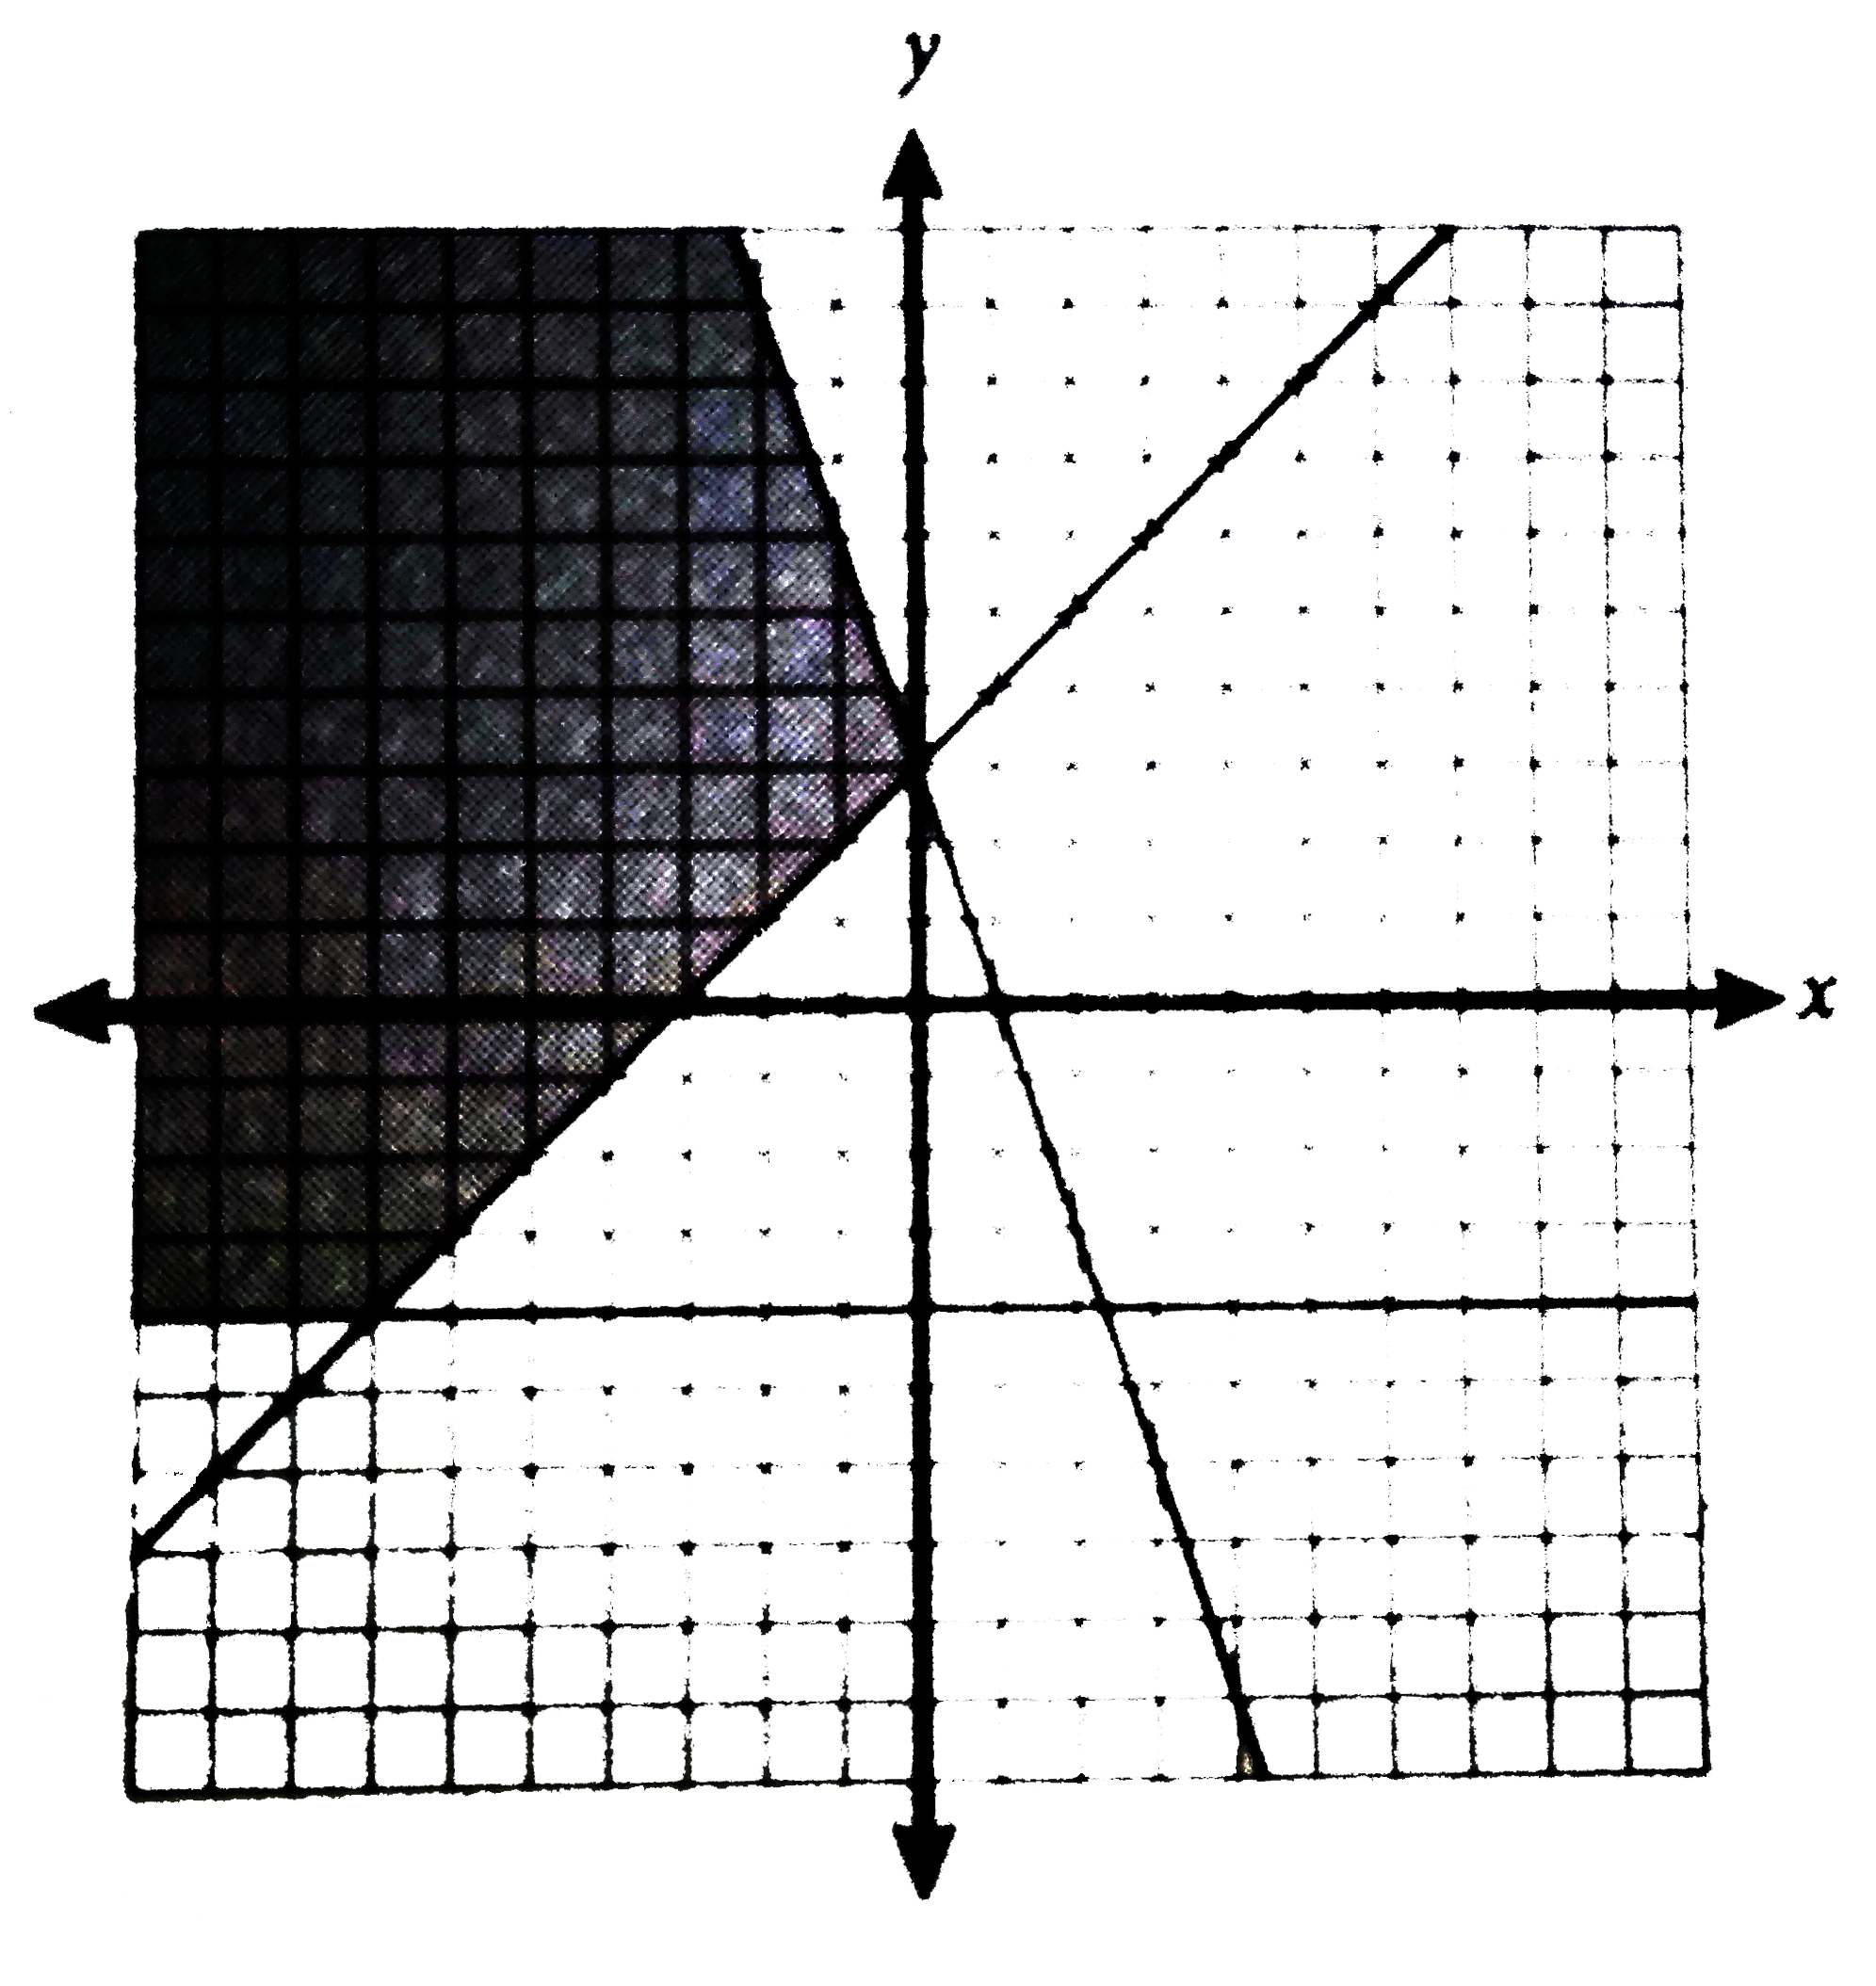
−2y≤8
y−3≤x
−13y+1≥x
Which of the following graphs shows the solutions to the system of inequalities above?A B
B C
C D
D
Which of the following is the complete solution set to the inequality |x|+|x−3|>3 ?
A{x:x>3orx<0}B{x:−3<x<3}C{x:−3>x}D{x:−3<x}
Represent the graph of following inequality |x|≤3
View SolutionFor the following inequations, graph the solution set on the real number line :
−4≤3x−1<8
View SolutionSolve the following inequation and represent the solution set on the numbe line.
3x5+2 x+4≤x2+5,x∈R
View SolutionSolve the following inequation and represent the solution set on the number line :
4x−19<3x5−2≤−25+x,∈R
View SolutionSolve the following inequation and graph the solution set on the number line :
2x−3<x+2≤3x+5,x∈R.
View Solution

