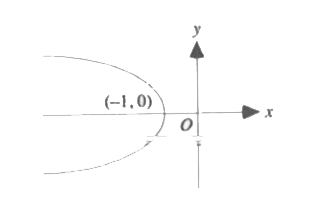
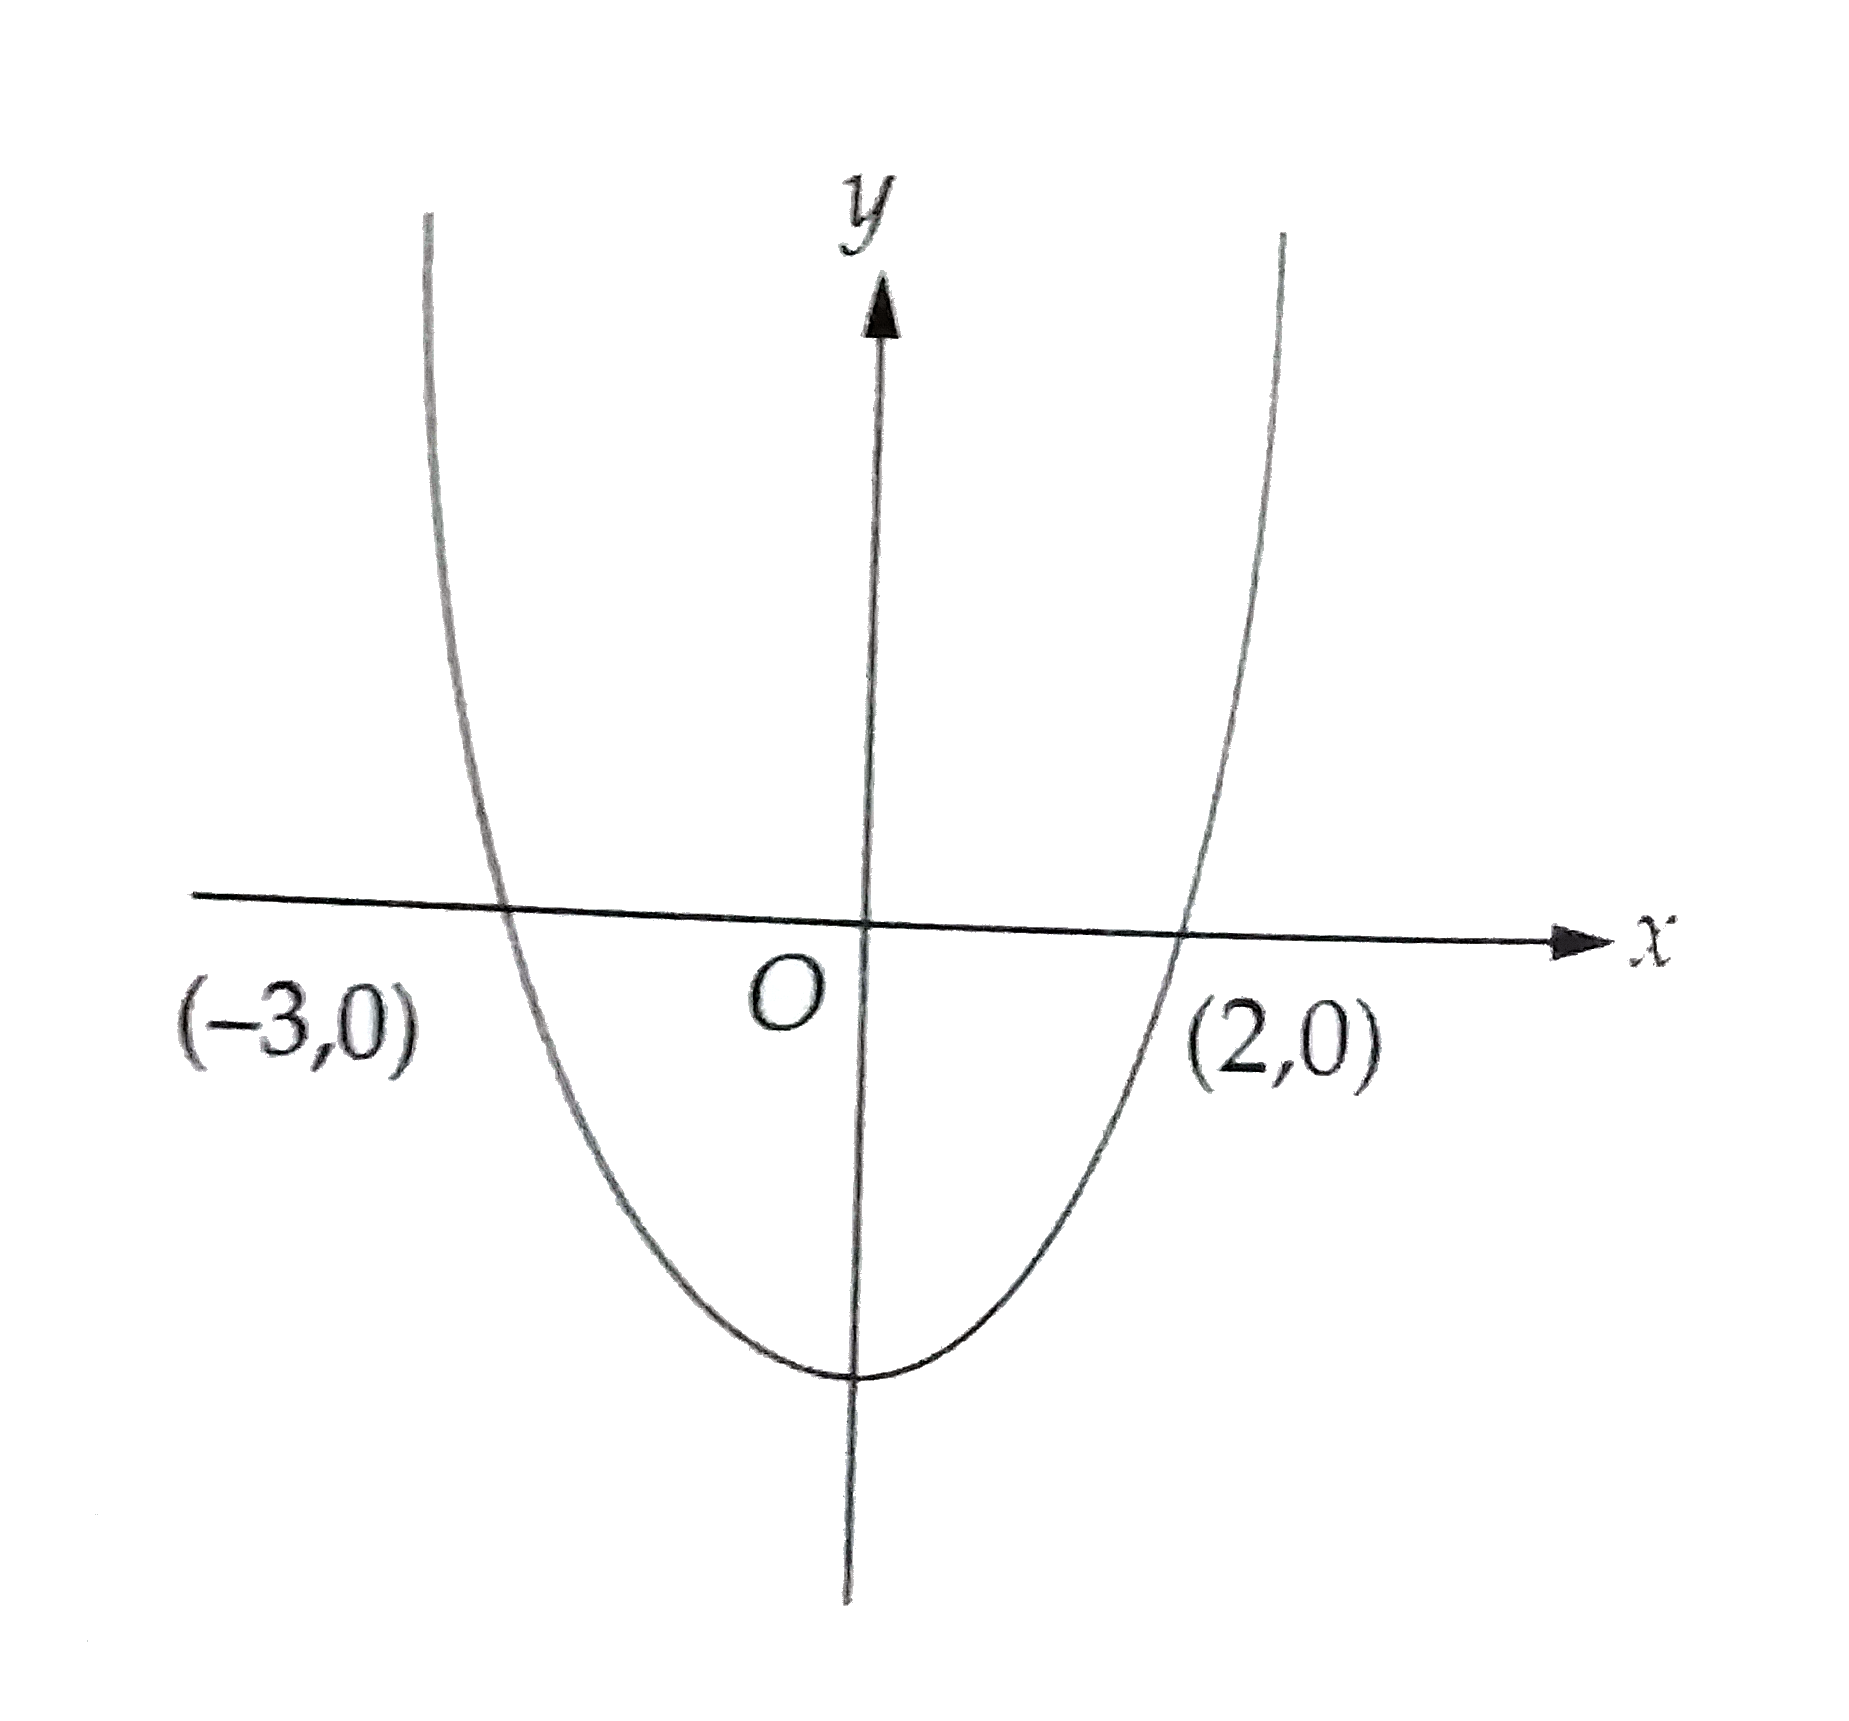
The graph shows a parabola that is symmetric about the x-axis. Which one of the following could be the equation of the graph?
A
x=−y2−1
B
x=−y2
C
x=−y2+1
D
x=y2−1
Video Solution
Text Solution
The correct Answer is:A
|
Answer
Step by step video, text & image solution for The graph shows a parabola that is symmetric about the x-axis. Which one of the following could be the equation of the graph? by Maths experts to help you in doubts & scoring excellent marks in Class 12 exams.
Updated on:21/07/2023Similar Questions
Knowledge Check
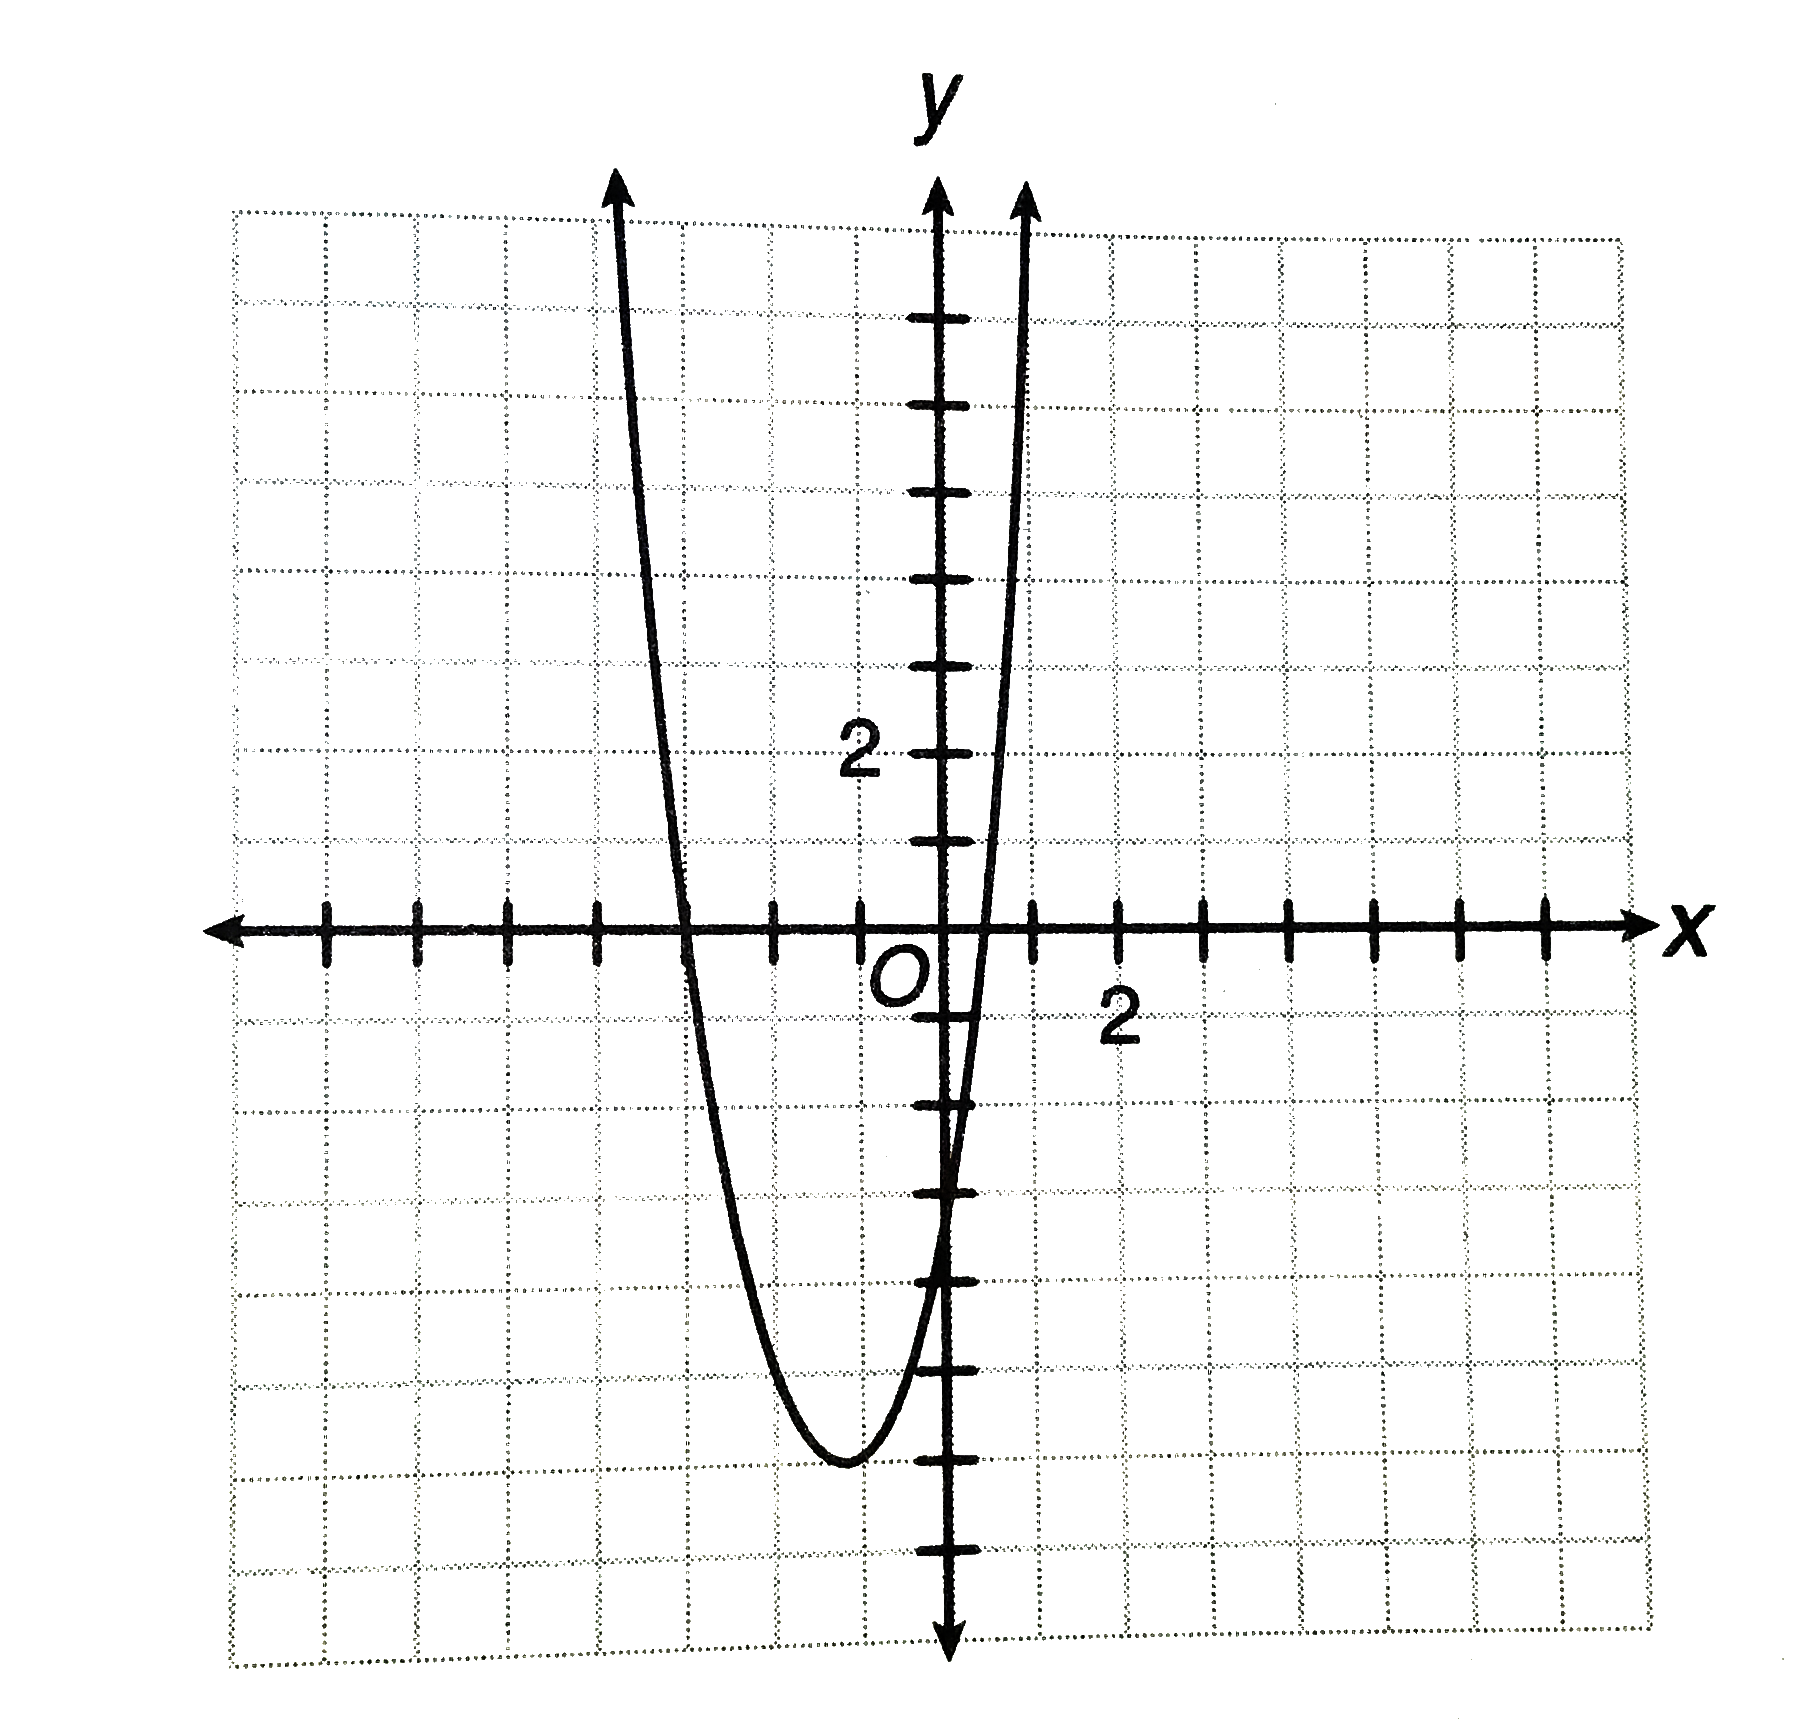
Which of the following could be the equation of the graph above?Ay=(x−3)(2x+1)By=(x+3)(2x−1)Cy=−(x−3)(1+2x)Dy=12(x+3)(x−1)Which of the following could be the graph of y=3−2x ?
A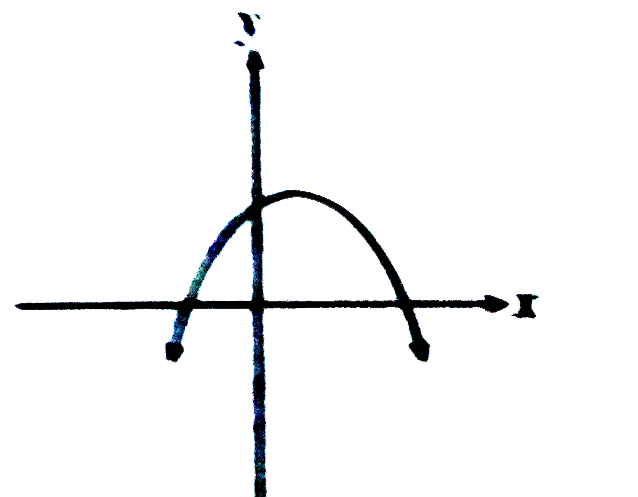 B
B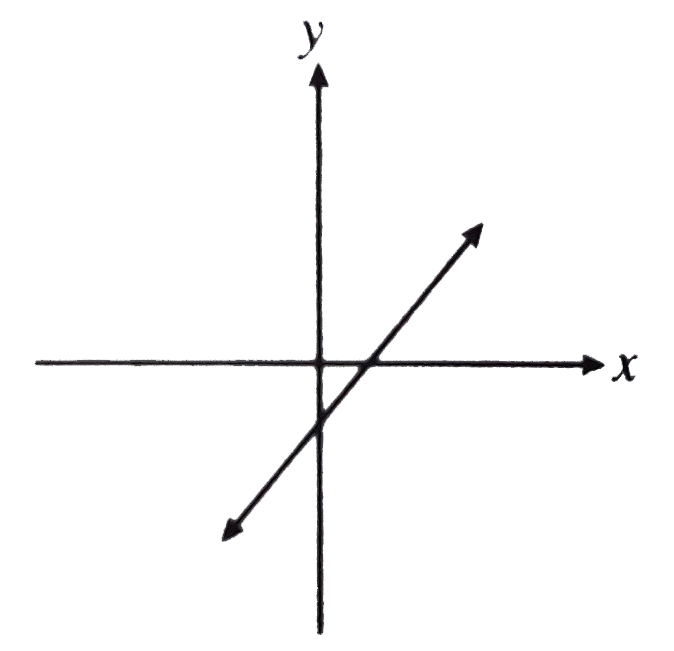 C
C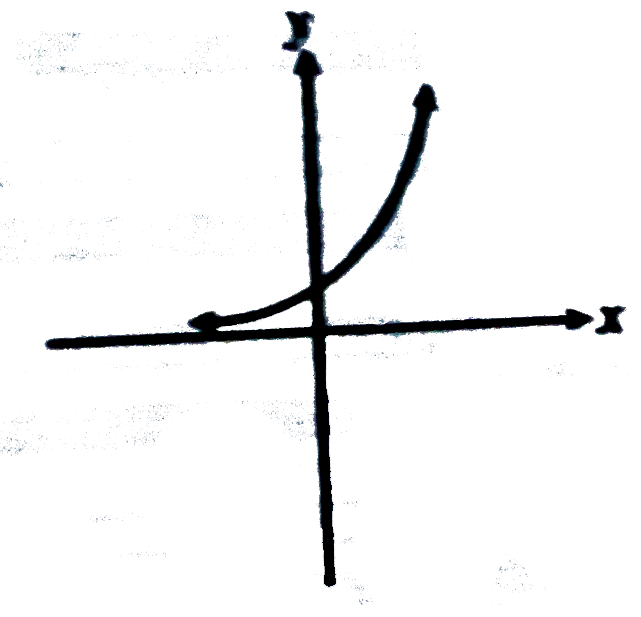 D
D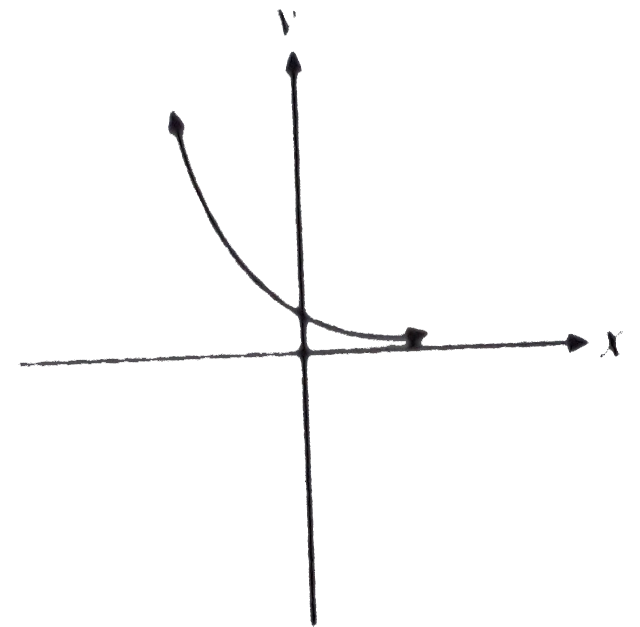
Which of the following could be the graph of 2x+3y+12=0 ?
A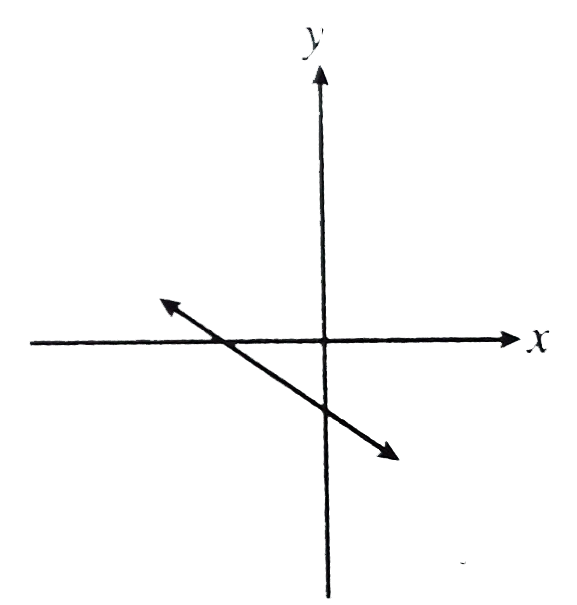 B
B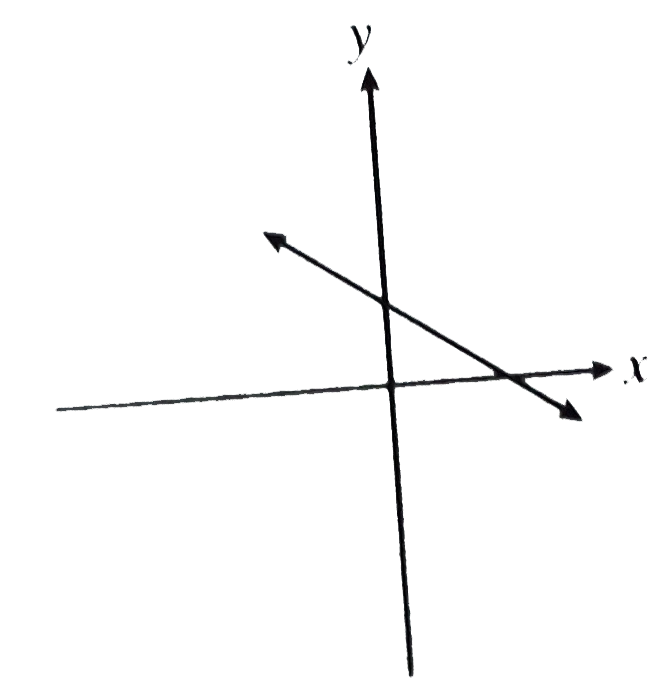 C
C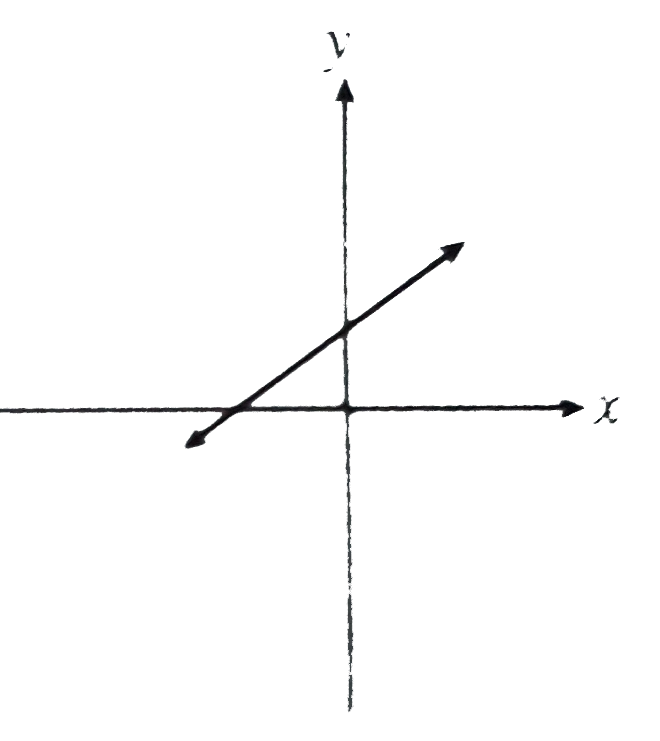 D
D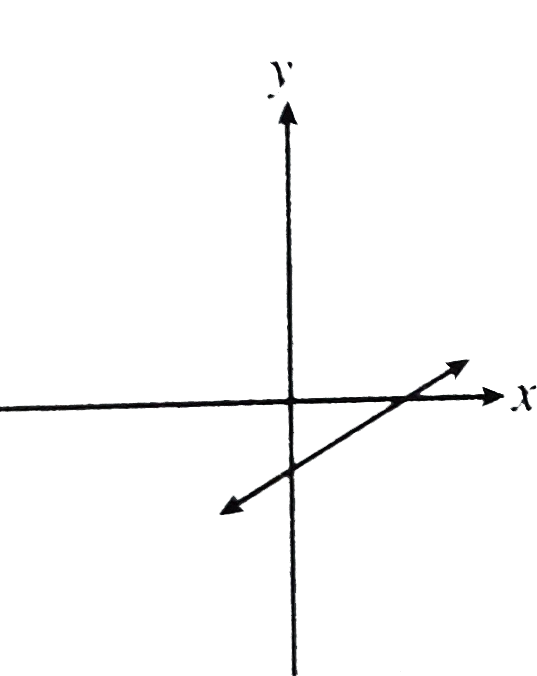
Which of the following could be the equation of the parabola in Figure ?
View SolutionWhich of the following could be the sketch graph of y=d(xlnx)dx
View SolutionWhich of the following could be the graph of 2x+3y+12=0 ?
View Solution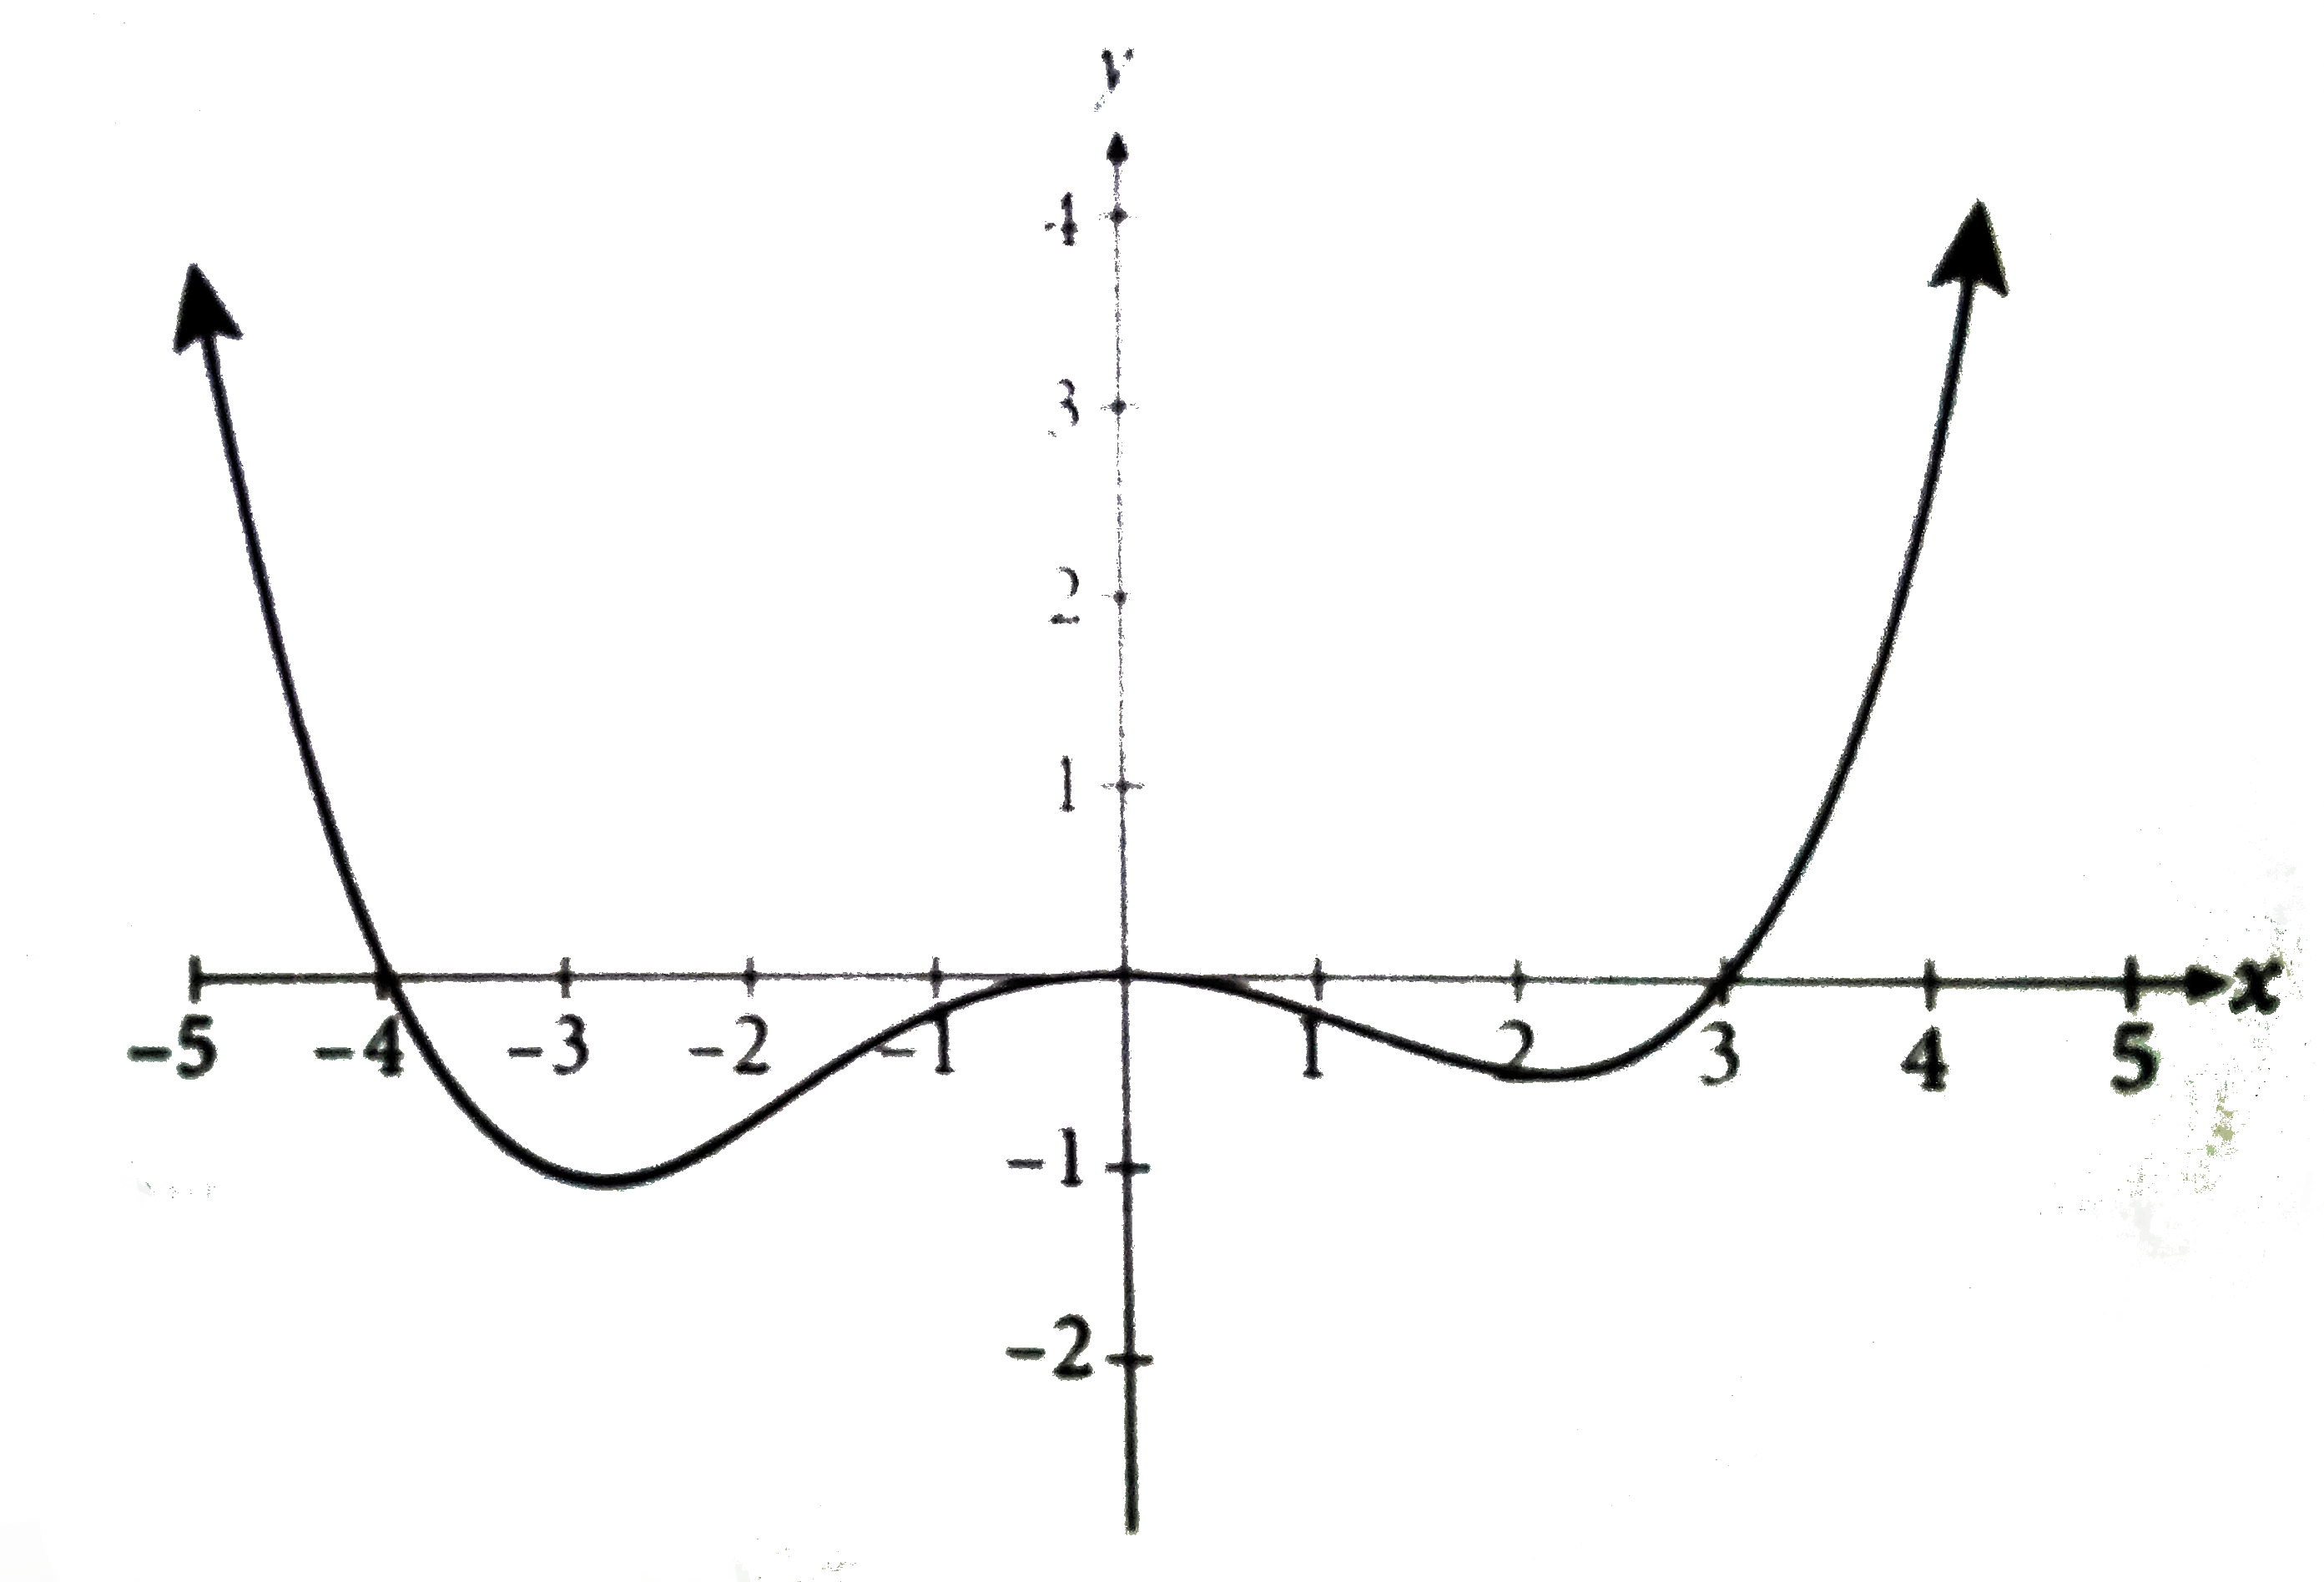
Which of the following could be the equation of the graph in the xy-plane shown above?
View Solution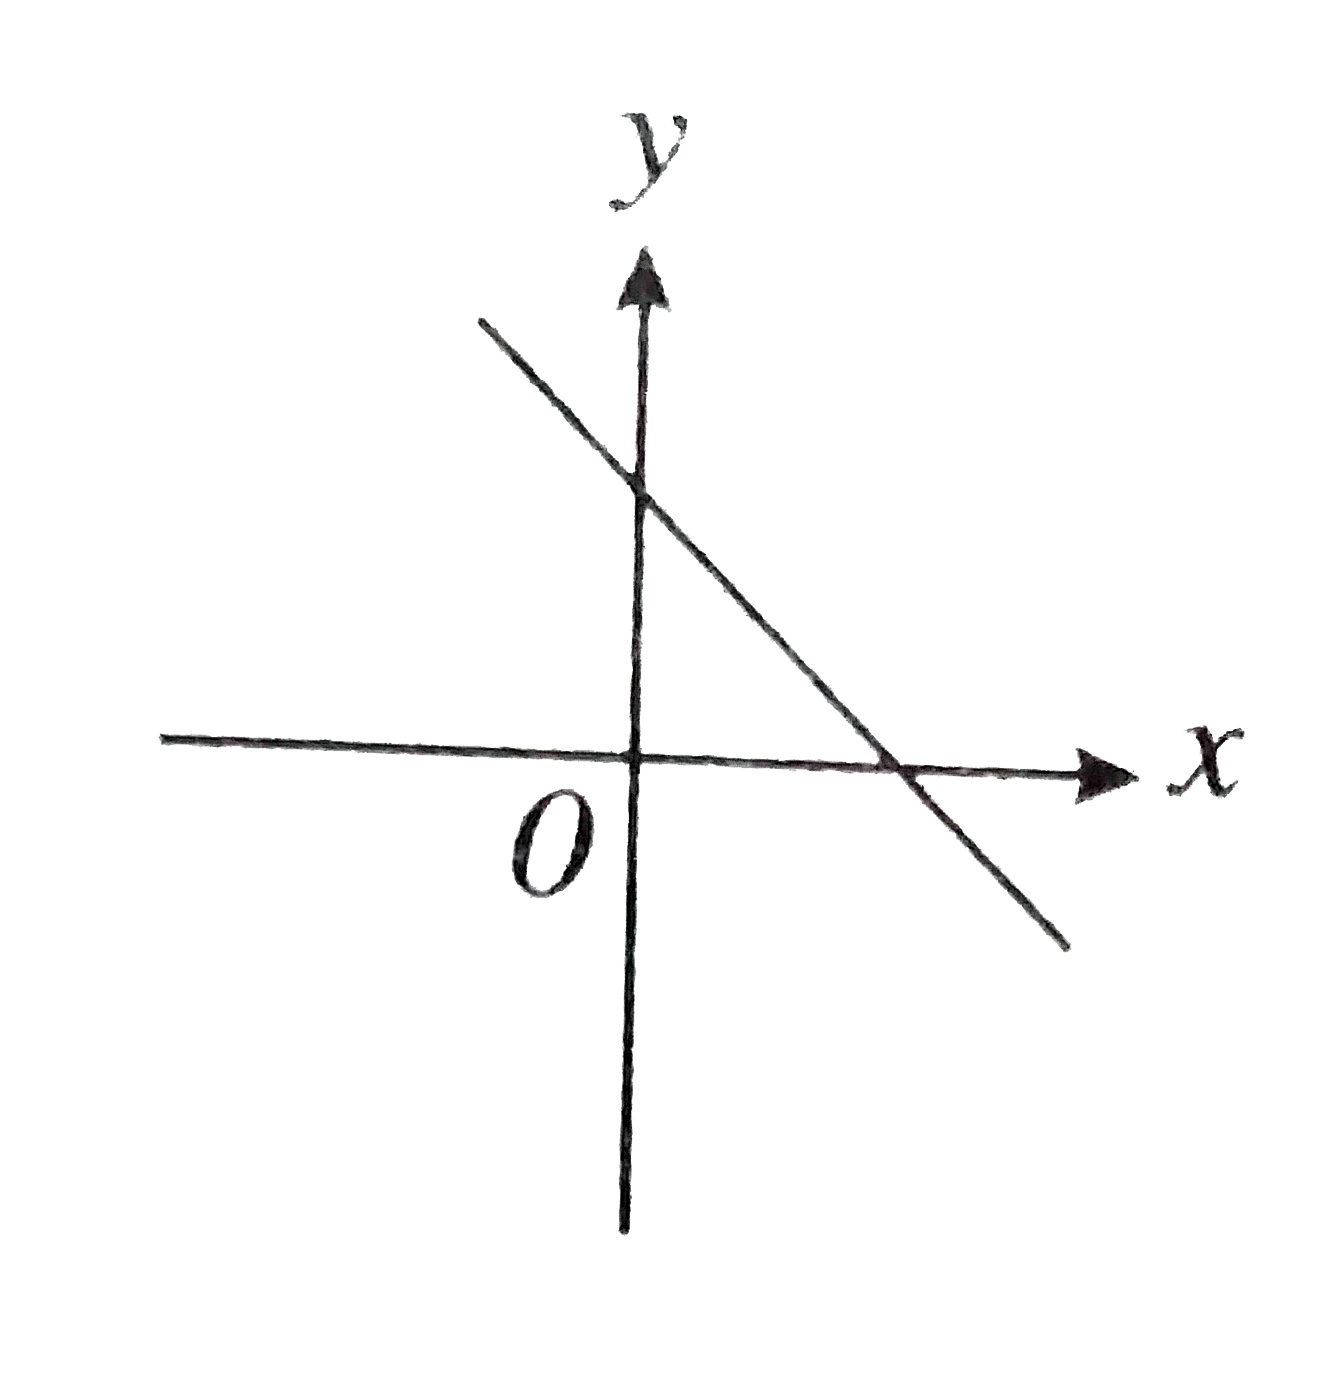
Which of the following could be the equation of the line represented in the graph above?
View Solution

