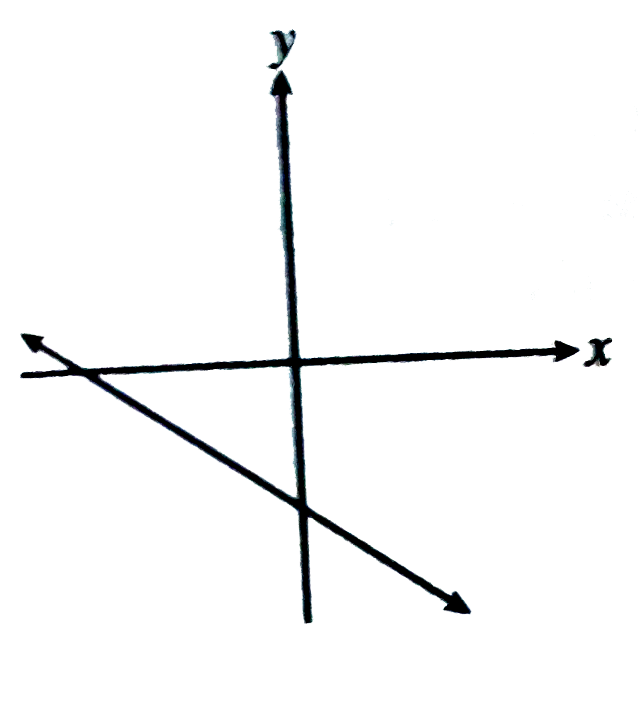
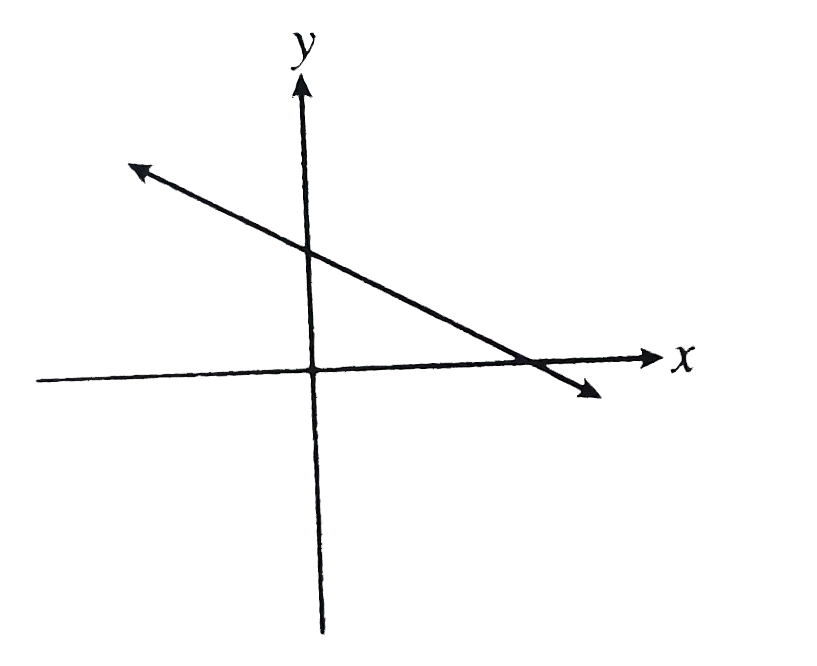
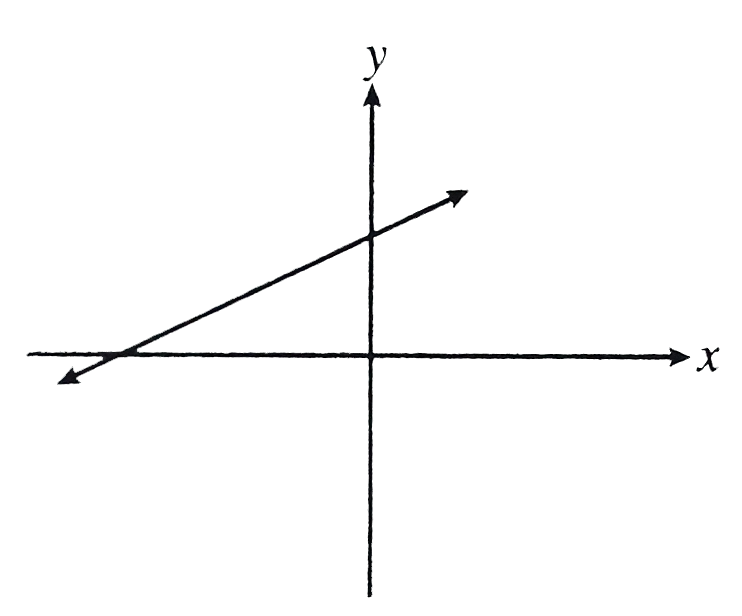
Which of the following could be the graph of 2x+3y+12=0 ?

The correct Answer is:A
To determine which graph corresponds to the equation 2x+3y+12=0, we can follow these steps:
Step 1: Rewrite the Equation
We start with the equation:
2x+3y+12=0
We can rearrange this to isolate y:
3y=−2x−12
y=−23x−4
Step 2: Identify the Slope and Y-Intercept
From the equation y=−23x−4, we can identify:
- The slope (m) is −23.
- The y-intercept (b) is −4.
Step 3: Find the X-Intercept
To find the x-intercept, we set y=0:
0=−23x−4
Solving for x:
23x=−4
x=−4⋅32=−6
Thus, the x-intercept is −6.
Step 4: Summary of Intercepts
- The y-intercept is −4 (point (0, -4)).
- The x-intercept is −6 (point (-6, 0)).
Step 5: Analyze the Graphs
We need to identify which graph has both intercepts negative:
- The y-intercept is at (0, -4) which is below the x-axis.
- The x-intercept is at (-6, 0) which is to the left of the y-axis.
Conclusion
The graph that shows both intercepts (x-intercept at -6 and y-intercept at -4) must be the one where both intercepts are negative. Therefore, the correct graph is option A.
---
We start with the equation:
2x+3y+12=0
We can rearrange this to isolate y:
3y=−2x−12
y=−23x−4
From the equation y=−23x−4, we can identify:
- The slope (m) is −23.
- The y-intercept (b) is −4.
To find the x-intercept, we set y=0:
0=−23x−4
Solving for x:
23x=−4
x=−4⋅32=−6
Thus, the x-intercept is −6.
- The y-intercept is −4 (point (0, -4)).
- The x-intercept is −6 (point (-6, 0)).
We need to identify which graph has both intercepts negative:
- The y-intercept is at (0, -4) which is below the x-axis.
- The x-intercept is at (-6, 0) which is to the left of the y-axis.
The graph that shows both intercepts (x-intercept at -6 and y-intercept at -4) must be the one where both intercepts are negative. Therefore, the correct graph is option A.
Topper's Solved these Questions
Similar Questions
Knowledge Check
If p(x)=|2−x|+12, which of the following could be the graph of y=p(x) ?
A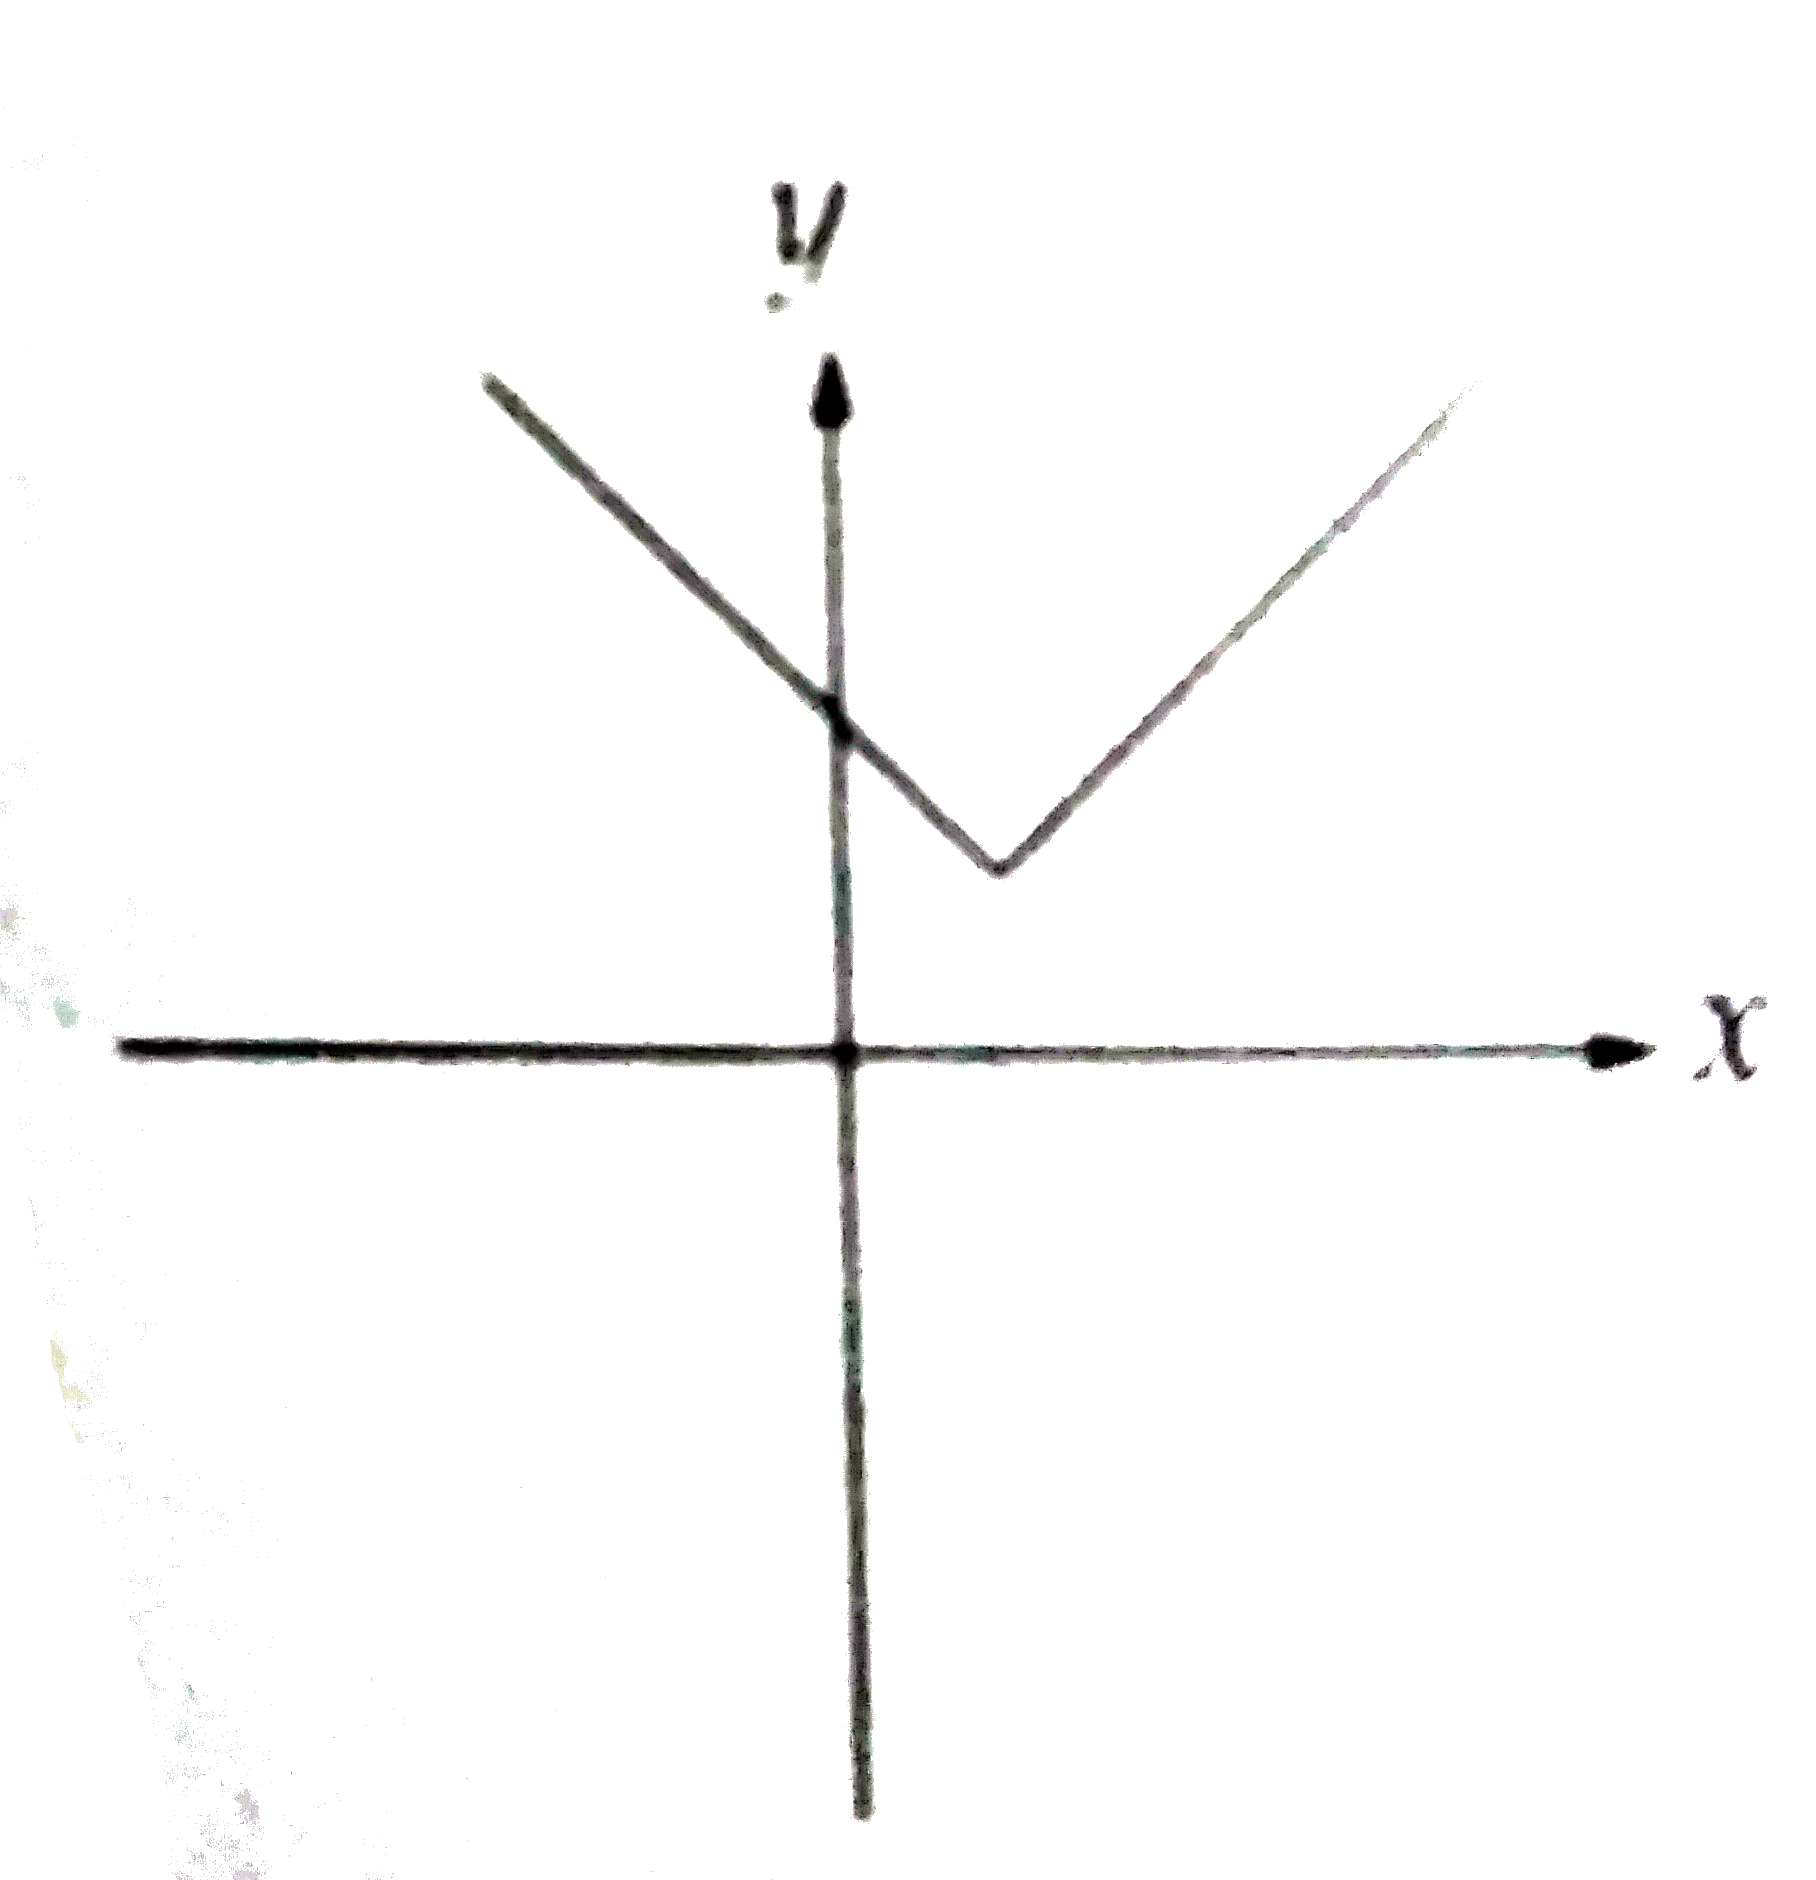 B
B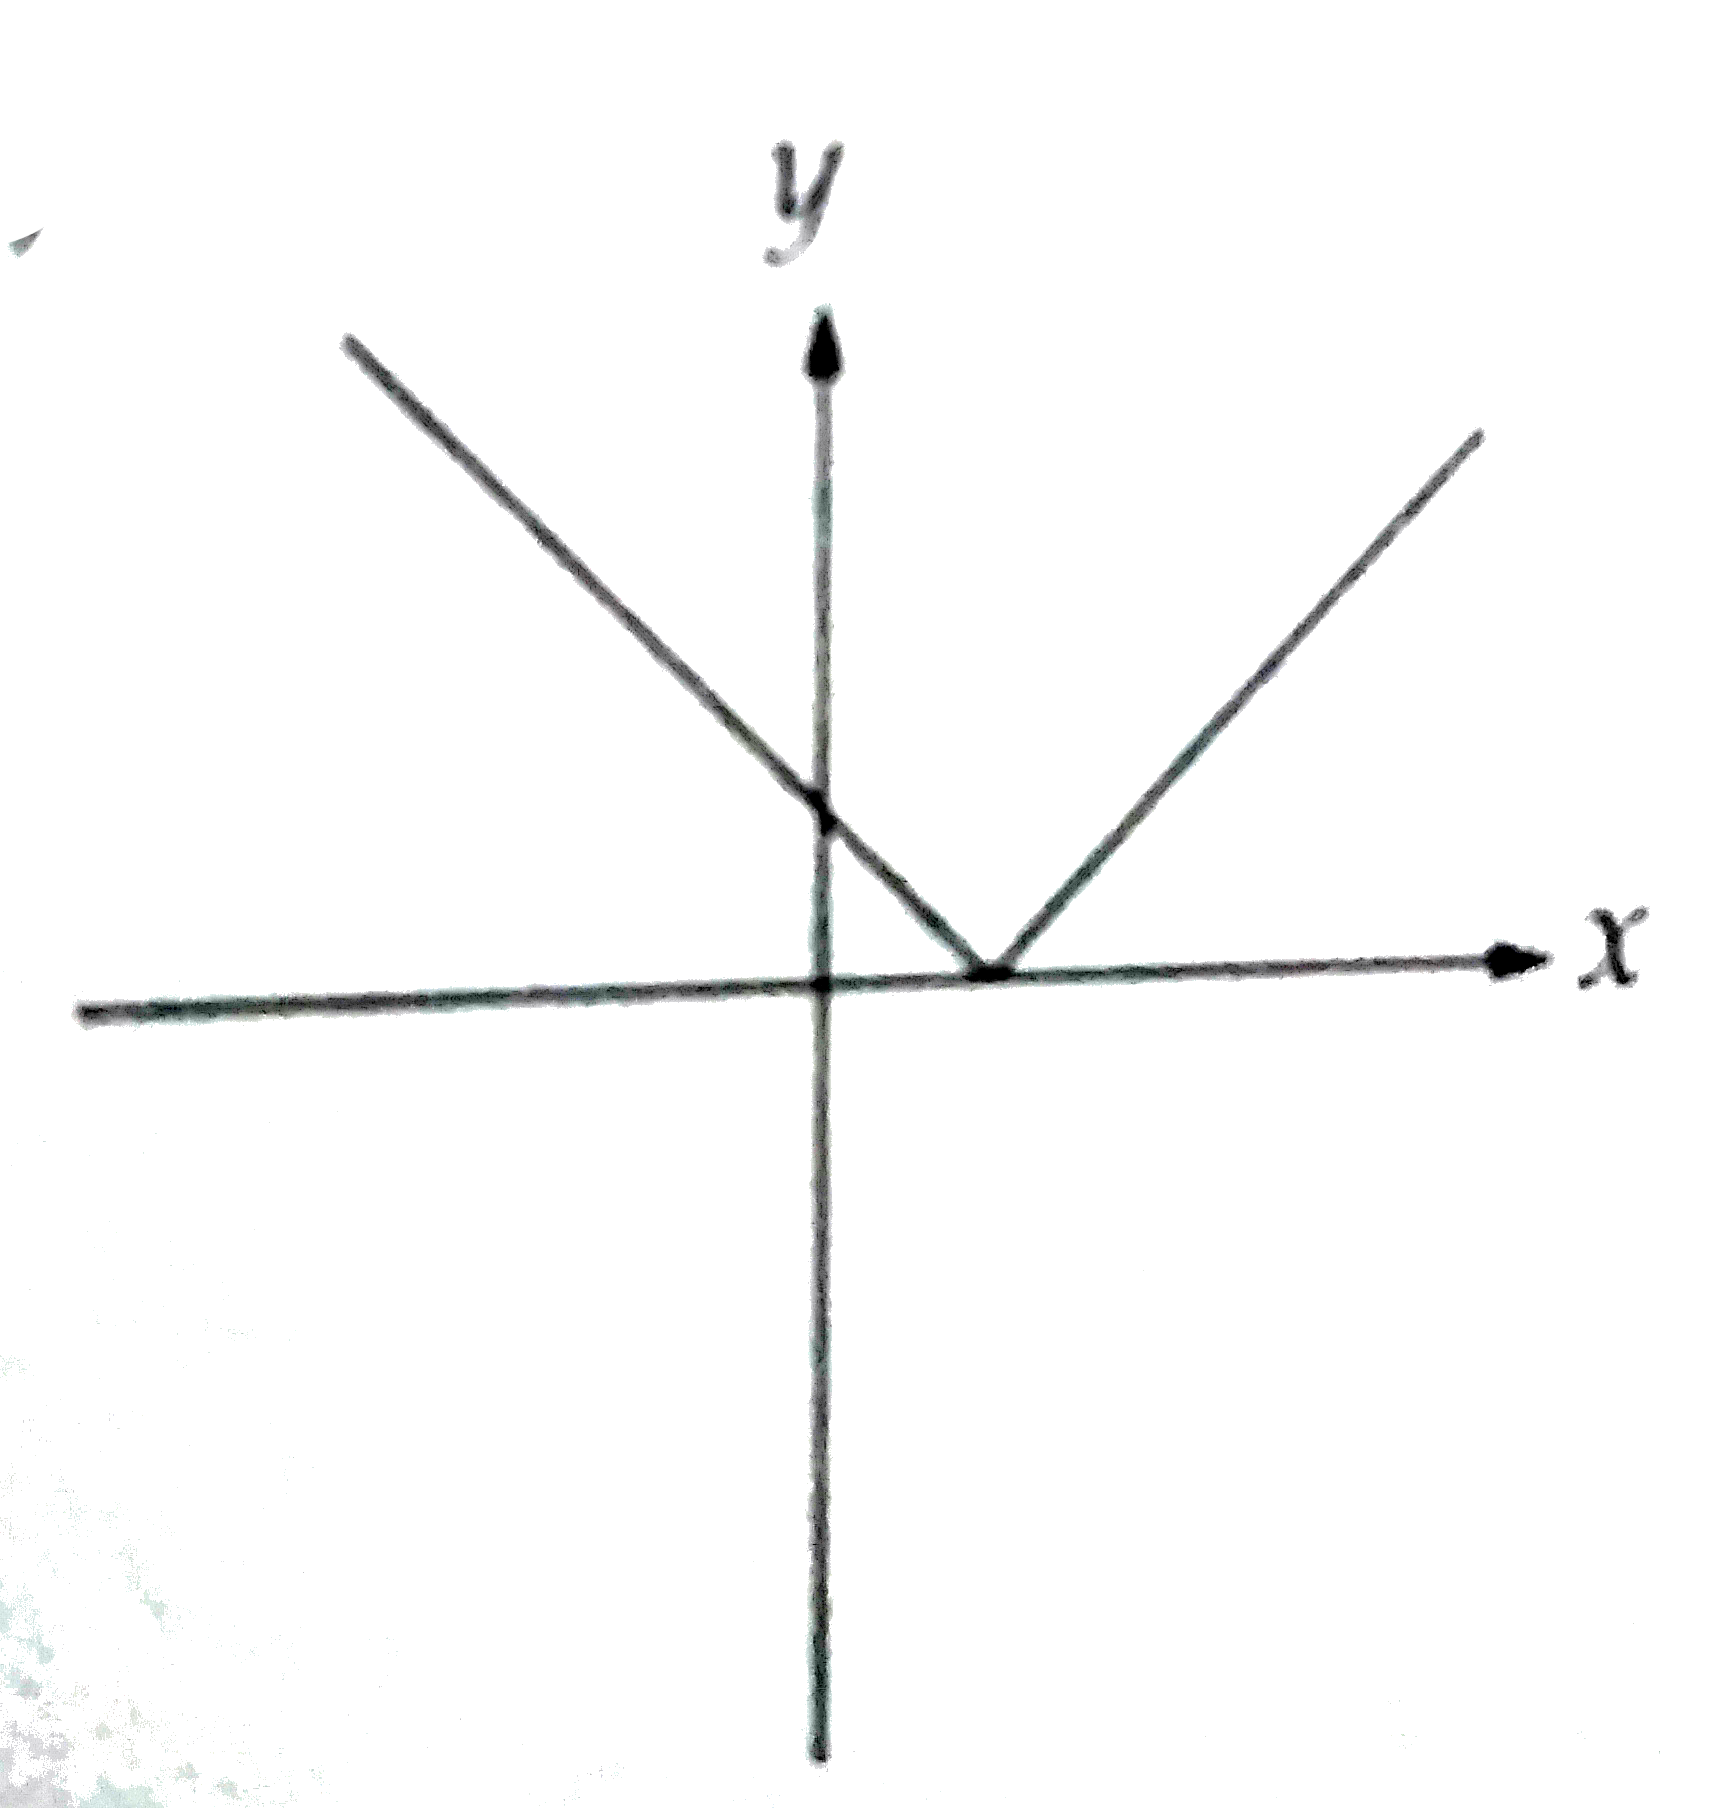 C
C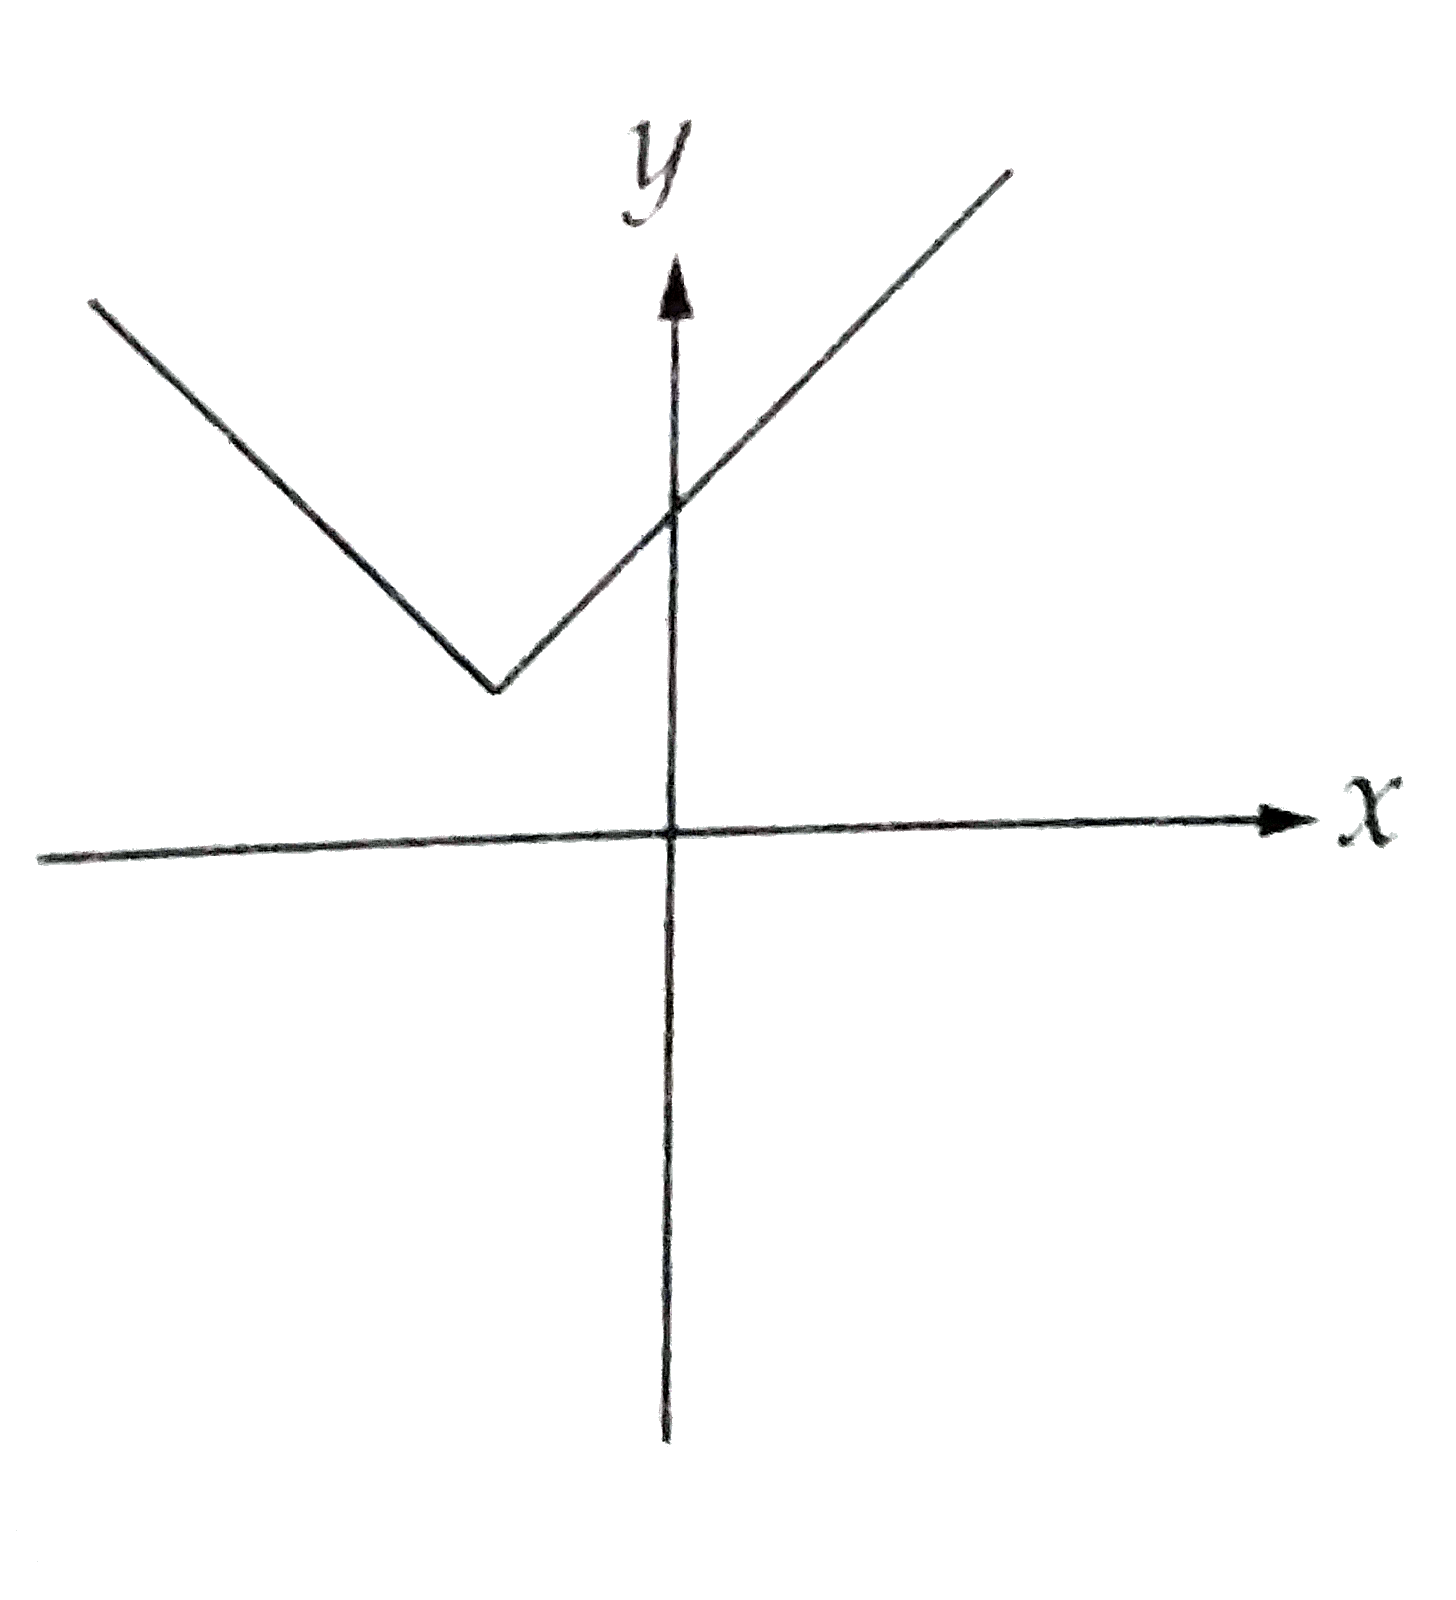 D
D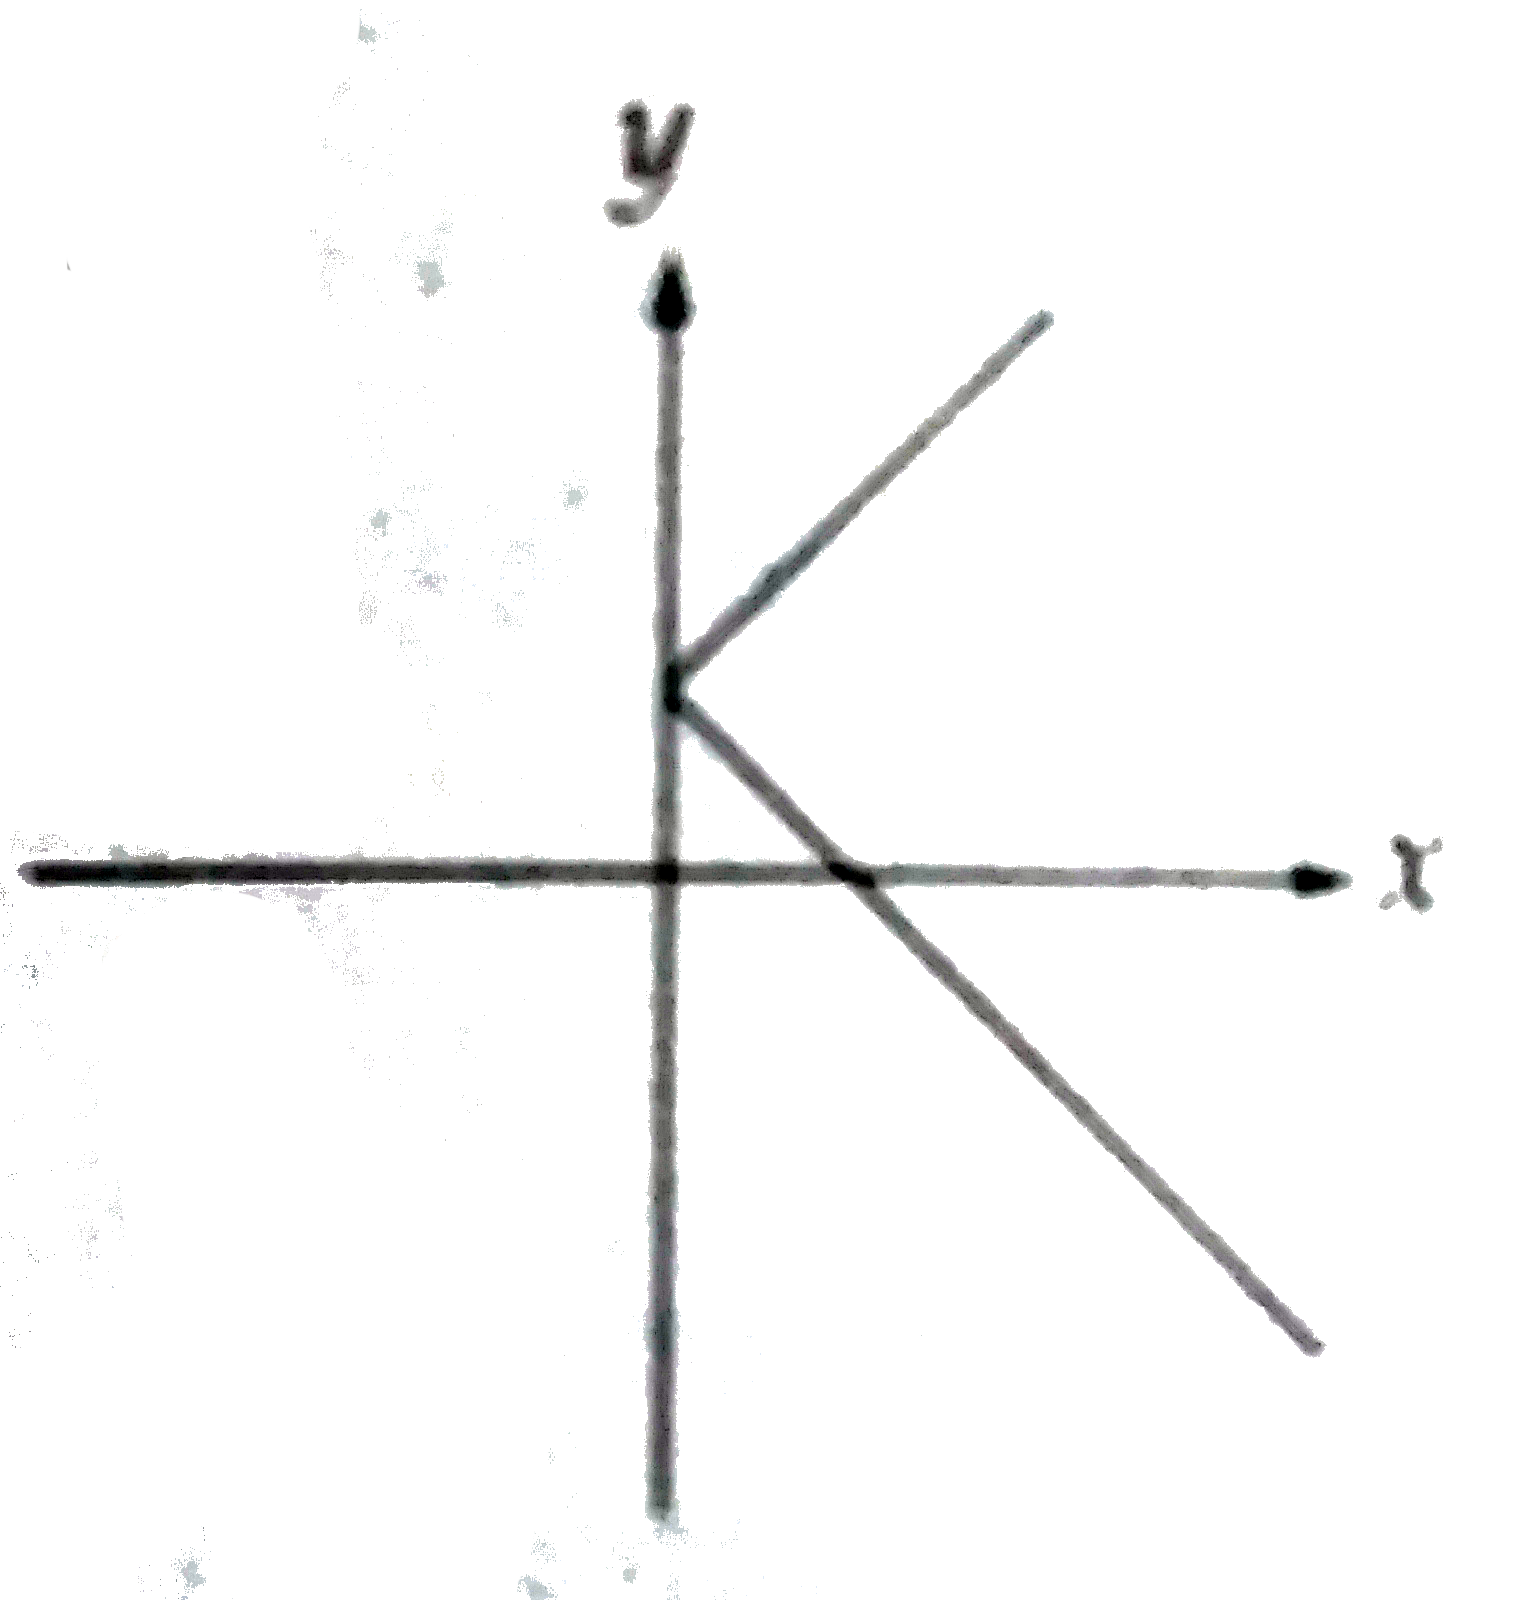
Which of the following could be the graph of y=3−2x ?
A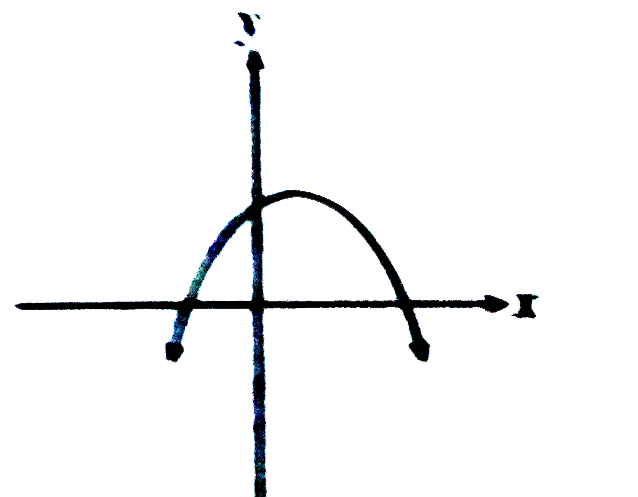 B
B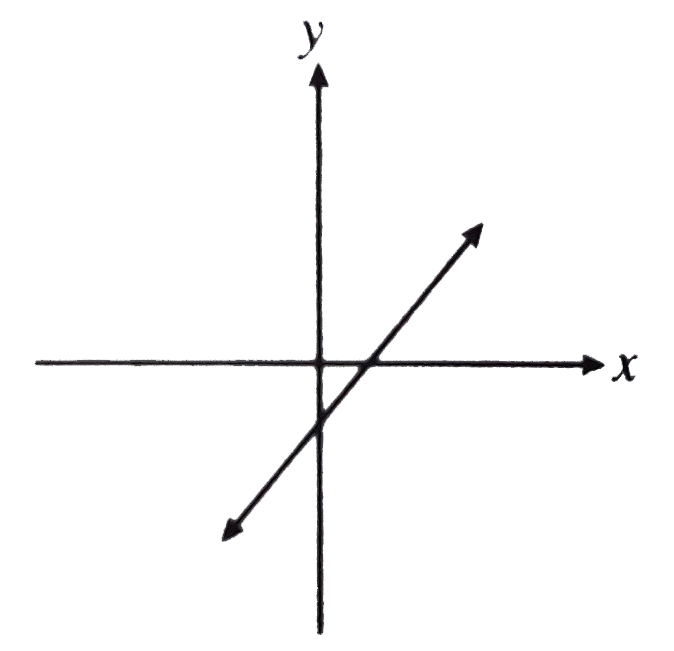 C
C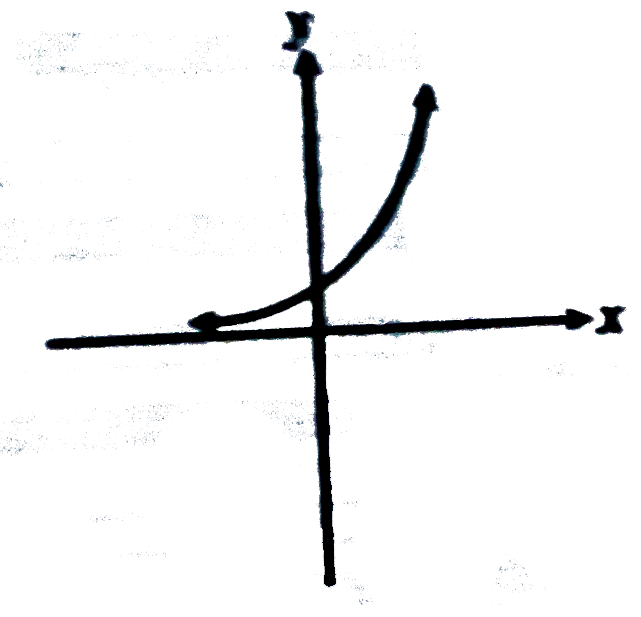 D
D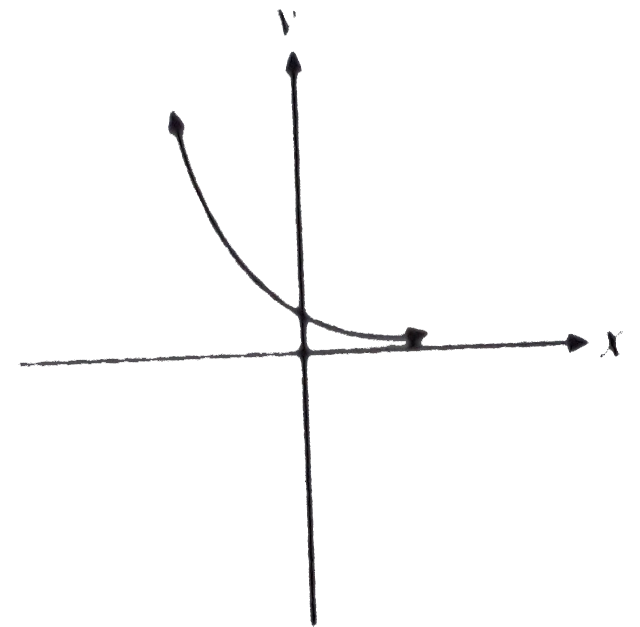
If w is an integer less than −1, which of the following could be the graph of x+wy=wx−y−3?
A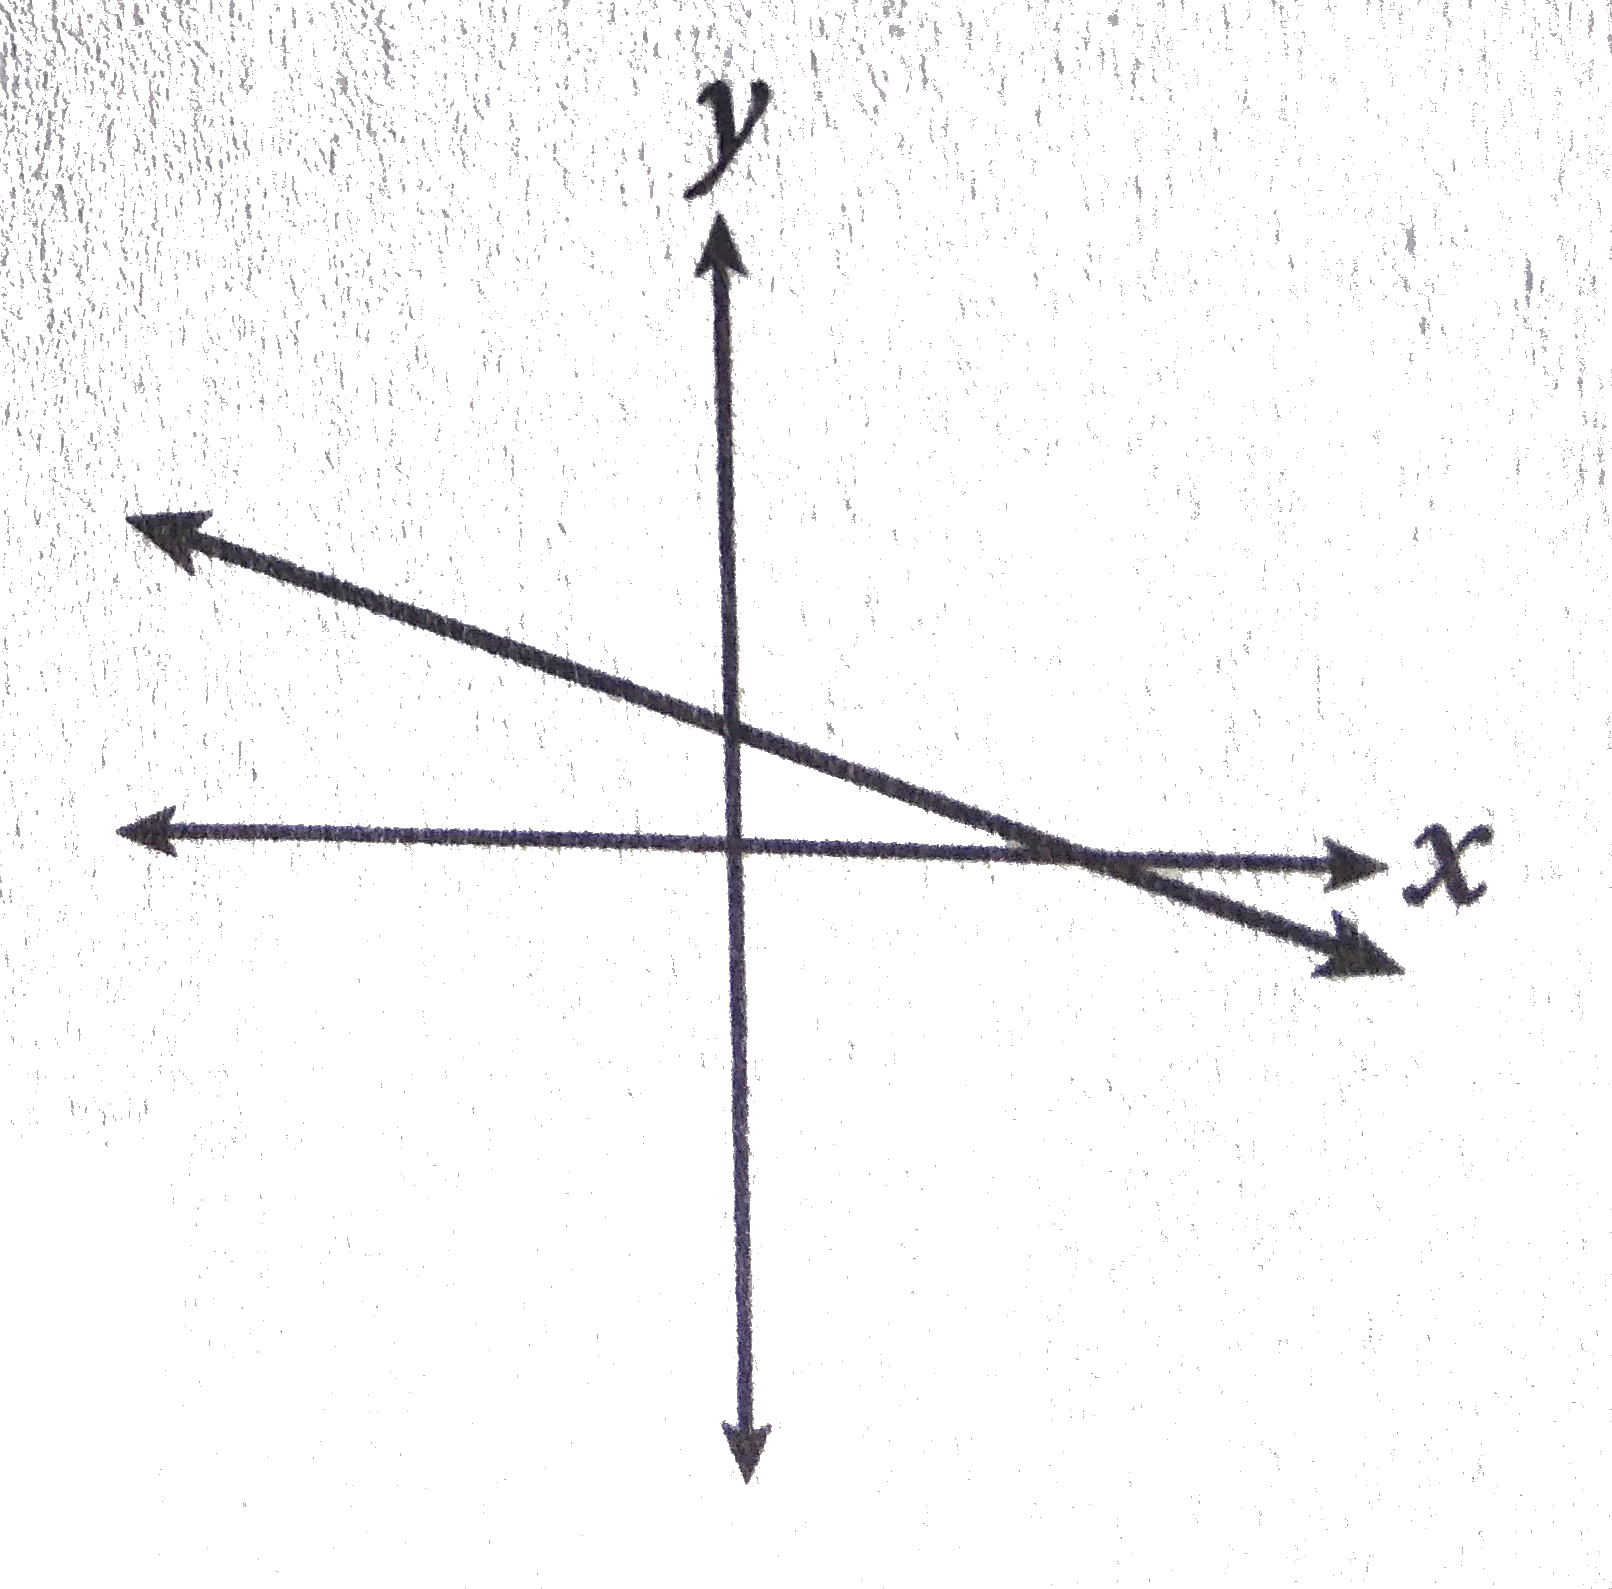 B
B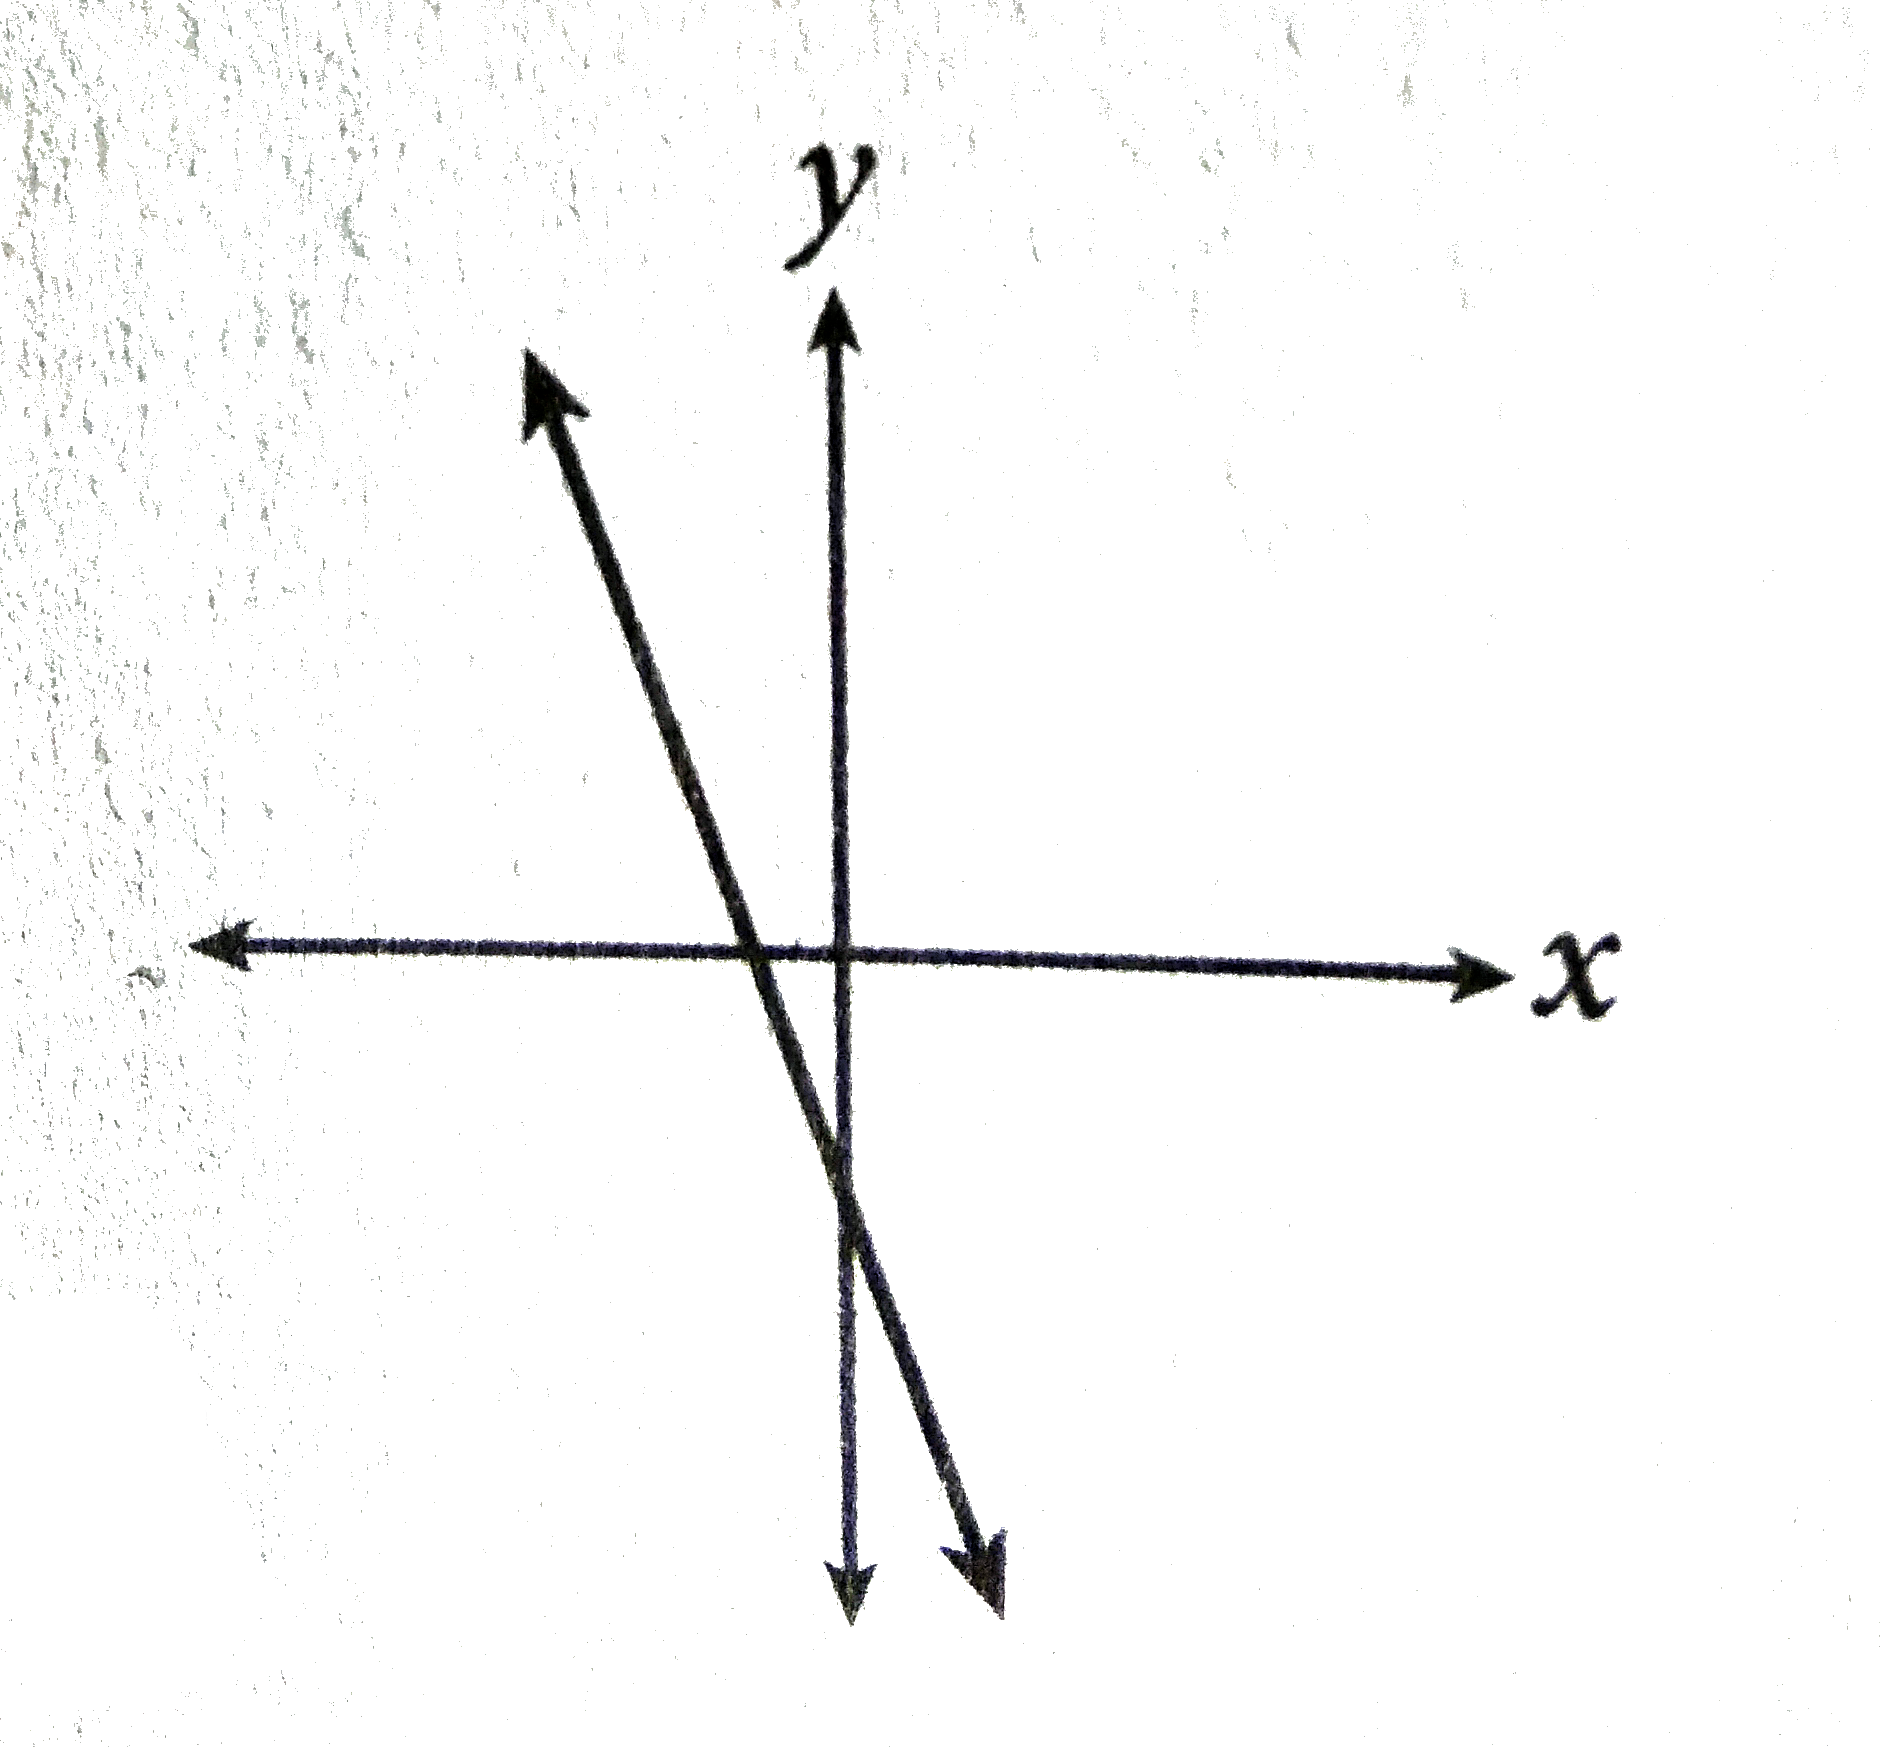 C
C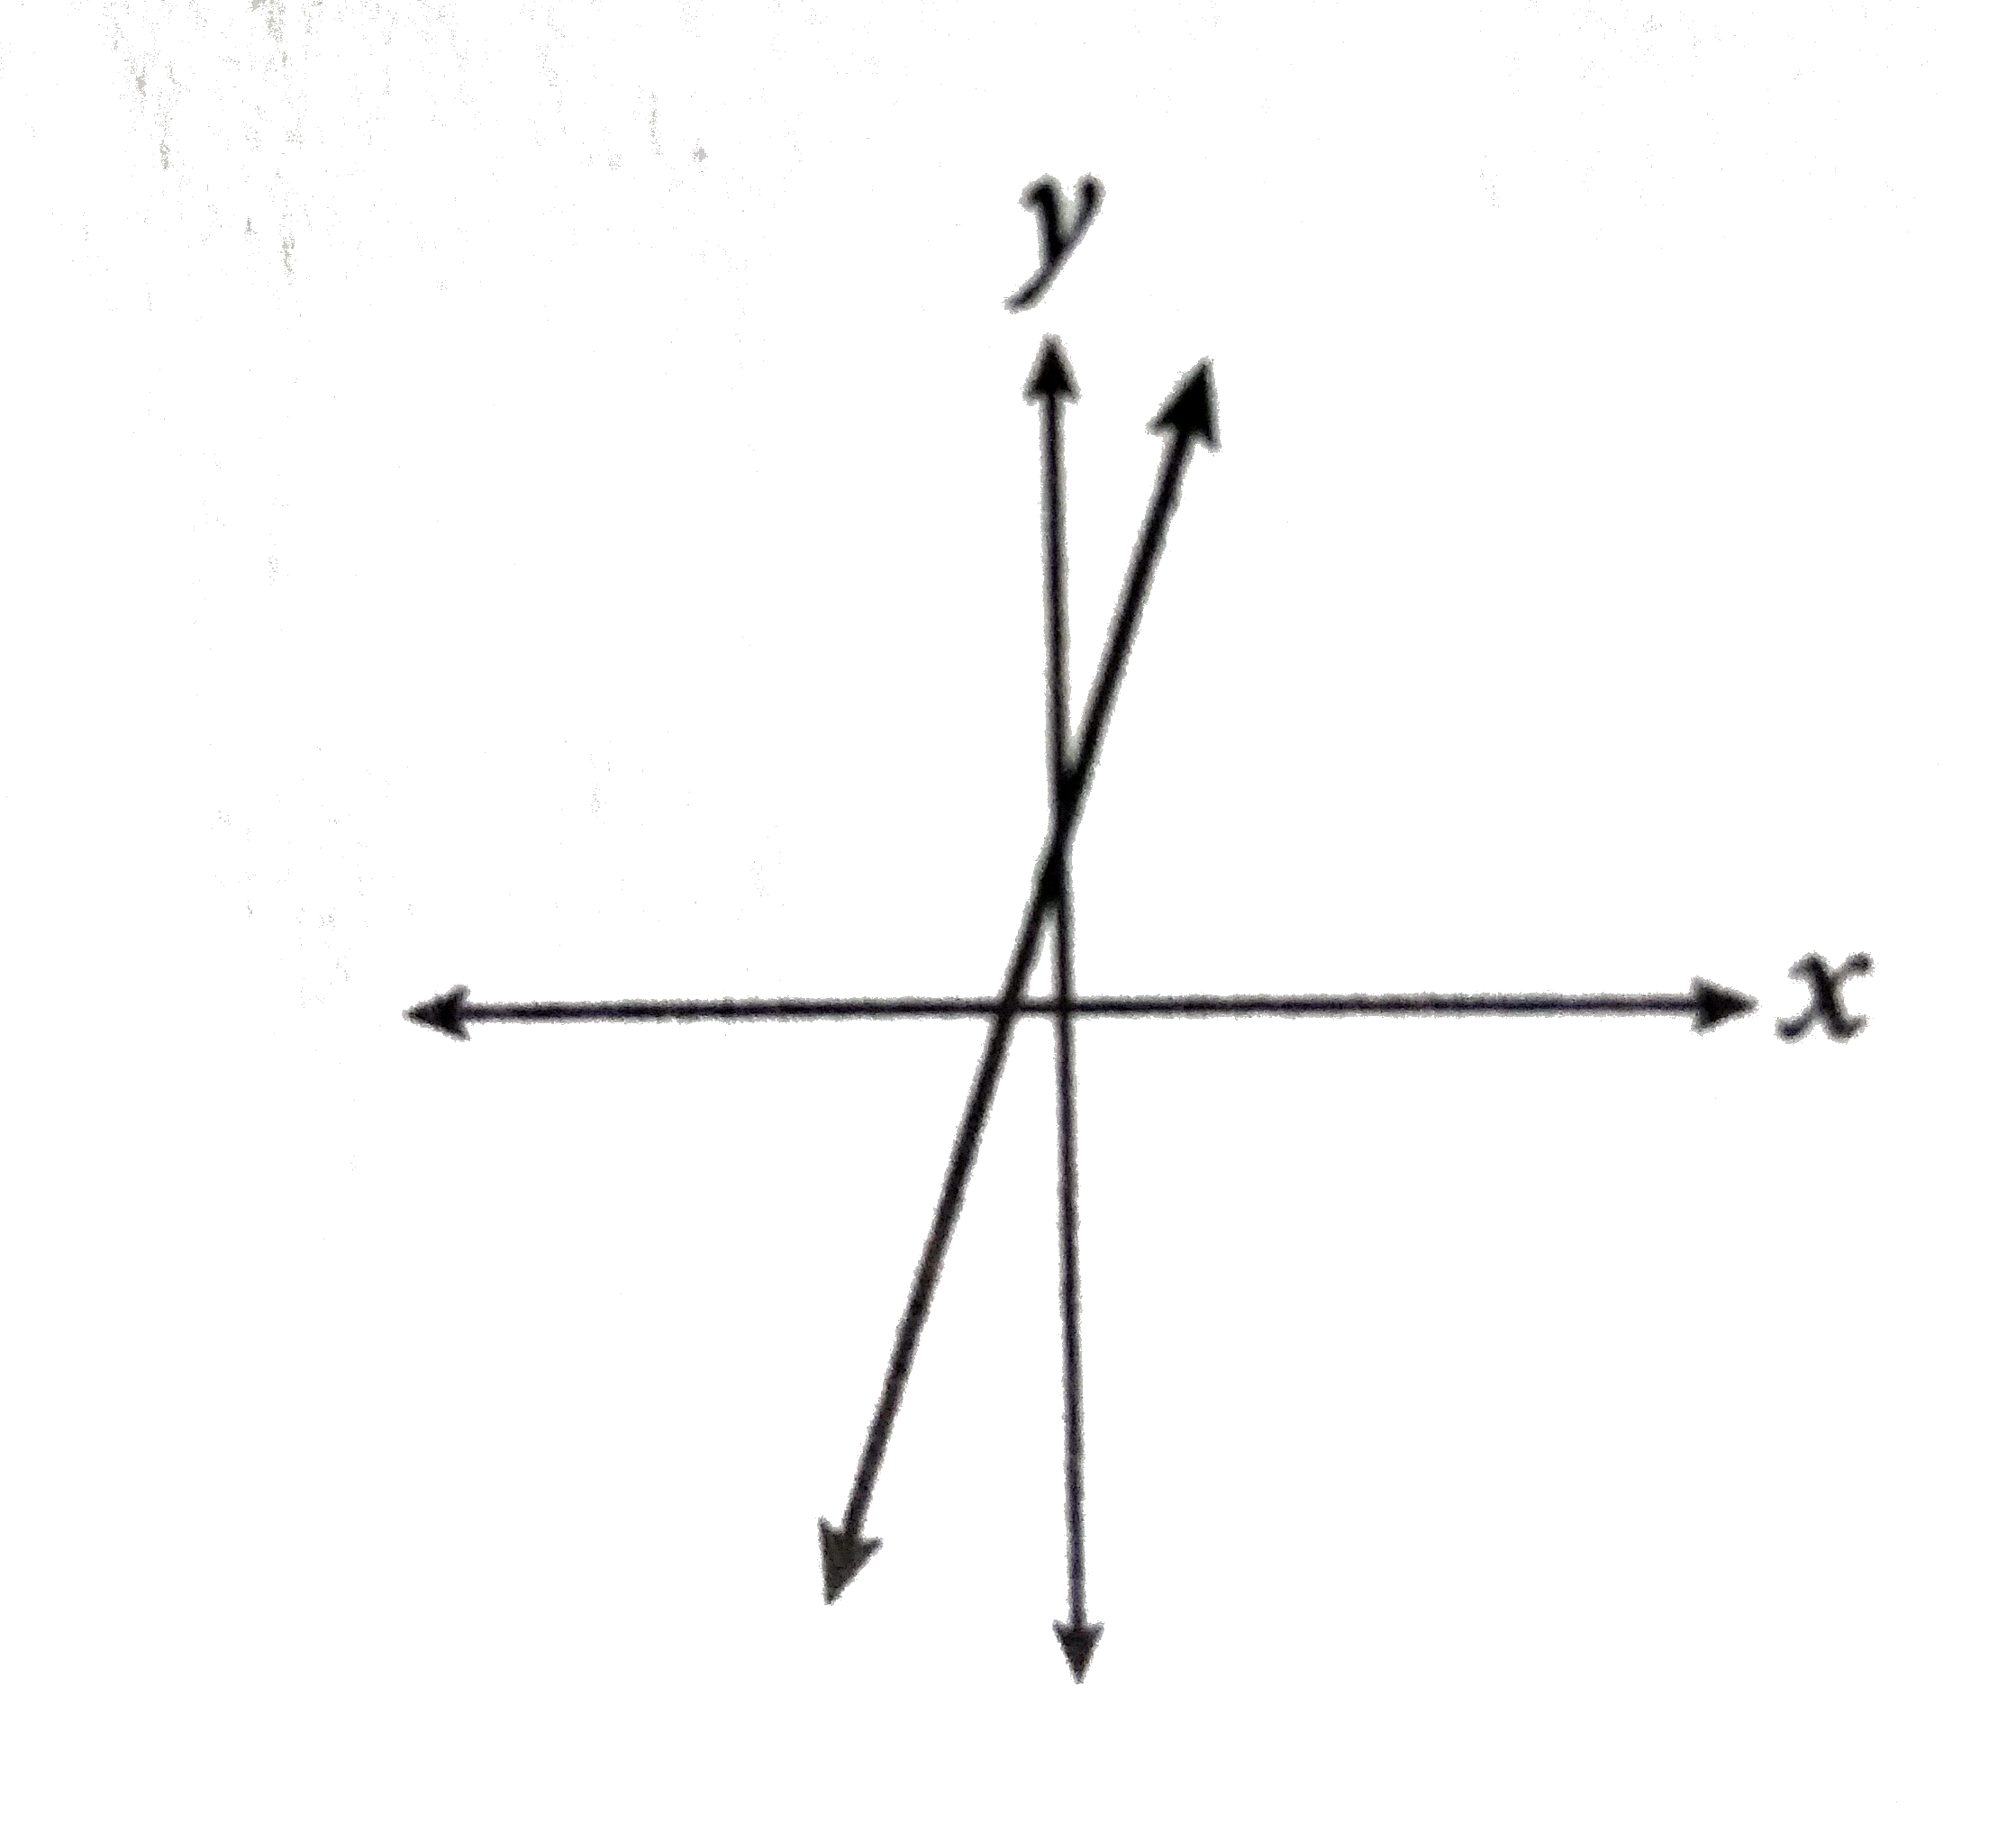 D
D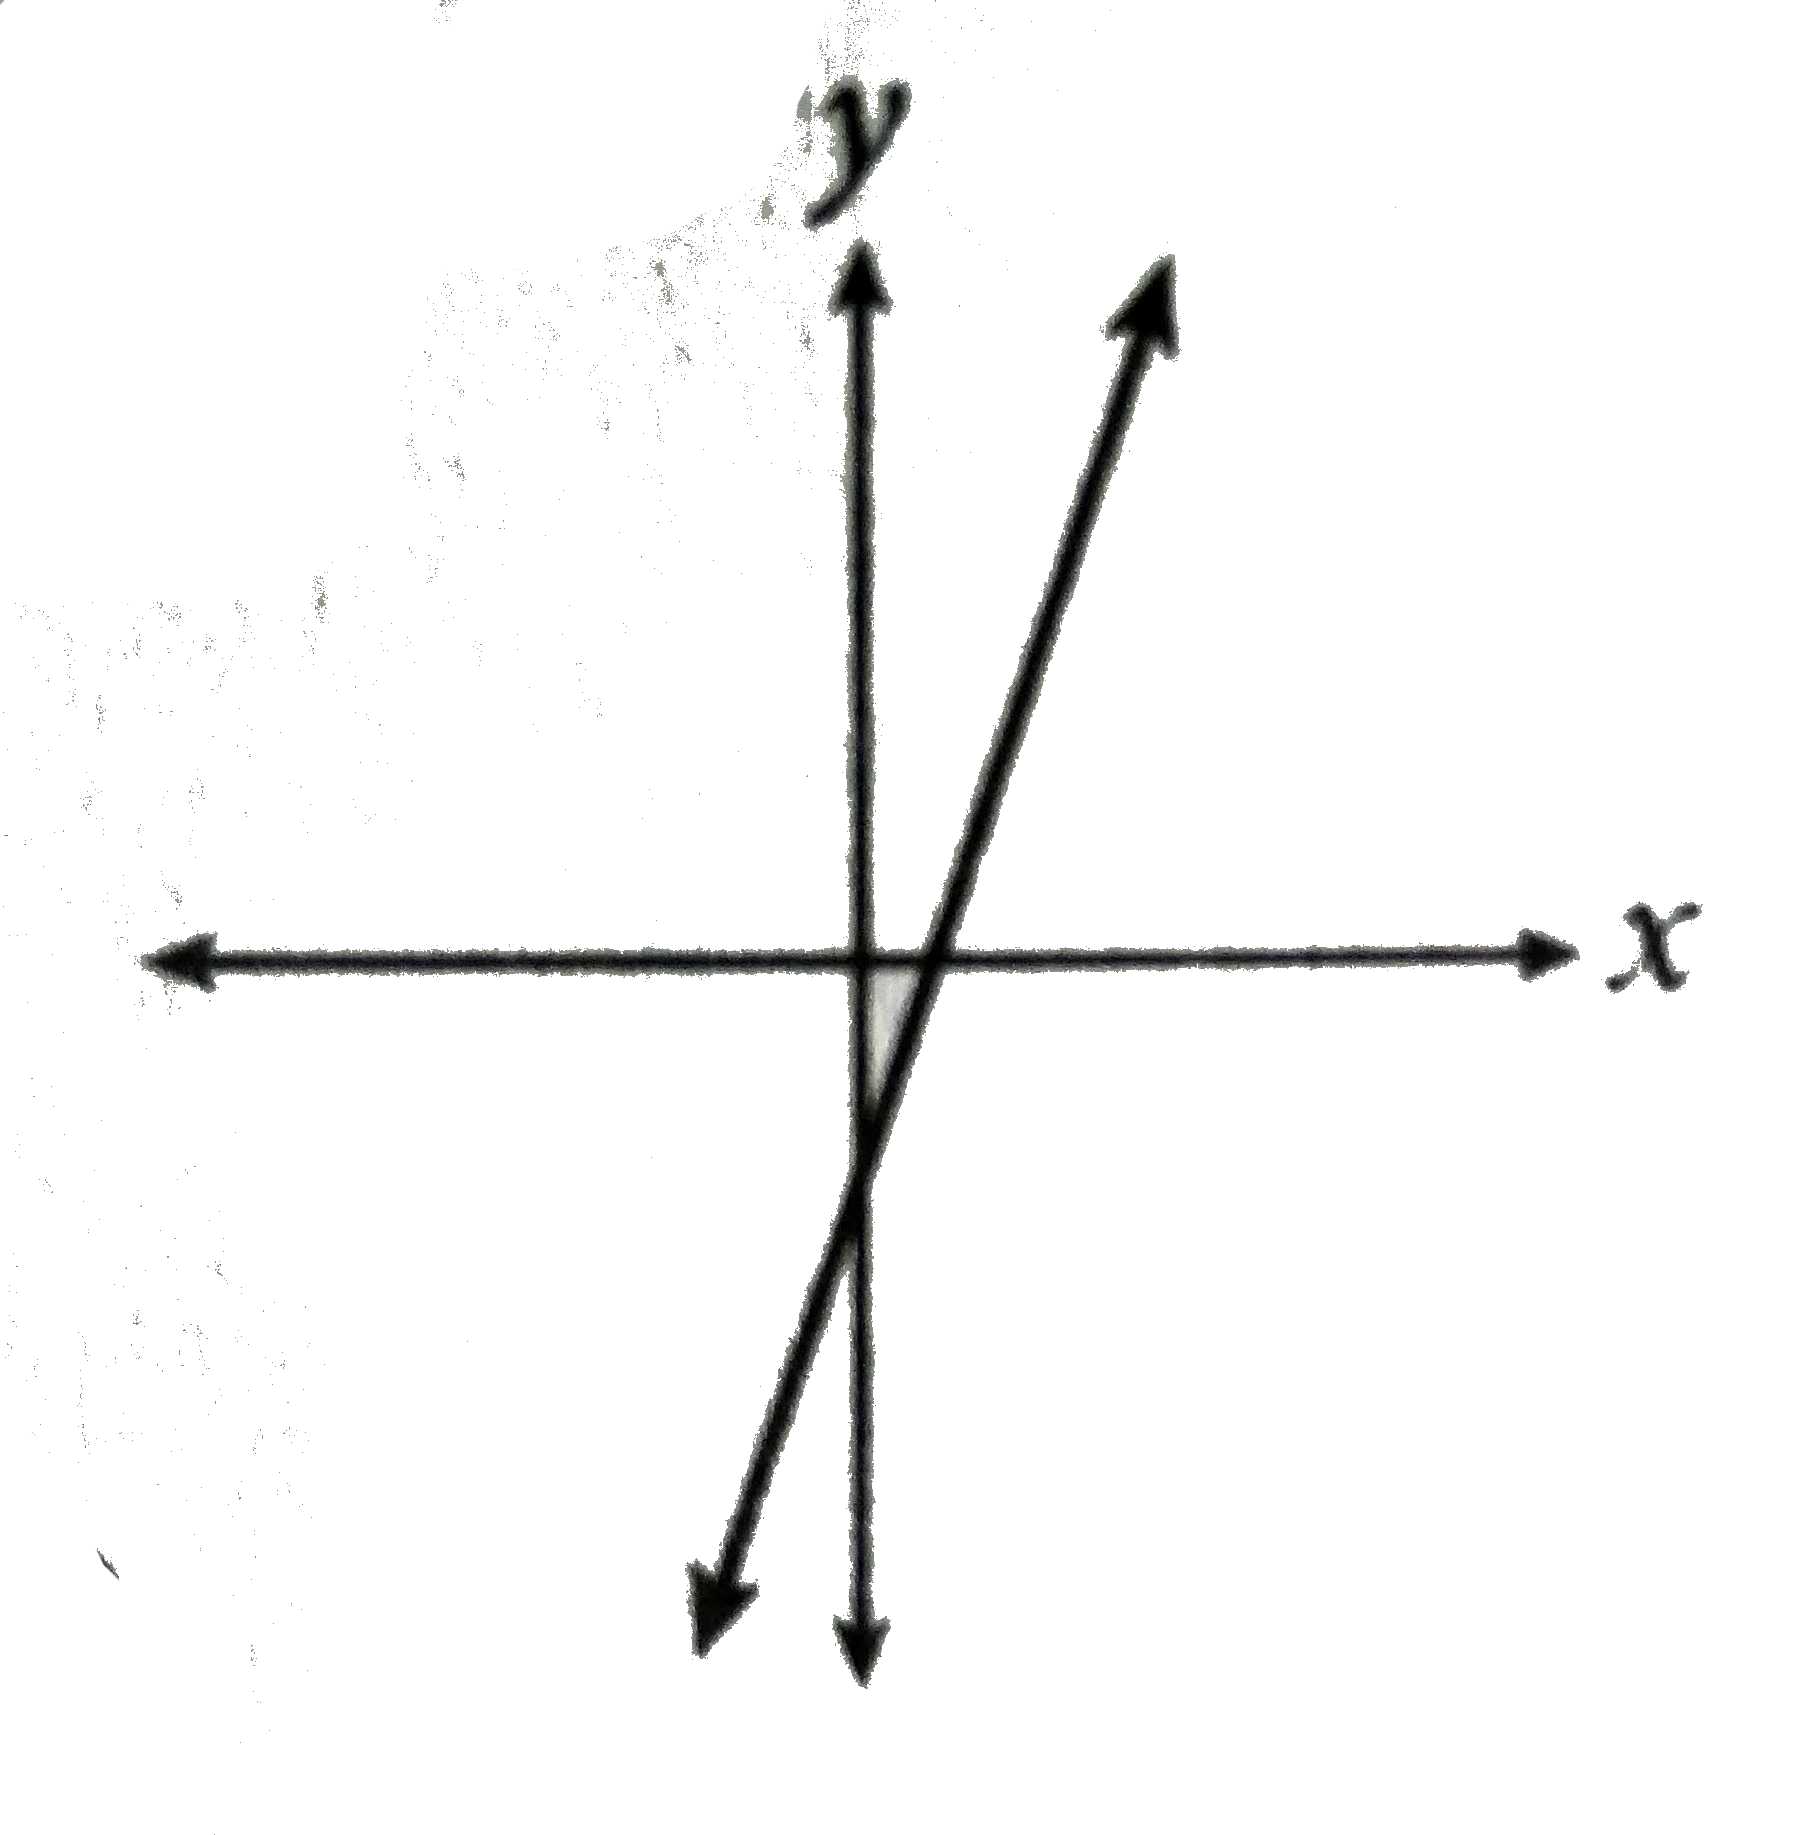
The graph of y=f(x) is shown below.
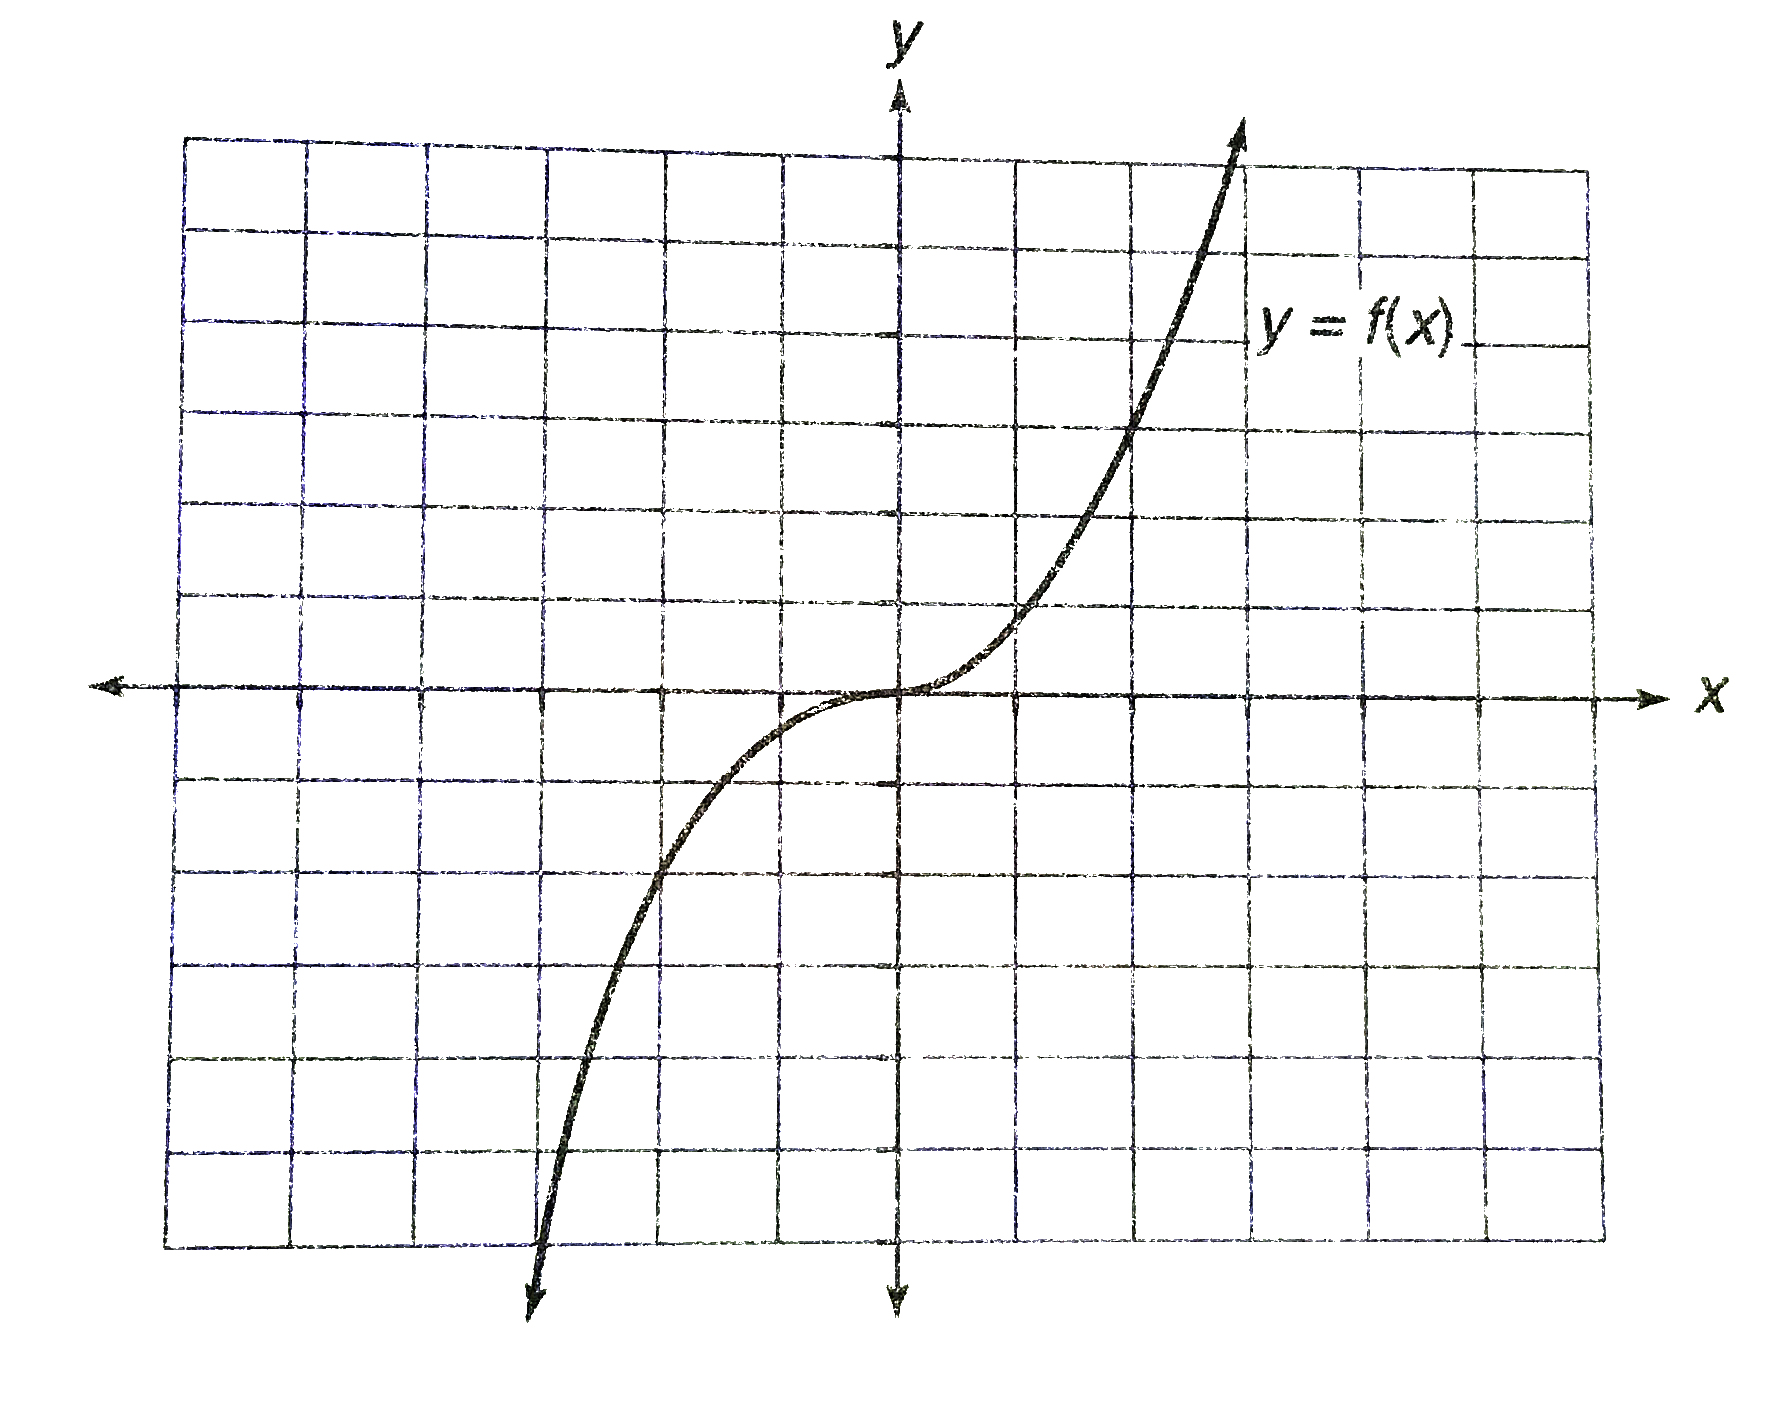
Which of the following could represents the graph of y=f(x−2)+1?
View SolutionIF x2+2xy+y2=64 and y-x=12, which of the following could be the value of x?
View Solution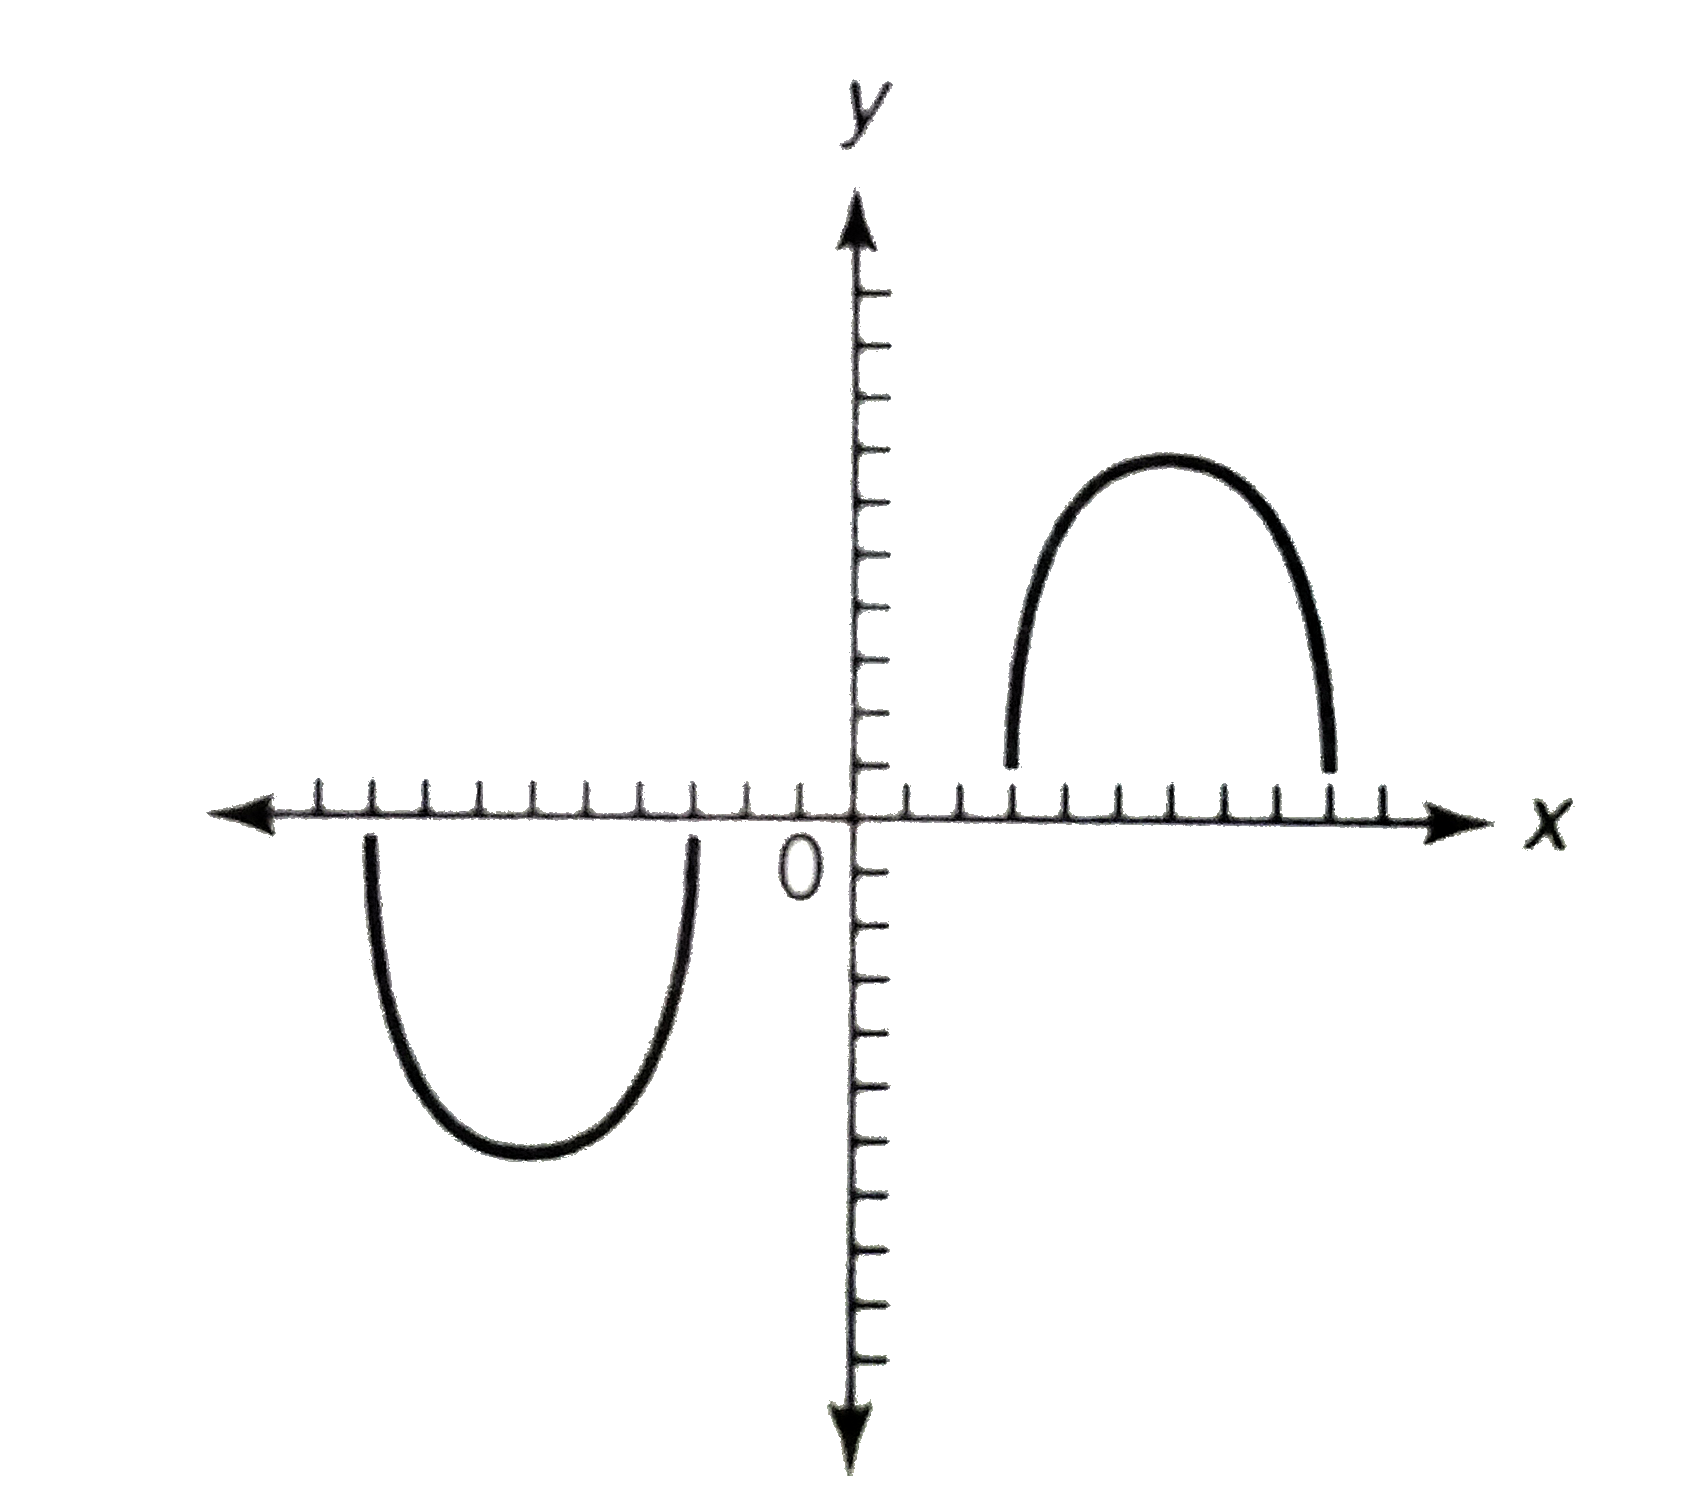
The graph of the function f is shown above. Which of the following could represent the graph of y=|f(x)|?
View Solution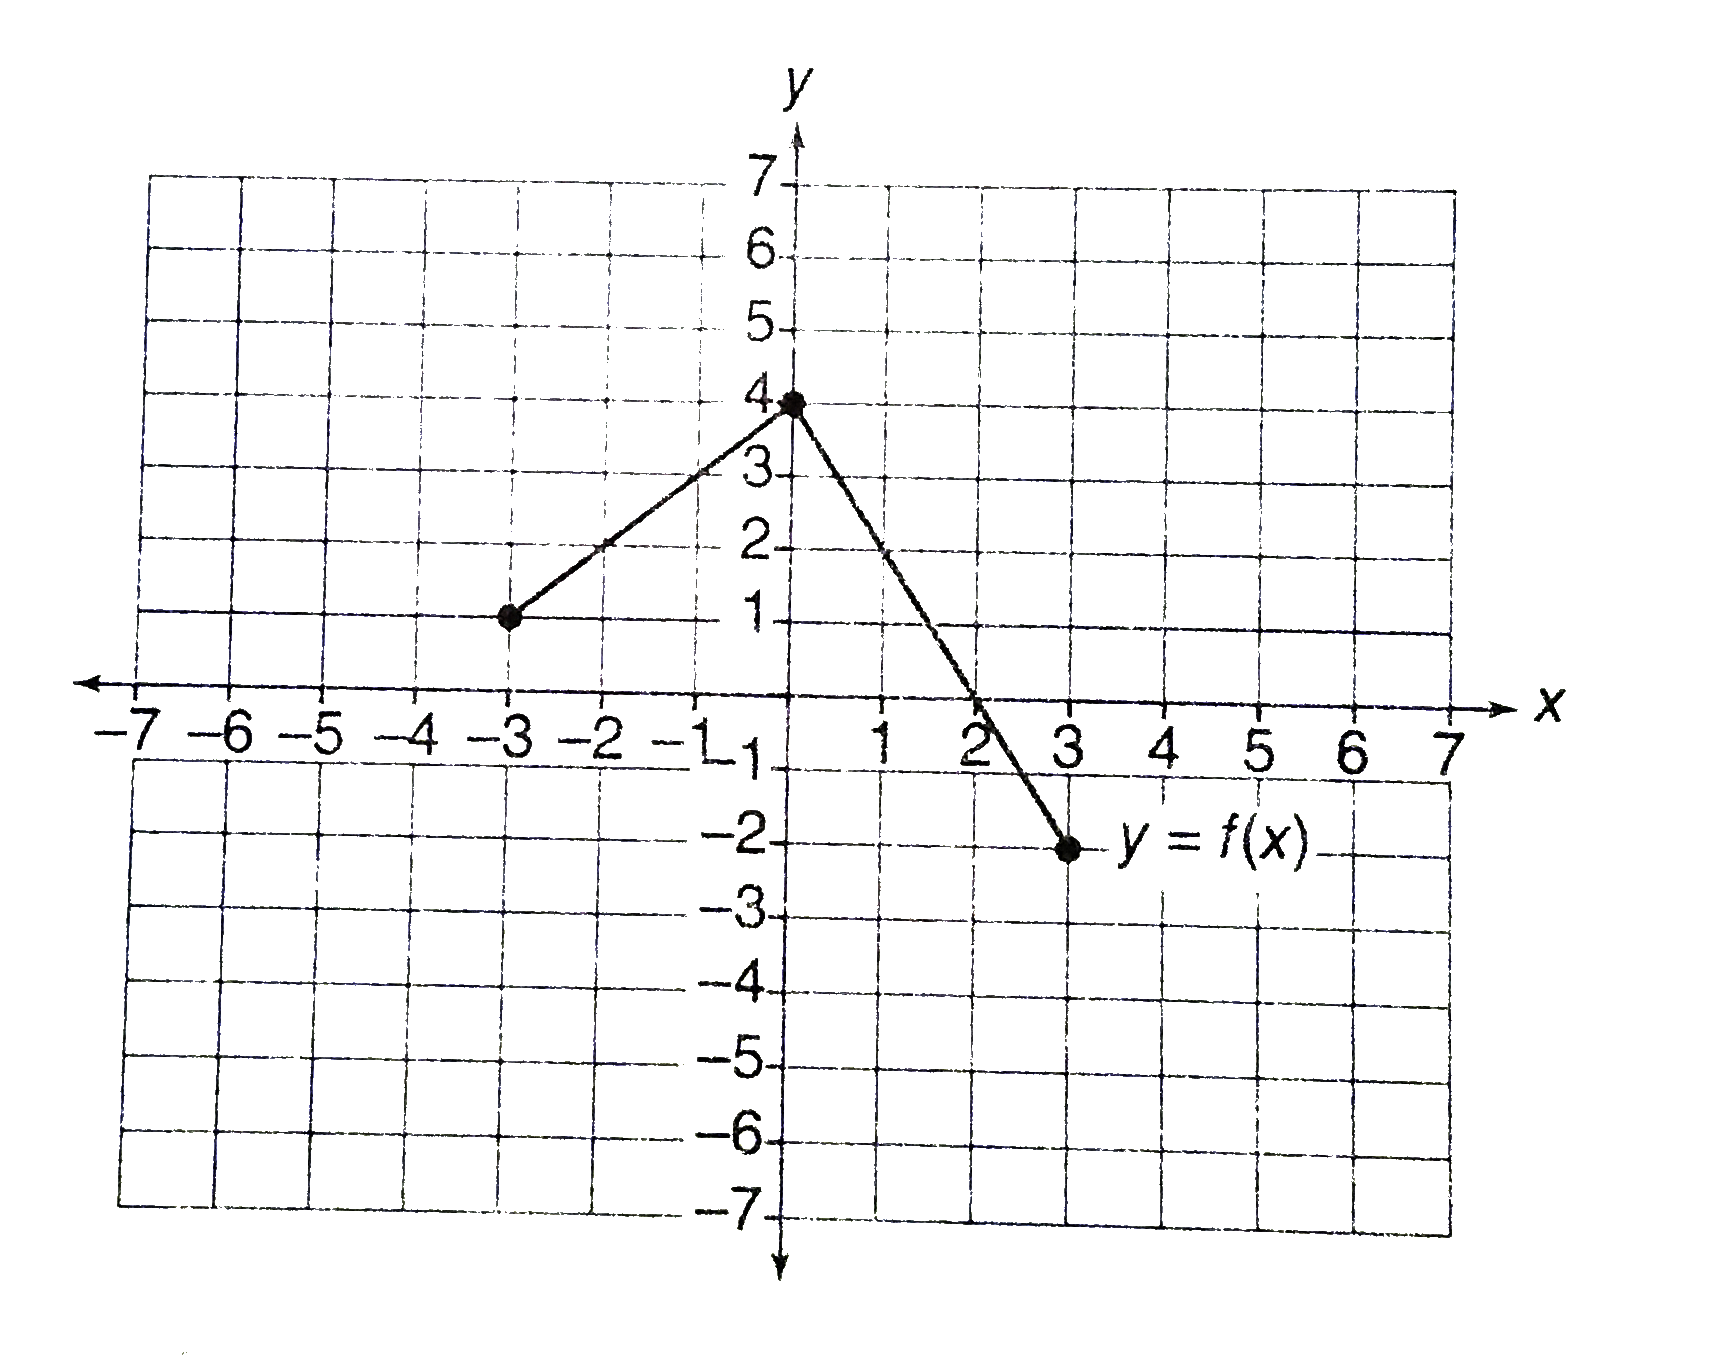
If the accomanying figure above shows the graph of function f, which of the following could represent the graph of y=f(x+1)?
View SolutionWhich of the following graphs could not be the graph of a function?
View Solution

