What conclusion would you draw from the following graphs for an ideal gas?
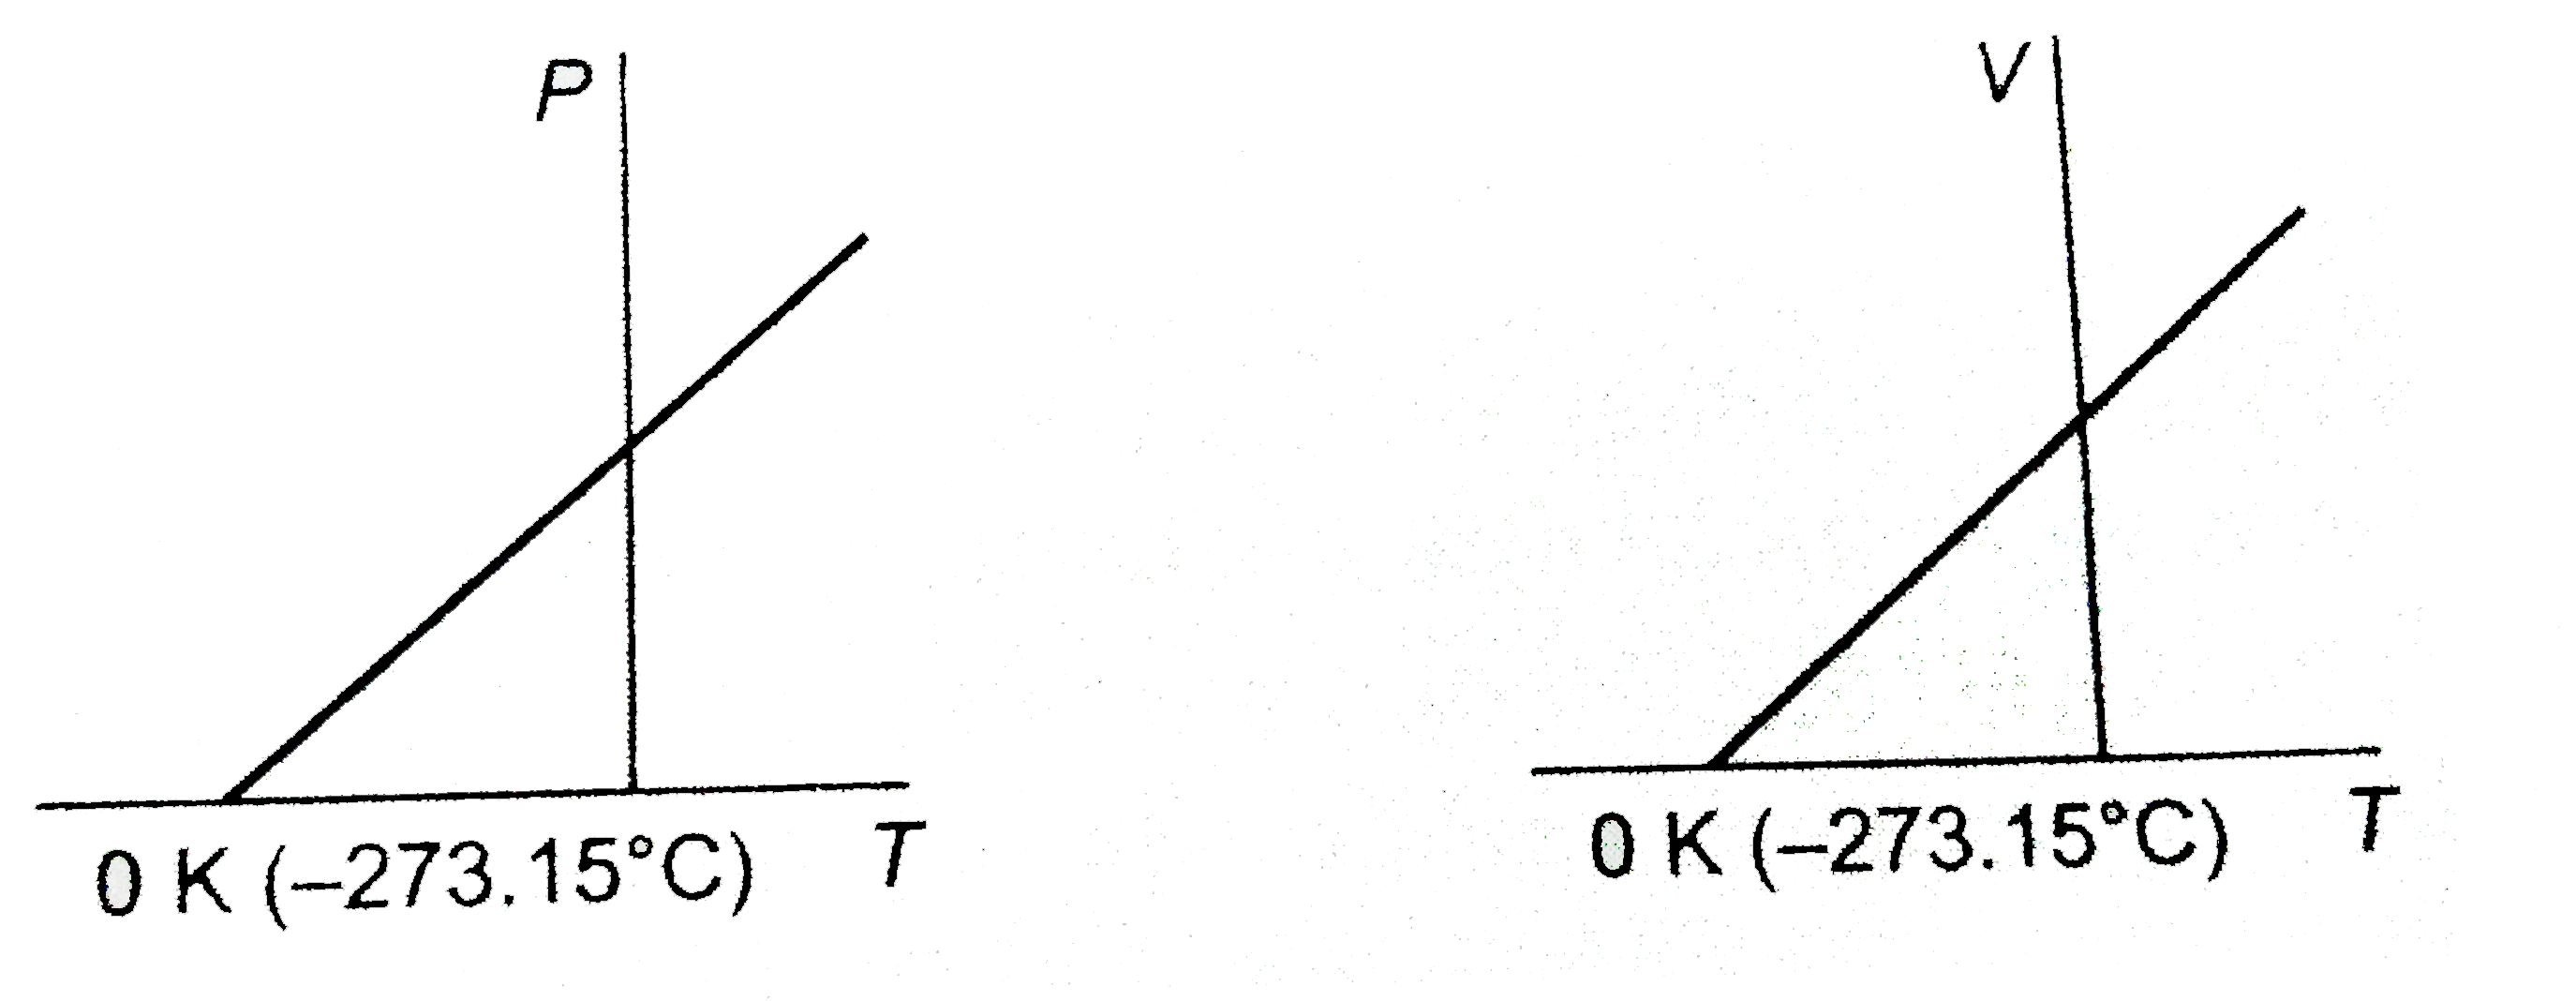
A
As the temperature is reduced, the volume as well as the pressure increases
B
As the temperature is reduced, the volume becomes zero and the pressure reaches infinity
C
As the temperature is reduced, the pressure decreases
D
A point is reached where, theoretically, the volume becomes zero
Video Solution
Text Solution
The correct Answer is:C, D
|
Similar Questions
Knowledge Check
Which of the following graphs is consistent with ideal gas behaviour?
A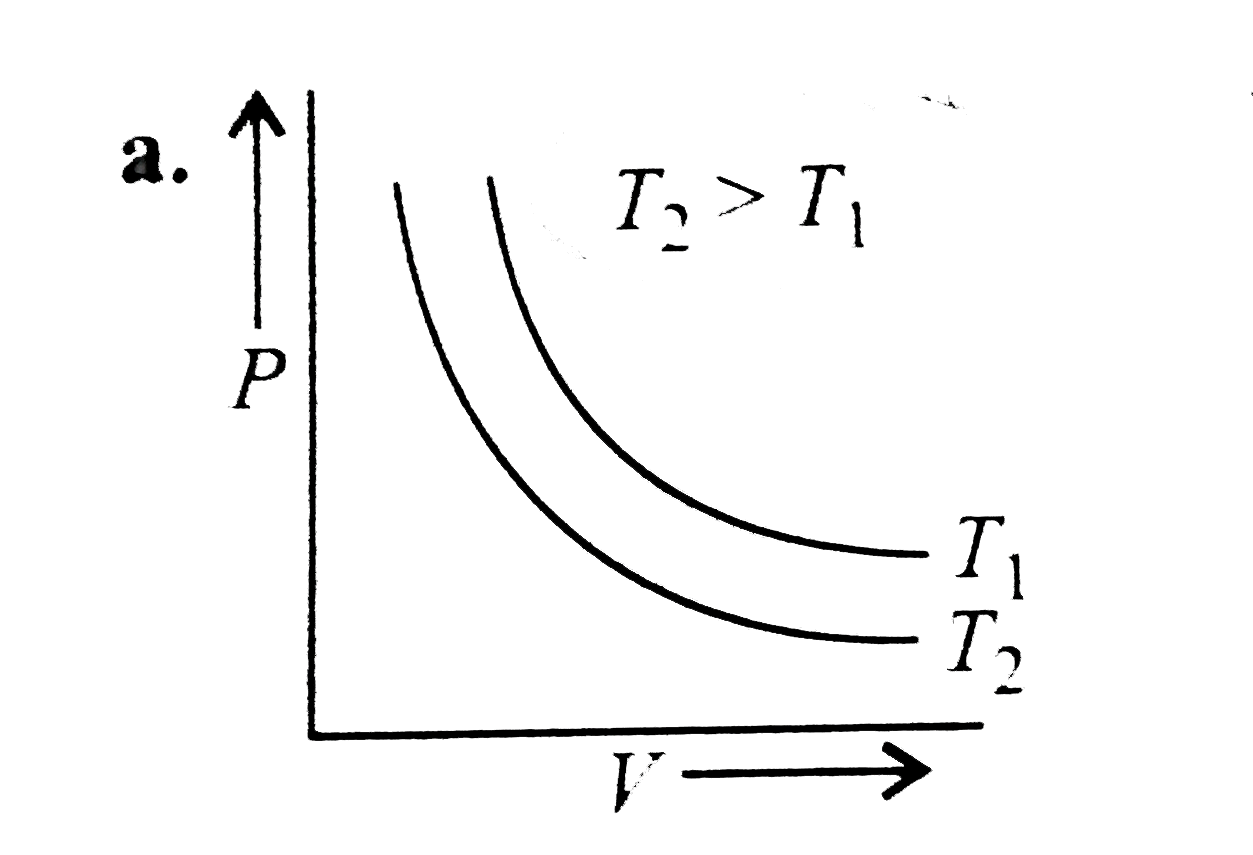 B
B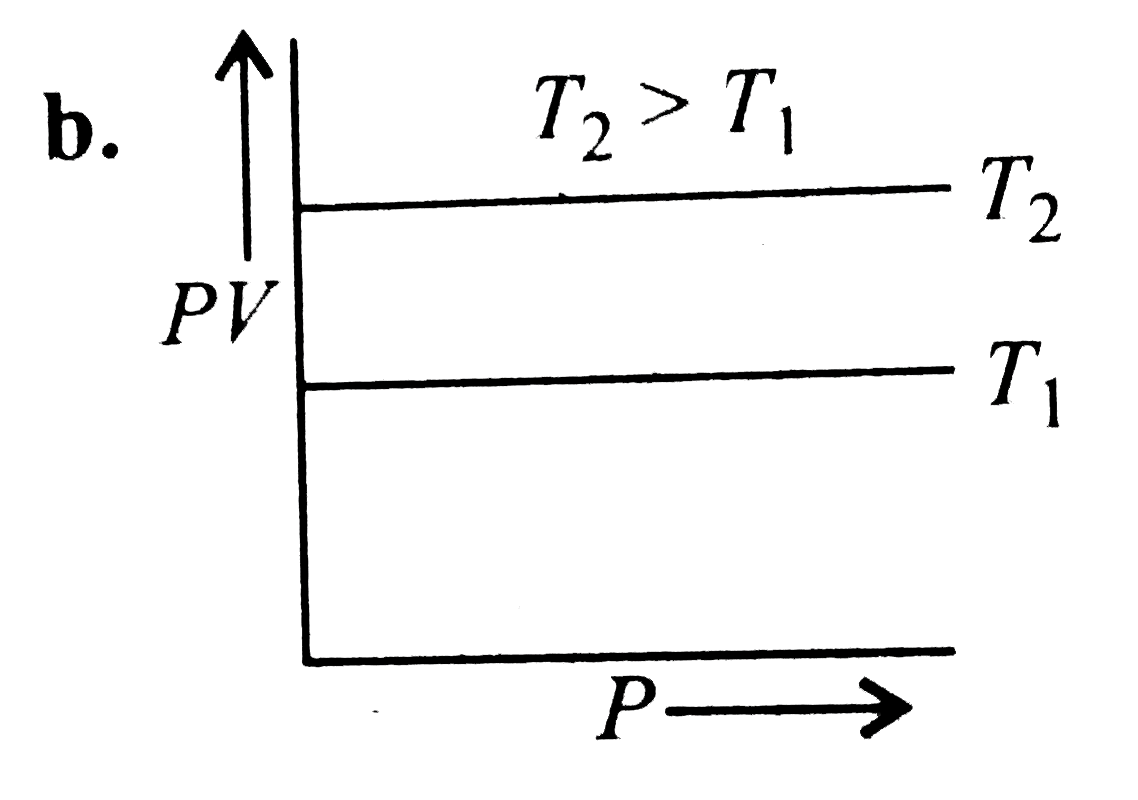 C
C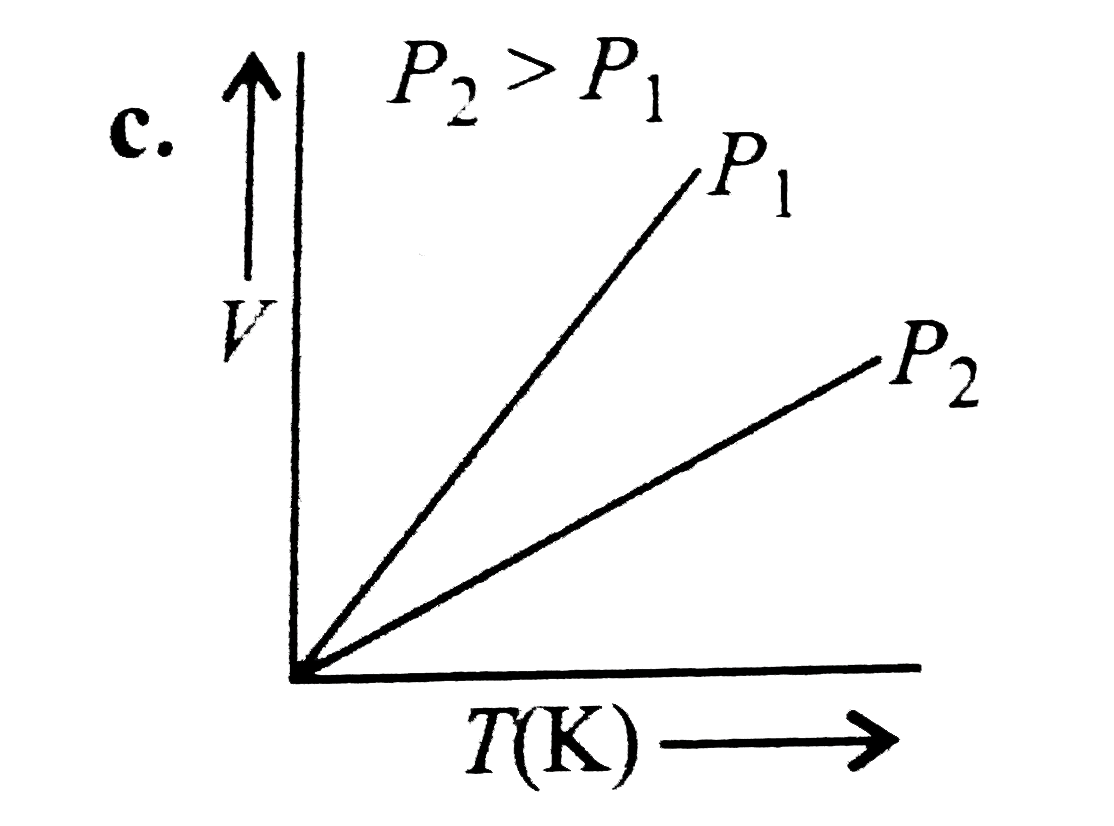 D
D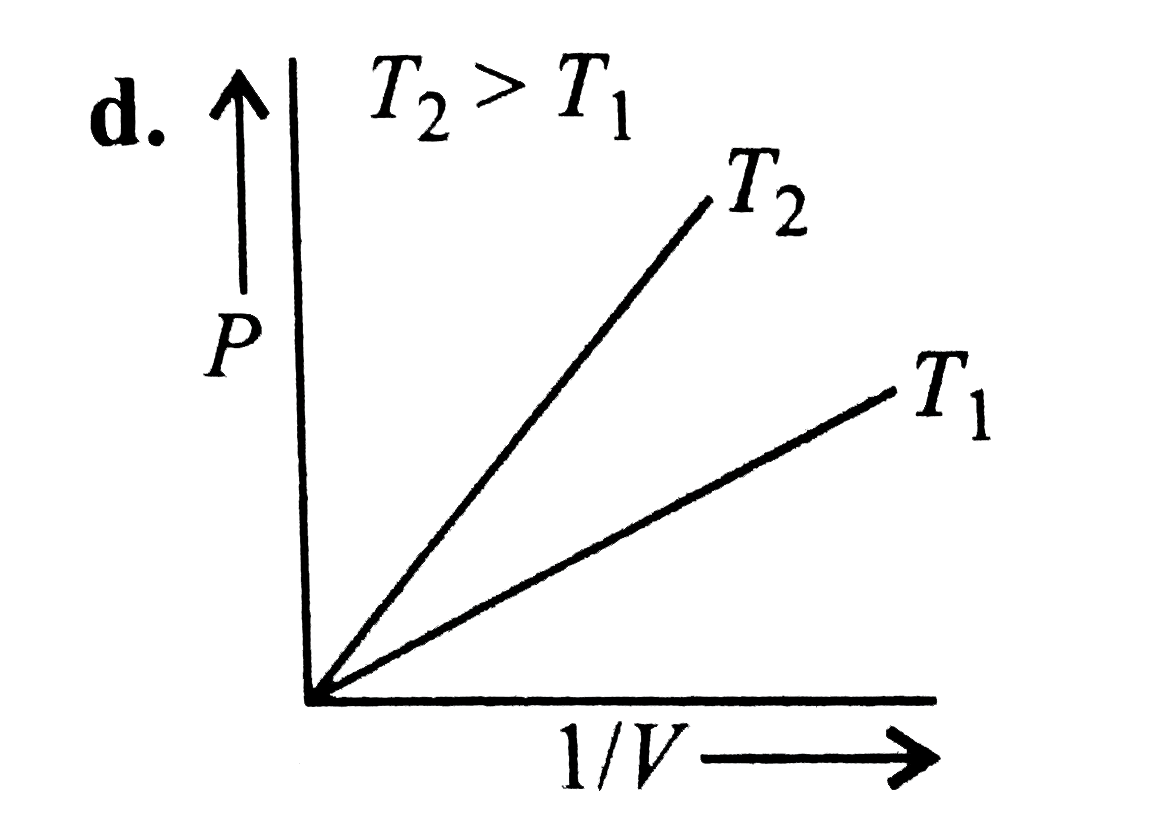
Which one of the following graphs correctly gives the ideal gas behaviour ?
A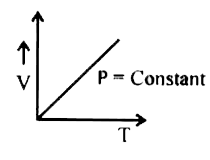 B
B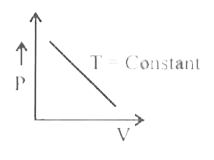 C
C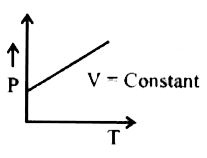 D
D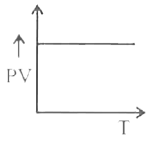
Which curve in the following graph represents the curve of ideal gas ?
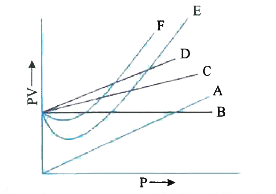 AB onlyBC and D onlyCE and F onlyDA and B only
What conclusions would you draw if the Lassaigne's extract gives a blood red colouration with FeCI3 ?
View SolutionWhat product(s) would you expect from the following solvolysis ?

View SolutionWhat conclusion do you draw when displacement-time graph of a body is as shwon in Figure ?
View SolutionWhat conclusion would you draw if during Lassaigne's test, a blood red colouration is obtained ?
View SolutionCO2 is non - polar while H2O is polar. What conclusion do you draw about their structures from these?
View Solution

