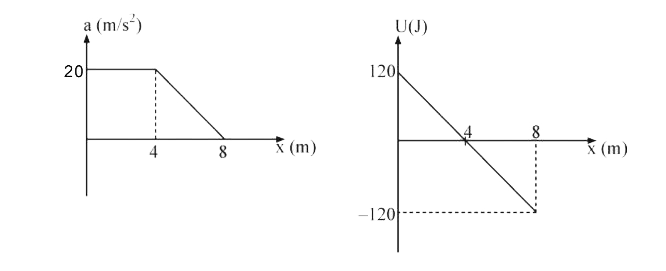
Acceleration versus x and potential energy versus x graph of a particle moving along x-axis is as shown in figure. Mass of the particle is 1 kg and velocity at x = 0 is 4 m/s. Match the following at x = 8m.
column IcolumnII(A)Kinetic Energy(P)120J(B)Work done by conservative forces(Q)240J(C)Total work done on the particle(R)128J(D)Work done by forces other than conservative forces(S)112J(T)None
The correct Answer is:A−R;B−Q;C−P;D−S
(v2f−v2i)=2×area of a - x graph=v2−422=120,v2=16+240=256,vf=16m/sec
⇒KEf=12(1)(16)2=128J, ΔKE=12m(v2f−v2i)=120J
Work done by all the forces , Work done by conservative forces =
Ui−Uf=240J
Work done by other forces = Total work done – Work done by conservative forces = -120 J.
Similar Questions
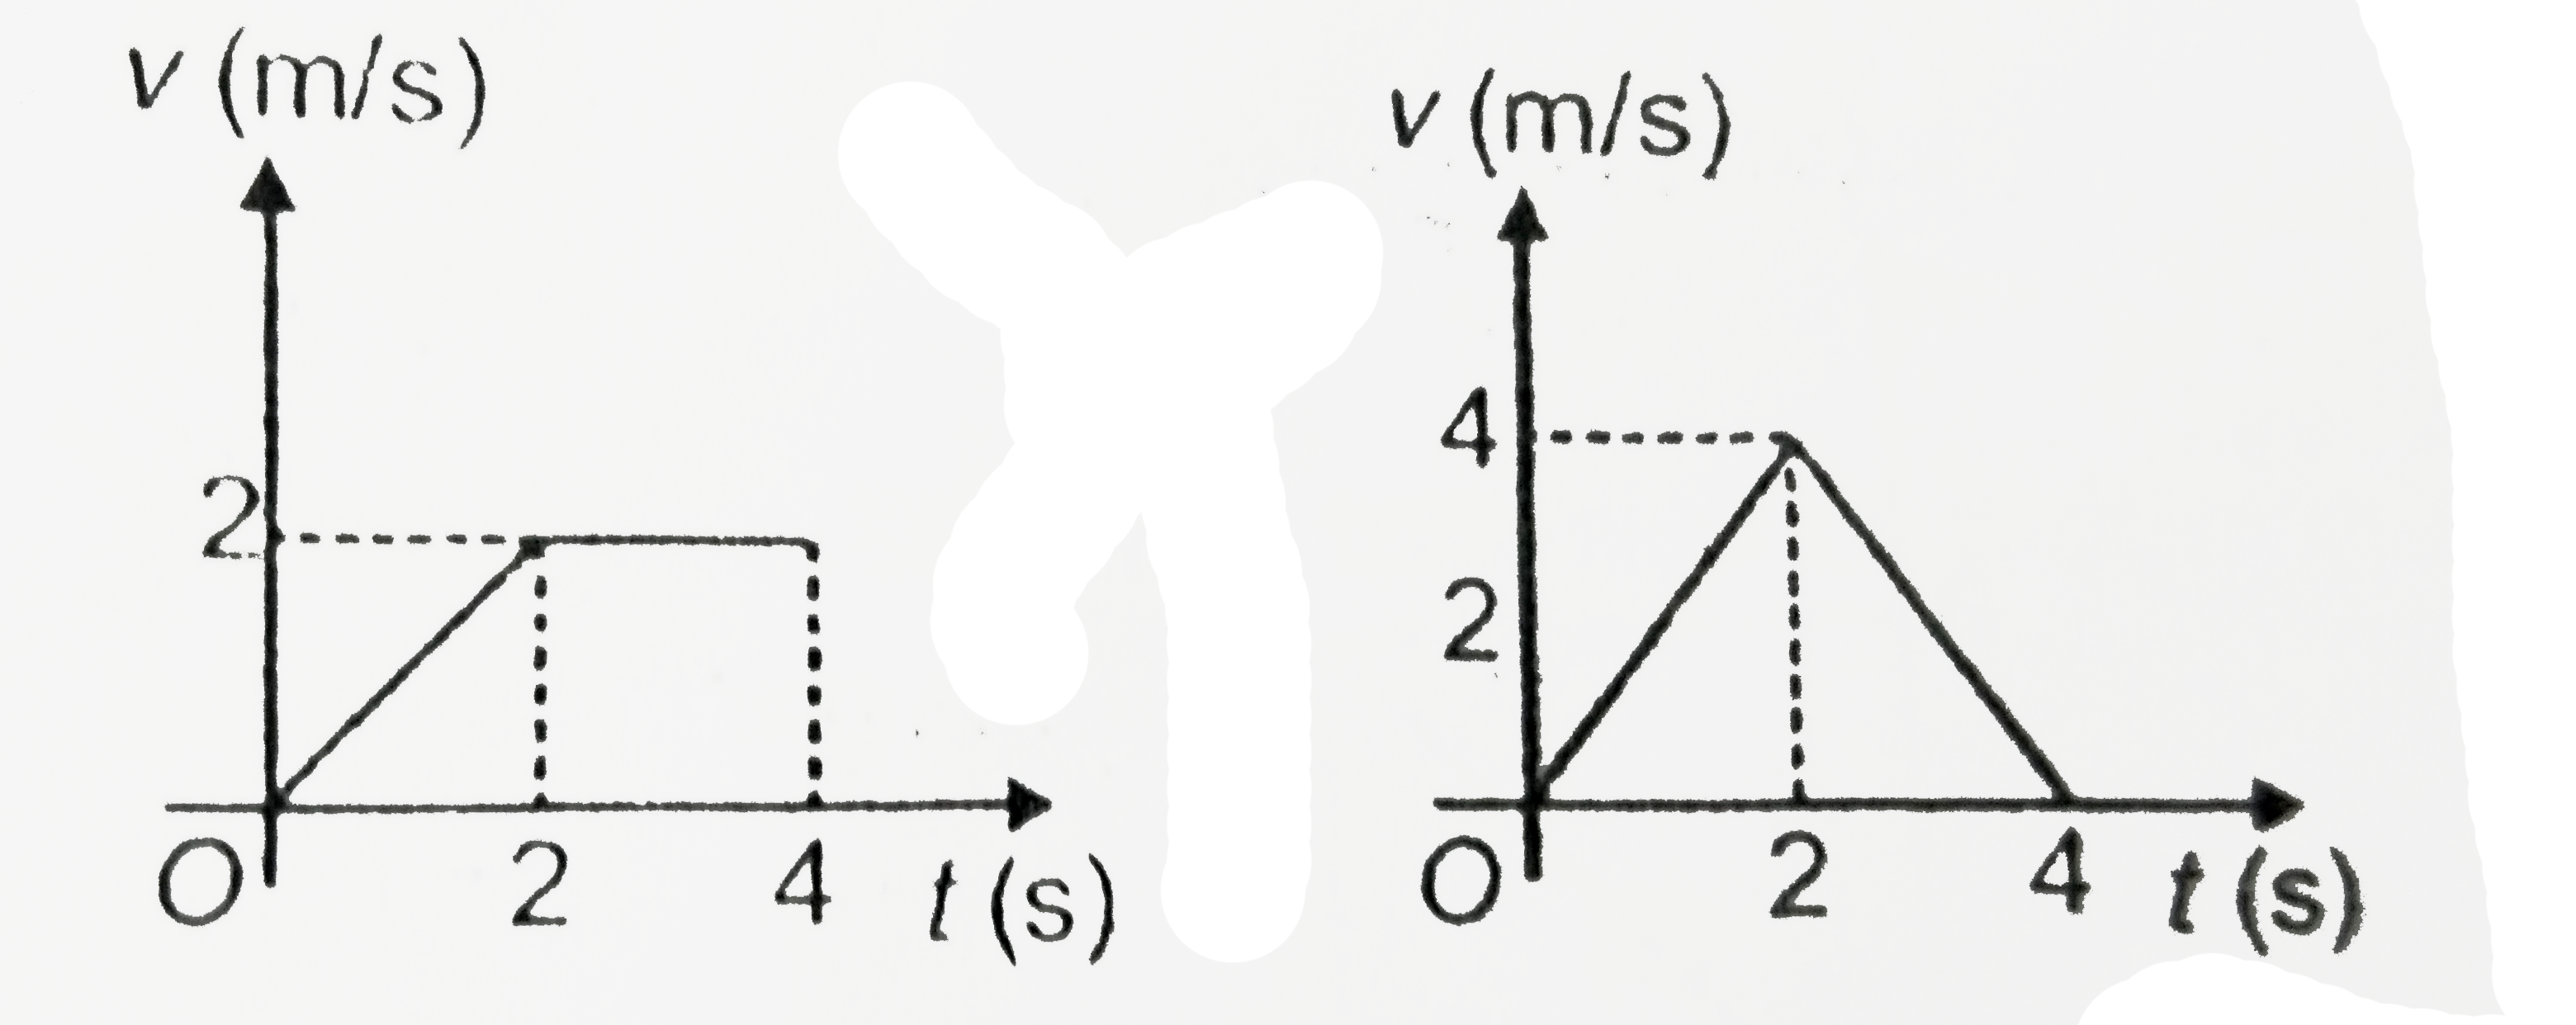
The velocity versus time graph of two particles moving along x-axis varies are shown in the following two plots. Then
View SolutionMatch the following :
Column-I Column-II(A)Work done by all the forces(P)Change in potential energy(B)Work done by conservative forces(Q) Change in kinetic energy(C)Work done by external forces(R) Change in mechanical energy(S) None
View Solution
Knowledge Check
The acceleration - time graph for a particle moving along x - axis is shown in figure, If the initial velocity of particle is −5m/s, the velocity at t = 8 s is
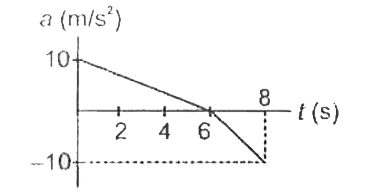 A+15m/sB+20m/sC−15m/sD−20m/s
The kinetic energy (KE) versus time graph for a particle moving along a straight line is as shown in the figure. The force versus time graph for the particle may be
 A
A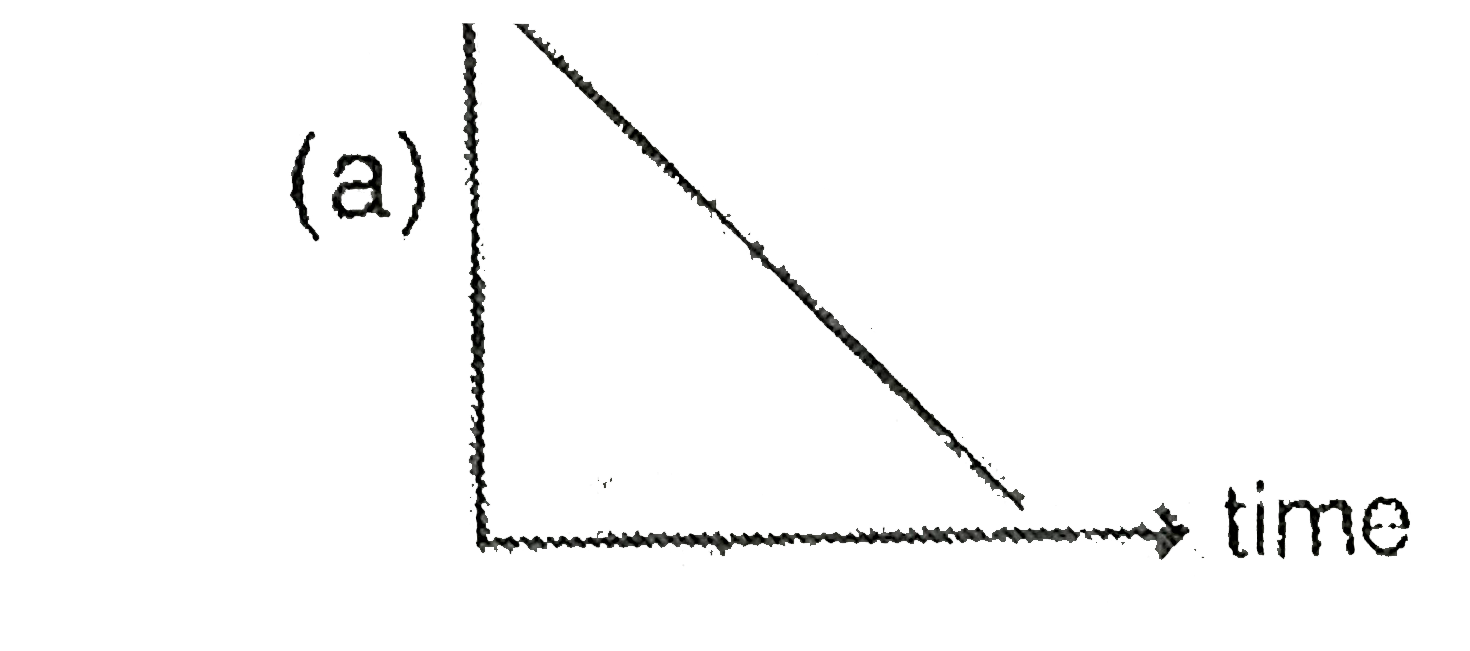 B
B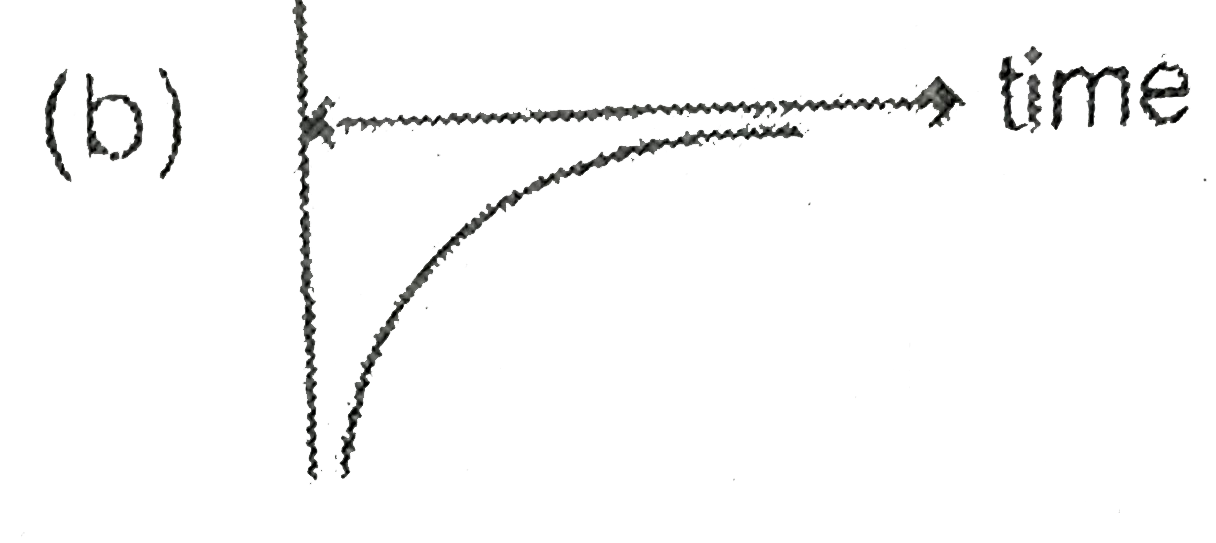 C
C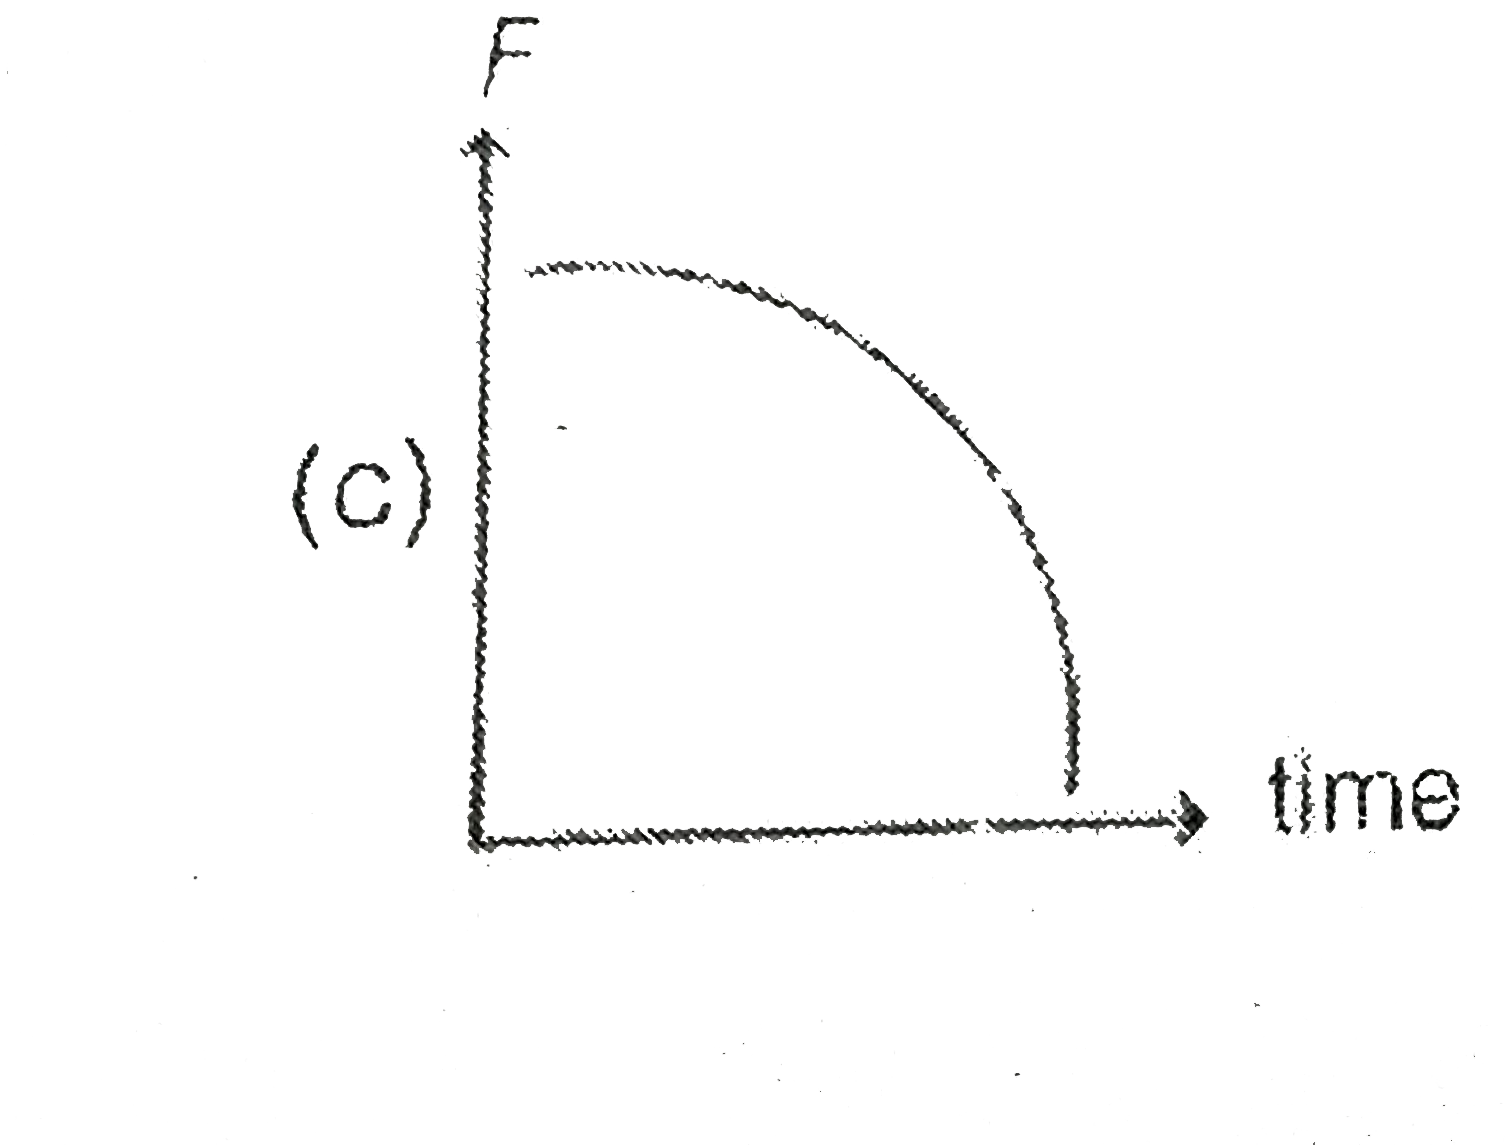 D
D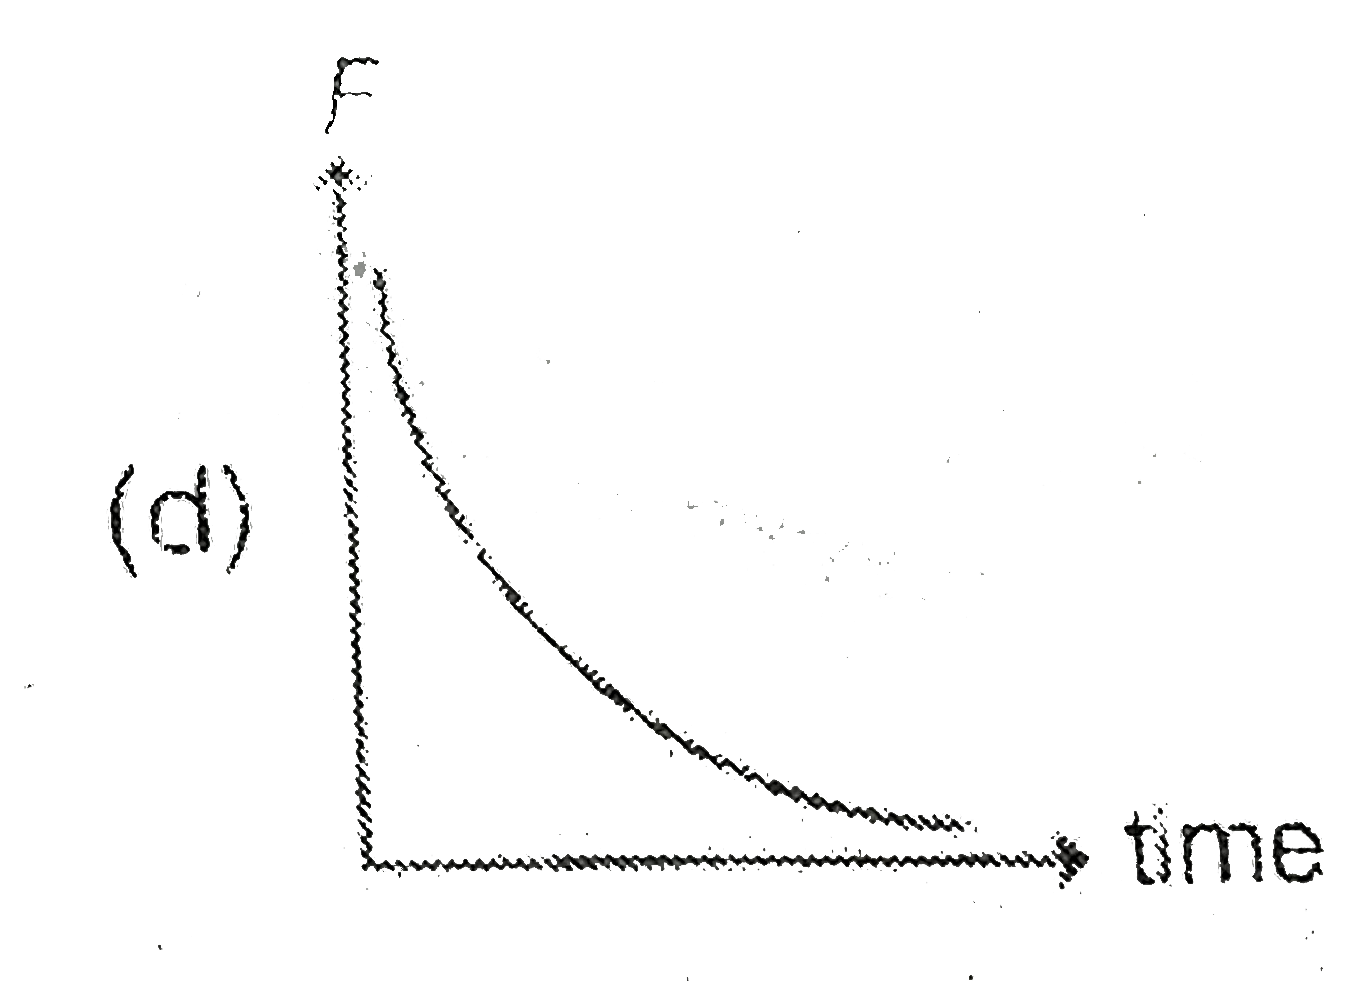
Position time graph of a particle of mass 2 kg is shown in figrure. Total work done on the particle from t=0 to t=4s is
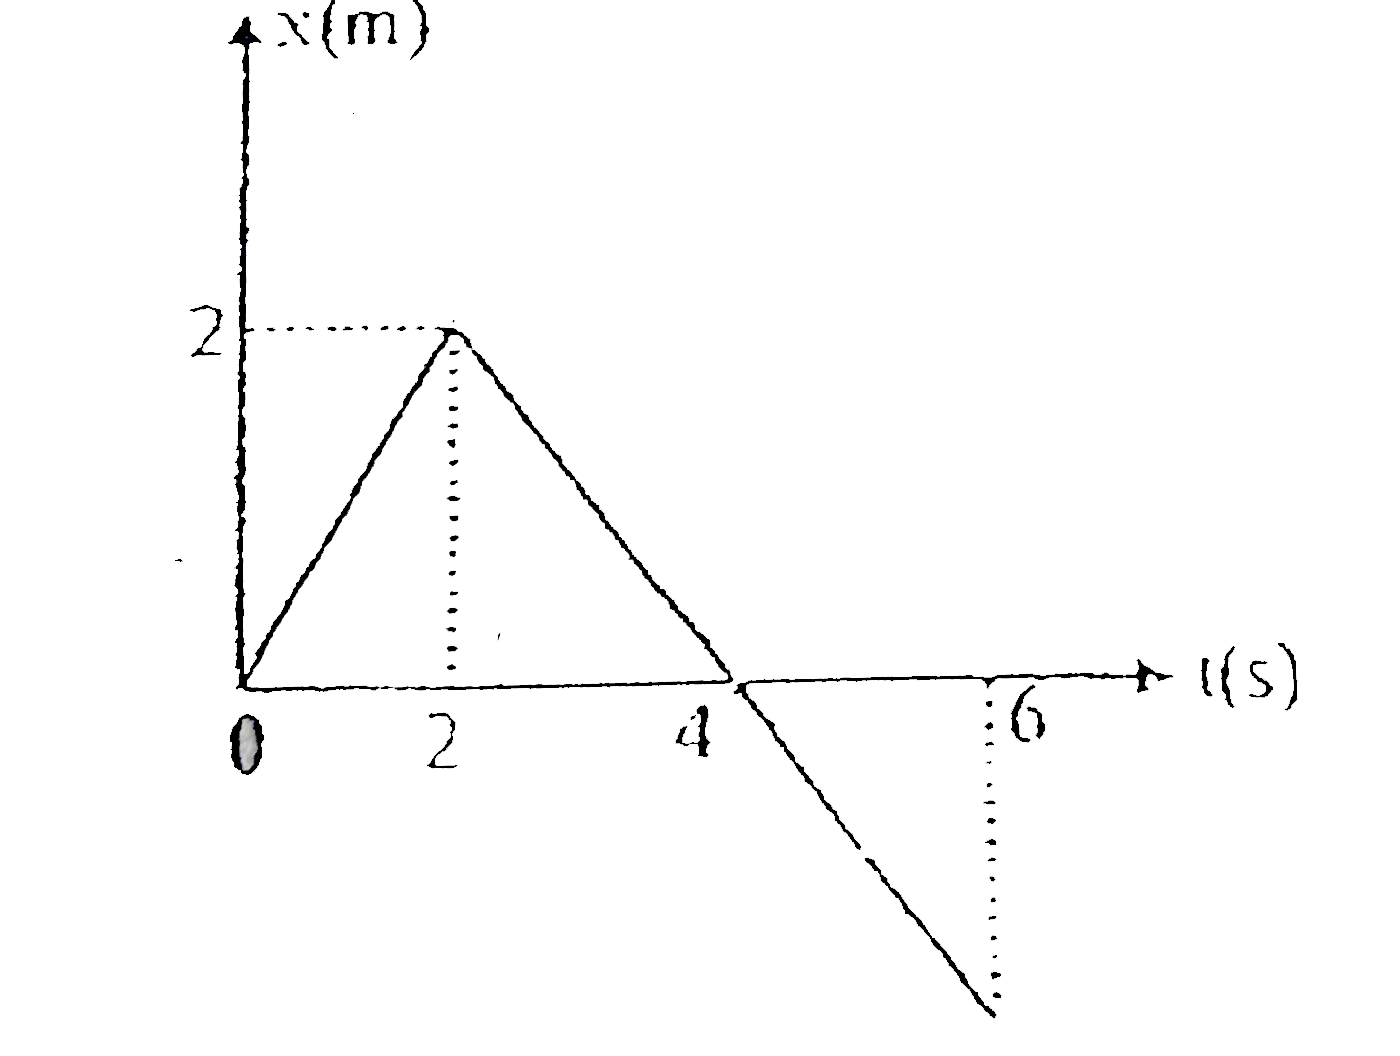 A8 JB4 JC0 JDCan't be determined
Velocity (v) versus position (x) graph of a particle is shown.The acceleration of the particle at x=1m is ?
View SolutionTwo particles are moving along x-axis. Their x-coordinate versus time graph are as shown below.

Find velocity of A w.r.t. B
View SolutionForce acting on a particle varies with x as shown in figure. Calculate the work done by the force as the particle moves from x = 0 to x = 6.0 m.
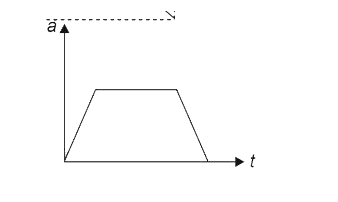
View SolutionAcceleration versus time graph of a particle moving in a straight line is as shown in adjoining figure. If initially particle was at rest. Then corresponding kinetic energy versus time graph will be :
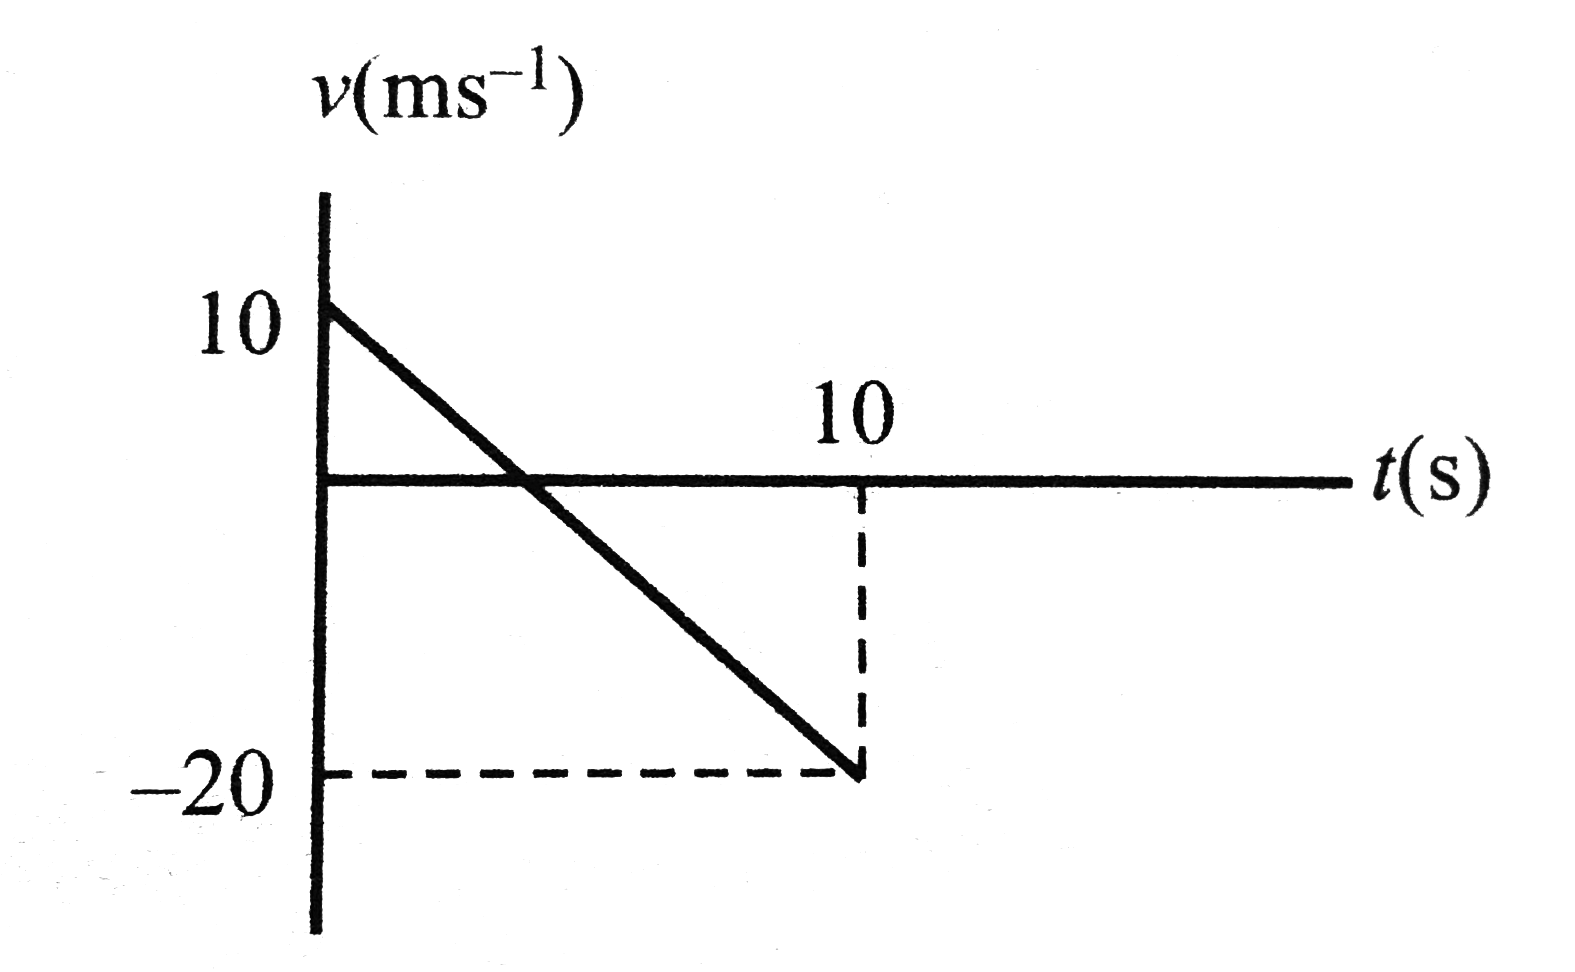
View SolutionThe velocity-time graph of a particle moving in a straight line is shown in figure. The mass of the particle is 2kg. Work done by all the forces acting on the particle in time interval between t=0 to t=10s is
View Solution

